Zip Codes with the Largest Russian Community in Florida
RELATED REPORTS & OPTIONS
Russian
Florida
Compare Zip Codes
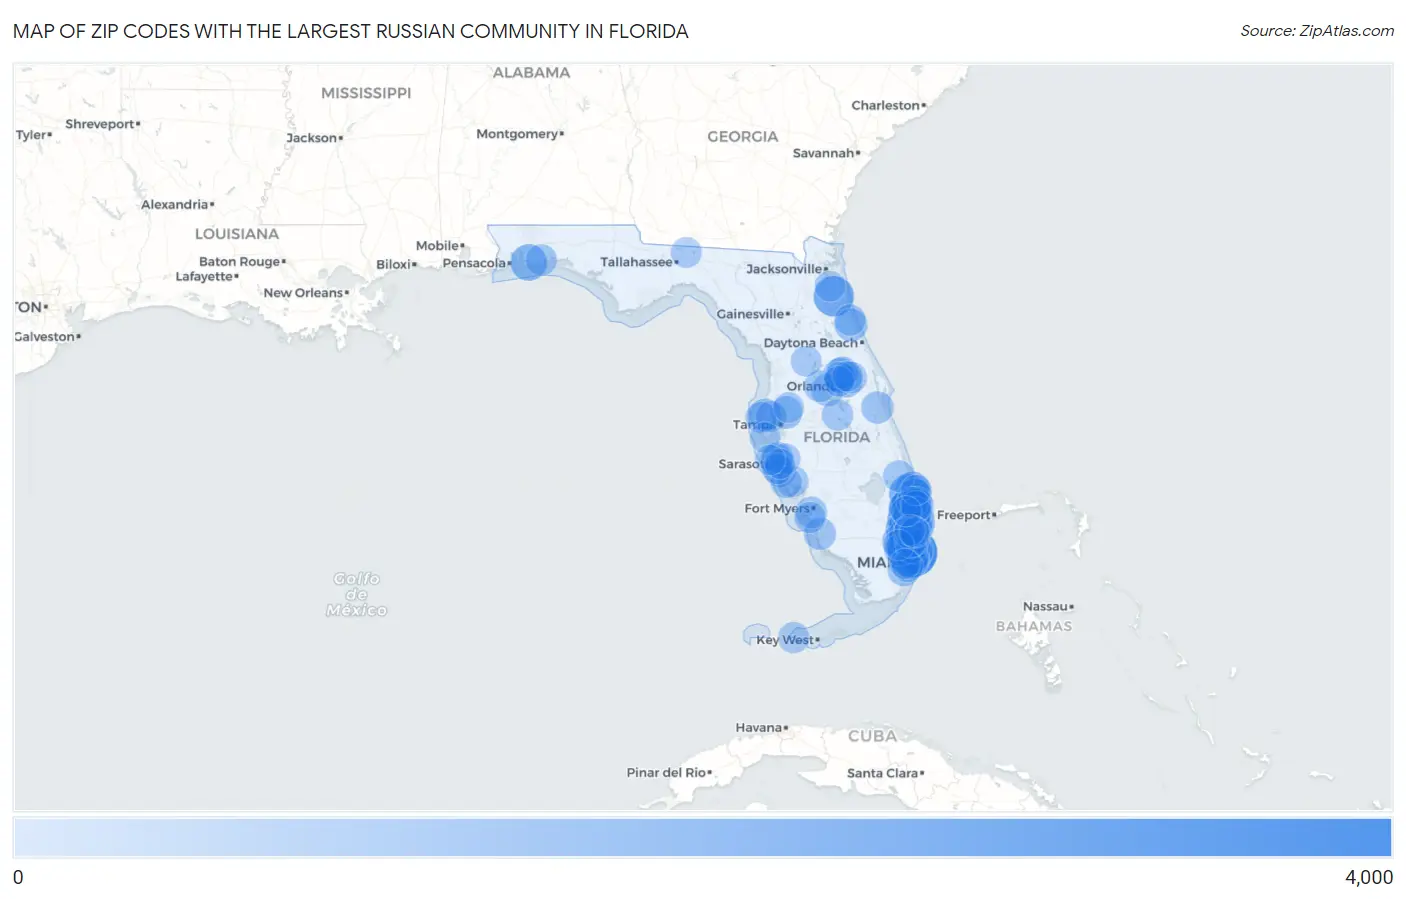
Map of Zip Codes with the Largest Russian Community in Florida
0
4,000
Zip Codes with the Largest Russian Community in Florida
| Zip Code | Russian | vs State | vs National | |
| 1. | 33160 | 3,242 | 189,876(1.71%)#1 | 2,387,570(0.14%)#14 |
| 2. | 33496 | 2,830 | 189,876(1.49%)#2 | 2,387,570(0.12%)#20 |
| 3. | 33446 | 2,593 | 189,876(1.37%)#3 | 2,387,570(0.11%)#30 |
| 4. | 33437 | 2,539 | 189,876(1.34%)#4 | 2,387,570(0.11%)#32 |
| 5. | 33433 | 2,398 | 189,876(1.26%)#5 | 2,387,570(0.10%)#39 |
| 6. | 33467 | 2,212 | 189,876(1.16%)#6 | 2,387,570(0.09%)#51 |
| 7. | 33009 | 2,140 | 189,876(1.13%)#7 | 2,387,570(0.09%)#57 |
| 8. | 33484 | 1,993 | 189,876(1.05%)#8 | 2,387,570(0.08%)#62 |
| 9. | 32092 | 1,890 | 189,876(1.00%)#9 | 2,387,570(0.08%)#70 |
| 10. | 33180 | 1,878 | 189,876(0.99%)#10 | 2,387,570(0.08%)#72 |
| 11. | 33434 | 1,863 | 189,876(0.98%)#11 | 2,387,570(0.08%)#74 |
| 12. | 33418 | 1,744 | 189,876(0.92%)#12 | 2,387,570(0.07%)#84 |
| 13. | 33076 | 1,598 | 189,876(0.84%)#13 | 2,387,570(0.07%)#105 |
| 14. | 33321 | 1,431 | 189,876(0.75%)#14 | 2,387,570(0.06%)#132 |
| 15. | 32566 | 1,355 | 189,876(0.71%)#15 | 2,387,570(0.06%)#148 |
| 16. | 33498 | 1,327 | 189,876(0.70%)#16 | 2,387,570(0.06%)#155 |
| 17. | 33431 | 1,266 | 189,876(0.67%)#17 | 2,387,570(0.05%)#169 |
| 18. | 33428 | 1,244 | 189,876(0.66%)#18 | 2,387,570(0.05%)#178 |
| 19. | 33324 | 1,201 | 189,876(0.63%)#19 | 2,387,570(0.05%)#195 |
| 20. | 33487 | 1,195 | 189,876(0.63%)#20 | 2,387,570(0.05%)#201 |
| 21. | 33021 | 1,121 | 189,876(0.59%)#21 | 2,387,570(0.05%)#224 |
| 22. | 33436 | 1,087 | 189,876(0.57%)#22 | 2,387,570(0.05%)#239 |
| 23. | 33458 | 1,056 | 189,876(0.56%)#23 | 2,387,570(0.04%)#253 |
| 24. | 33179 | 1,053 | 189,876(0.55%)#24 | 2,387,570(0.04%)#254 |
| 25. | 33473 | 1,046 | 189,876(0.55%)#25 | 2,387,570(0.04%)#258 |
| 26. | 33411 | 1,044 | 189,876(0.55%)#26 | 2,387,570(0.04%)#259 |
| 27. | 33414 | 1,041 | 189,876(0.55%)#27 | 2,387,570(0.04%)#261 |
| 28. | 32779 | 964 | 189,876(0.51%)#28 | 2,387,570(0.04%)#302 |
| 29. | 33442 | 952 | 189,876(0.50%)#29 | 2,387,570(0.04%)#308 |
| 30. | 33140 | 945 | 189,876(0.50%)#30 | 2,387,570(0.04%)#315 |
| 31. | 33328 | 941 | 189,876(0.50%)#31 | 2,387,570(0.04%)#317 |
| 32. | 33445 | 919 | 189,876(0.48%)#32 | 2,387,570(0.04%)#330 |
| 33. | 33472 | 902 | 189,876(0.48%)#33 | 2,387,570(0.04%)#345 |
| 34. | 33410 | 894 | 189,876(0.47%)#34 | 2,387,570(0.04%)#353 |
| 35. | 33154 | 887 | 189,876(0.47%)#35 | 2,387,570(0.04%)#362 |
| 36. | 33026 | 883 | 189,876(0.47%)#36 | 2,387,570(0.04%)#363 |
| 37. | 33326 | 882 | 189,876(0.46%)#37 | 2,387,570(0.04%)#364 |
| 38. | 33432 | 881 | 189,876(0.46%)#38 | 2,387,570(0.04%)#365 |
| 39. | 33019 | 880 | 189,876(0.46%)#39 | 2,387,570(0.04%)#366 |
| 40. | 34684 | 793 | 189,876(0.42%)#40 | 2,387,570(0.03%)#443 |
| 41. | 32164 | 786 | 189,876(0.41%)#41 | 2,387,570(0.03%)#450 |
| 42. | 32792 | 779 | 189,876(0.41%)#42 | 2,387,570(0.03%)#454 |
| 43. | 33480 | 776 | 189,876(0.41%)#43 | 2,387,570(0.03%)#457 |
| 44. | 33647 | 775 | 189,876(0.41%)#44 | 2,387,570(0.03%)#458 |
| 45. | 33066 | 763 | 189,876(0.40%)#45 | 2,387,570(0.03%)#479 |
| 46. | 34787 | 762 | 189,876(0.40%)#46 | 2,387,570(0.03%)#480 |
| 47. | 32940 | 752 | 189,876(0.40%)#47 | 2,387,570(0.03%)#493 |
| 48. | 33156 | 748 | 189,876(0.39%)#48 | 2,387,570(0.03%)#500 |
| 49. | 33322 | 747 | 189,876(0.39%)#49 | 2,387,570(0.03%)#502 |
| 50. | 34243 | 731 | 189,876(0.38%)#50 | 2,387,570(0.03%)#525 |
| 51. | 33308 | 731 | 189,876(0.38%)#51 | 2,387,570(0.03%)#526 |
| 52. | 33071 | 730 | 189,876(0.38%)#52 | 2,387,570(0.03%)#528 |
| 53. | 33139 | 720 | 189,876(0.38%)#53 | 2,387,570(0.03%)#545 |
| 54. | 34109 | 712 | 189,876(0.37%)#54 | 2,387,570(0.03%)#555 |
| 55. | 33141 | 704 | 189,876(0.37%)#55 | 2,387,570(0.03%)#565 |
| 56. | 32746 | 681 | 189,876(0.36%)#56 | 2,387,570(0.03%)#594 |
| 57. | 34711 | 656 | 189,876(0.35%)#57 | 2,387,570(0.03%)#638 |
| 58. | 34238 | 652 | 189,876(0.34%)#58 | 2,387,570(0.03%)#647 |
| 59. | 33027 | 641 | 189,876(0.34%)#59 | 2,387,570(0.03%)#666 |
| 60. | 33401 | 641 | 189,876(0.34%)#60 | 2,387,570(0.03%)#670 |
| 61. | 33919 | 640 | 189,876(0.34%)#61 | 2,387,570(0.03%)#673 |
| 62. | 34287 | 637 | 189,876(0.34%)#62 | 2,387,570(0.03%)#682 |
| 63. | 34990 | 635 | 189,876(0.33%)#63 | 2,387,570(0.03%)#687 |
| 64. | 32765 | 633 | 189,876(0.33%)#64 | 2,387,570(0.03%)#690 |
| 65. | 33020 | 633 | 189,876(0.33%)#65 | 2,387,570(0.03%)#691 |
| 66. | 32137 | 624 | 189,876(0.33%)#66 | 2,387,570(0.03%)#709 |
| 67. | 33133 | 614 | 189,876(0.32%)#67 | 2,387,570(0.03%)#736 |
| 68. | 32547 | 614 | 189,876(0.32%)#68 | 2,387,570(0.03%)#737 |
| 69. | 33301 | 613 | 189,876(0.32%)#69 | 2,387,570(0.03%)#741 |
| 70. | 34698 | 611 | 189,876(0.32%)#70 | 2,387,570(0.03%)#749 |
| 71. | 34759 | 609 | 189,876(0.32%)#71 | 2,387,570(0.03%)#756 |
| 72. | 34293 | 593 | 189,876(0.31%)#72 | 2,387,570(0.02%)#787 |
| 73. | 33908 | 587 | 189,876(0.31%)#73 | 2,387,570(0.02%)#799 |
| 74. | 32714 | 587 | 189,876(0.31%)#74 | 2,387,570(0.02%)#800 |
| 75. | 33312 | 582 | 189,876(0.31%)#75 | 2,387,570(0.02%)#819 |
| 76. | 33040 | 579 | 189,876(0.30%)#76 | 2,387,570(0.02%)#827 |
| 77. | 33417 | 574 | 189,876(0.30%)#77 | 2,387,570(0.02%)#837 |
| 78. | 33462 | 571 | 189,876(0.30%)#78 | 2,387,570(0.02%)#847 |
| 79. | 34203 | 553 | 189,876(0.29%)#79 | 2,387,570(0.02%)#884 |
| 80. | 33063 | 546 | 189,876(0.29%)#80 | 2,387,570(0.02%)#904 |
| 81. | 34202 | 544 | 189,876(0.29%)#81 | 2,387,570(0.02%)#911 |
| 82. | 33626 | 542 | 189,876(0.29%)#82 | 2,387,570(0.02%)#913 |
| 83. | 32309 | 528 | 189,876(0.28%)#83 | 2,387,570(0.02%)#953 |
| 84. | 34231 | 524 | 189,876(0.28%)#84 | 2,387,570(0.02%)#968 |
| 85. | 32162 | 521 | 189,876(0.27%)#85 | 2,387,570(0.02%)#977 |
| 86. | 33405 | 520 | 189,876(0.27%)#86 | 2,387,570(0.02%)#987 |
| 87. | 33064 | 517 | 189,876(0.27%)#87 | 2,387,570(0.02%)#997 |
| 88. | 32259 | 513 | 189,876(0.27%)#88 | 2,387,570(0.02%)#1,010 |
| 89. | 33073 | 509 | 189,876(0.27%)#89 | 2,387,570(0.02%)#1,023 |
| 90. | 32810 | 502 | 189,876(0.26%)#90 | 2,387,570(0.02%)#1,042 |
| 91. | 34232 | 501 | 189,876(0.26%)#91 | 2,387,570(0.02%)#1,045 |
| 92. | 33331 | 496 | 189,876(0.26%)#92 | 2,387,570(0.02%)#1,059 |
| 93. | 33543 | 489 | 189,876(0.26%)#93 | 2,387,570(0.02%)#1,077 |
| 94. | 33707 | 485 | 189,876(0.26%)#94 | 2,387,570(0.02%)#1,093 |
| 95. | 33062 | 485 | 189,876(0.26%)#95 | 2,387,570(0.02%)#1,094 |
| 96. | 33477 | 485 | 189,876(0.26%)#96 | 2,387,570(0.02%)#1,095 |
| 97. | 34228 | 481 | 189,876(0.25%)#97 | 2,387,570(0.02%)#1,109 |
| 98. | 33449 | 475 | 189,876(0.25%)#98 | 2,387,570(0.02%)#1,144 |
| 99. | 32708 | 469 | 189,876(0.25%)#99 | 2,387,570(0.02%)#1,167 |
| 100. | 33134 | 468 | 189,876(0.25%)#100 | 2,387,570(0.02%)#1,175 |
Common Questions
What are the Top 10 Zip Codes with the Largest Russian Community in Florida?
Top 10 Zip Codes with the Largest Russian Community in Florida are:
What zip code has the Largest Russian Community in Florida?
33160 has the Largest Russian Community in Florida with 3,242.
What is the Total Russian Population in the State of Florida?
Total Russian Population in Florida is 189,876.
What is the Total Russian Population in the United States?
Total Russian Population in the United States is 2,387,570.