Zip Codes with the Largest Hungarian Community in Florida
RELATED REPORTS & OPTIONS
Hungarian
Florida
Compare Zip Codes
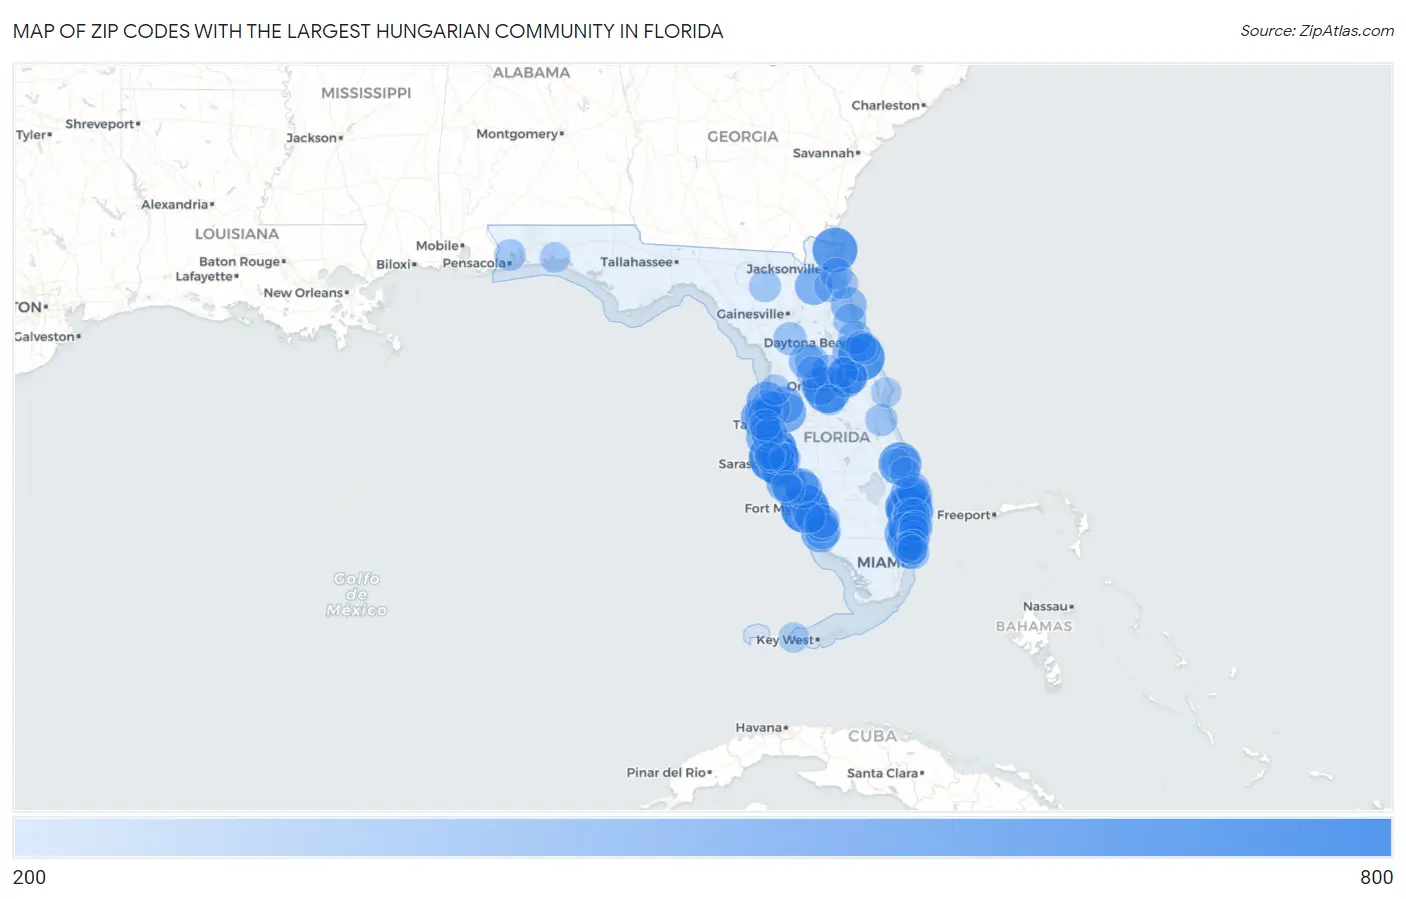
Map of Zip Codes with the Largest Hungarian Community in Florida
200
800
Zip Codes with the Largest Hungarian Community in Florida
| Zip Code | Hungarian | vs State | vs National | |
| 1. | 34207 | 735 | 93,920(0.78%)#1 | 1,294,135(0.06%)#111 |
| 2. | 33991 | 700 | 93,920(0.75%)#2 | 1,294,135(0.05%)#127 |
| 3. | 32168 | 665 | 93,920(0.71%)#3 | 1,294,135(0.05%)#148 |
| 4. | 33467 | 648 | 93,920(0.69%)#4 | 1,294,135(0.05%)#159 |
| 5. | 34787 | 640 | 93,920(0.68%)#5 | 1,294,135(0.05%)#166 |
| 6. | 32034 | 615 | 93,920(0.65%)#6 | 1,294,135(0.05%)#181 |
| 7. | 34221 | 574 | 93,920(0.61%)#7 | 1,294,135(0.04%)#203 |
| 8. | 34983 | 562 | 93,920(0.60%)#8 | 1,294,135(0.04%)#209 |
| 9. | 33433 | 548 | 93,920(0.58%)#9 | 1,294,135(0.04%)#224 |
| 10. | 33414 | 546 | 93,920(0.58%)#10 | 1,294,135(0.04%)#228 |
| 11. | 34698 | 507 | 93,920(0.54%)#11 | 1,294,135(0.04%)#269 |
| 12. | 33071 | 505 | 93,920(0.54%)#12 | 1,294,135(0.04%)#274 |
| 13. | 34293 | 488 | 93,920(0.52%)#13 | 1,294,135(0.04%)#285 |
| 14. | 33647 | 480 | 93,920(0.51%)#14 | 1,294,135(0.04%)#298 |
| 15. | 34668 | 469 | 93,920(0.50%)#15 | 1,294,135(0.04%)#320 |
| 16. | 32708 | 467 | 93,920(0.50%)#16 | 1,294,135(0.04%)#324 |
| 17. | 33417 | 456 | 93,920(0.49%)#17 | 1,294,135(0.04%)#340 |
| 18. | 33428 | 445 | 93,920(0.47%)#18 | 1,294,135(0.03%)#356 |
| 19. | 33707 | 432 | 93,920(0.46%)#19 | 1,294,135(0.03%)#377 |
| 20. | 32068 | 430 | 93,920(0.46%)#20 | 1,294,135(0.03%)#382 |
| 21. | 33919 | 430 | 93,920(0.46%)#21 | 1,294,135(0.03%)#385 |
| 22. | 34711 | 427 | 93,920(0.45%)#22 | 1,294,135(0.03%)#388 |
| 23. | 34109 | 427 | 93,920(0.45%)#23 | 1,294,135(0.03%)#389 |
| 24. | 33437 | 426 | 93,920(0.45%)#24 | 1,294,135(0.03%)#390 |
| 25. | 33544 | 416 | 93,920(0.44%)#25 | 1,294,135(0.03%)#406 |
| 26. | 33950 | 415 | 93,920(0.44%)#26 | 1,294,135(0.03%)#408 |
| 27. | 34243 | 414 | 93,920(0.44%)#27 | 1,294,135(0.03%)#411 |
| 28. | 33418 | 399 | 93,920(0.42%)#28 | 1,294,135(0.03%)#444 |
| 29. | 33324 | 398 | 93,920(0.42%)#29 | 1,294,135(0.03%)#447 |
| 30. | 34119 | 394 | 93,920(0.42%)#30 | 1,294,135(0.03%)#457 |
| 31. | 33484 | 387 | 93,920(0.41%)#31 | 1,294,135(0.03%)#470 |
| 32. | 33952 | 385 | 93,920(0.41%)#32 | 1,294,135(0.03%)#473 |
| 33. | 32080 | 384 | 93,920(0.41%)#33 | 1,294,135(0.03%)#476 |
| 34. | 34238 | 380 | 93,920(0.40%)#34 | 1,294,135(0.03%)#486 |
| 35. | 33446 | 379 | 93,920(0.40%)#35 | 1,294,135(0.03%)#490 |
| 36. | 34683 | 377 | 93,920(0.40%)#36 | 1,294,135(0.03%)#496 |
| 37. | 33556 | 376 | 93,920(0.40%)#37 | 1,294,135(0.03%)#499 |
| 38. | 33434 | 374 | 93,920(0.40%)#38 | 1,294,135(0.03%)#505 |
| 39. | 32724 | 367 | 93,920(0.39%)#39 | 1,294,135(0.03%)#528 |
| 40. | 34231 | 360 | 93,920(0.38%)#40 | 1,294,135(0.03%)#548 |
| 41. | 32162 | 355 | 93,920(0.38%)#41 | 1,294,135(0.03%)#560 |
| 42. | 34135 | 340 | 93,920(0.36%)#42 | 1,294,135(0.03%)#612 |
| 43. | 33928 | 340 | 93,920(0.36%)#43 | 1,294,135(0.03%)#614 |
| 44. | 33321 | 335 | 93,920(0.36%)#44 | 1,294,135(0.03%)#633 |
| 45. | 33160 | 335 | 93,920(0.36%)#45 | 1,294,135(0.03%)#634 |
| 46. | 33410 | 335 | 93,920(0.36%)#46 | 1,294,135(0.03%)#635 |
| 47. | 34684 | 335 | 93,920(0.36%)#47 | 1,294,135(0.03%)#636 |
| 48. | 34203 | 331 | 93,920(0.35%)#48 | 1,294,135(0.03%)#652 |
| 49. | 33472 | 331 | 93,920(0.35%)#49 | 1,294,135(0.03%)#653 |
| 50. | 32174 | 329 | 93,920(0.35%)#50 | 1,294,135(0.03%)#656 |
| 51. | 33458 | 328 | 93,920(0.35%)#51 | 1,294,135(0.03%)#660 |
| 52. | 32792 | 327 | 93,920(0.35%)#52 | 1,294,135(0.03%)#668 |
| 53. | 33020 | 327 | 93,920(0.35%)#53 | 1,294,135(0.03%)#669 |
| 54. | 32159 | 325 | 93,920(0.35%)#54 | 1,294,135(0.03%)#679 |
| 55. | 33436 | 321 | 93,920(0.34%)#55 | 1,294,135(0.02%)#693 |
| 56. | 34482 | 319 | 93,920(0.34%)#56 | 1,294,135(0.02%)#707 |
| 57. | 34205 | 318 | 93,920(0.34%)#57 | 1,294,135(0.02%)#713 |
| 58. | 32757 | 314 | 93,920(0.33%)#58 | 1,294,135(0.02%)#733 |
| 59. | 34748 | 308 | 93,920(0.33%)#59 | 1,294,135(0.02%)#754 |
| 60. | 33076 | 308 | 93,920(0.33%)#60 | 1,294,135(0.02%)#755 |
| 61. | 33162 | 307 | 93,920(0.33%)#61 | 1,294,135(0.02%)#758 |
| 62. | 33782 | 303 | 93,920(0.32%)#62 | 1,294,135(0.02%)#778 |
| 63. | 32137 | 300 | 93,920(0.32%)#63 | 1,294,135(0.02%)#790 |
| 64. | 33442 | 300 | 93,920(0.32%)#64 | 1,294,135(0.02%)#791 |
| 65. | 32765 | 299 | 93,920(0.32%)#65 | 1,294,135(0.02%)#794 |
| 66. | 33308 | 295 | 93,920(0.31%)#66 | 1,294,135(0.02%)#808 |
| 67. | 32259 | 292 | 93,920(0.31%)#67 | 1,294,135(0.02%)#818 |
| 68. | 32907 | 292 | 93,920(0.31%)#68 | 1,294,135(0.02%)#819 |
| 69. | 32224 | 290 | 93,920(0.31%)#69 | 1,294,135(0.02%)#830 |
| 70. | 32024 | 288 | 93,920(0.31%)#70 | 1,294,135(0.02%)#845 |
| 71. | 34209 | 287 | 93,920(0.31%)#71 | 1,294,135(0.02%)#850 |
| 72. | 33713 | 286 | 93,920(0.30%)#72 | 1,294,135(0.02%)#853 |
| 73. | 32127 | 283 | 93,920(0.30%)#73 | 1,294,135(0.02%)#867 |
| 74. | 32514 | 279 | 93,920(0.30%)#74 | 1,294,135(0.02%)#887 |
| 75. | 33703 | 277 | 93,920(0.29%)#75 | 1,294,135(0.02%)#903 |
| 76. | 33304 | 276 | 93,920(0.29%)#76 | 1,294,135(0.02%)#908 |
| 77. | 34202 | 275 | 93,920(0.29%)#77 | 1,294,135(0.02%)#911 |
| 78. | 34224 | 274 | 93,920(0.29%)#78 | 1,294,135(0.02%)#920 |
| 79. | 34653 | 273 | 93,920(0.29%)#79 | 1,294,135(0.02%)#922 |
| 80. | 32119 | 273 | 93,920(0.29%)#80 | 1,294,135(0.02%)#925 |
| 81. | 32082 | 271 | 93,920(0.29%)#81 | 1,294,135(0.02%)#931 |
| 82. | 33764 | 269 | 93,920(0.29%)#82 | 1,294,135(0.02%)#951 |
| 83. | 33908 | 268 | 93,920(0.29%)#83 | 1,294,135(0.02%)#957 |
| 84. | 33024 | 267 | 93,920(0.28%)#84 | 1,294,135(0.02%)#962 |
| 85. | 34982 | 266 | 93,920(0.28%)#85 | 1,294,135(0.02%)#975 |
| 86. | 33064 | 265 | 93,920(0.28%)#86 | 1,294,135(0.02%)#980 |
| 87. | 34608 | 265 | 93,920(0.28%)#87 | 1,294,135(0.02%)#982 |
| 88. | 33432 | 265 | 93,920(0.28%)#88 | 1,294,135(0.02%)#983 |
| 89. | 34986 | 263 | 93,920(0.28%)#89 | 1,294,135(0.02%)#994 |
| 90. | 34747 | 260 | 93,920(0.28%)#90 | 1,294,135(0.02%)#1,017 |
| 91. | 34994 | 256 | 93,920(0.27%)#91 | 1,294,135(0.02%)#1,038 |
| 92. | 33004 | 256 | 93,920(0.27%)#92 | 1,294,135(0.02%)#1,039 |
| 93. | 32578 | 252 | 93,920(0.27%)#93 | 1,294,135(0.02%)#1,063 |
| 94. | 33021 | 251 | 93,920(0.27%)#94 | 1,294,135(0.02%)#1,068 |
| 95. | 32746 | 251 | 93,920(0.27%)#95 | 1,294,135(0.02%)#1,070 |
| 96. | 33040 | 250 | 93,920(0.27%)#96 | 1,294,135(0.02%)#1,085 |
| 97. | 32920 | 249 | 93,920(0.27%)#97 | 1,294,135(0.02%)#1,100 |
| 98. | 34223 | 248 | 93,920(0.26%)#98 | 1,294,135(0.02%)#1,109 |
| 99. | 33009 | 246 | 93,920(0.26%)#99 | 1,294,135(0.02%)#1,127 |
| 100. | 34210 | 246 | 93,920(0.26%)#100 | 1,294,135(0.02%)#1,130 |
Common Questions
What are the Top 10 Zip Codes with the Largest Hungarian Community in Florida?
Top 10 Zip Codes with the Largest Hungarian Community in Florida are:
What zip code has the Largest Hungarian Community in Florida?
34207 has the Largest Hungarian Community in Florida with 735.
What is the Total Hungarian Population in the State of Florida?
Total Hungarian Population in Florida is 93,920.
What is the Total Hungarian Population in the United States?
Total Hungarian Population in the United States is 1,294,135.