Zip Codes with the Highest Percentage of Population Employed in Health Care & Social Assistance in Florida
RELATED REPORTS & OPTIONS
Health Care & Social Assistance
Florida
Compare Zip Codes
Map of Zip Codes with the Highest Percentage of Population Employed in Health Care & Social Assistance in Florida
0.0%
100.0%
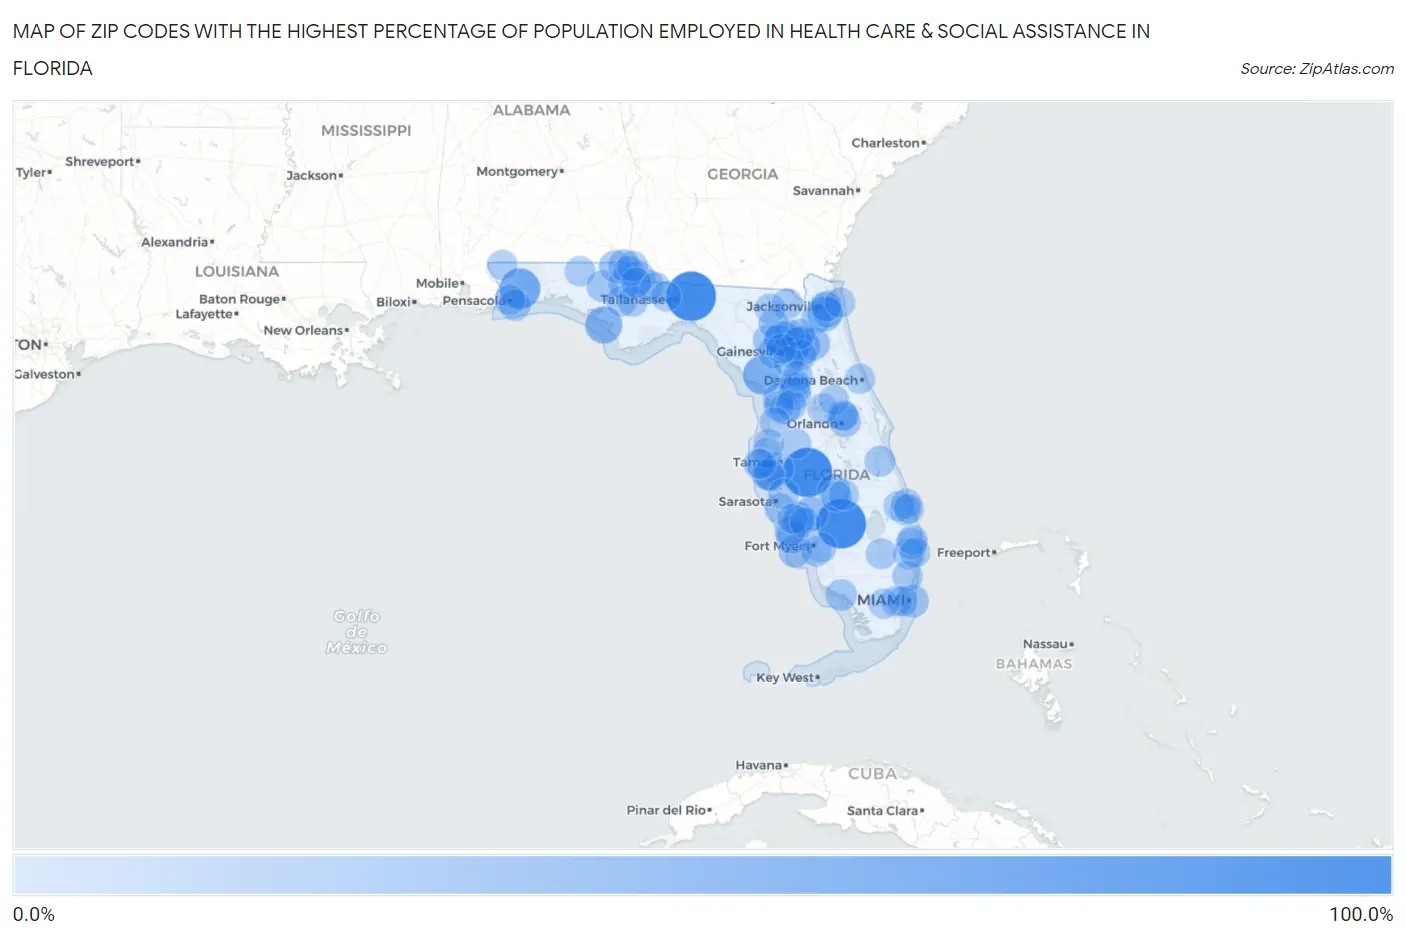
Zip Codes with the Highest Percentage of Population Employed in Health Care & Social Assistance in Florida
| Zip Code | % Employed | vs State | vs National | |
| 1. | 33944 | 100.0% | 13.4% (+86.6)#1 | 13.9% (+86.1)#10 |
| 2. | 32337 | 100.0% | 13.4% (+86.6)#2 | 13.9% (+86.1)#23 |
| 3. | 33835 | 100.0% | 13.4% (+86.6)#3 | 13.9% (+86.1)#36 |
| 4. | 32530 | 61.9% | 13.4% (+48.5)#4 | 13.9% (+48.0)#123 |
| 5. | 32683 | 54.7% | 13.4% (+41.2)#5 | 13.9% (+40.7)#174 |
| 6. | 32631 | 49.7% | 13.4% (+36.2)#6 | 13.9% (+35.7)#232 |
| 7. | 32403 | 46.7% | 13.4% (+33.3)#7 | 13.9% (+32.8)#276 |
| 8. | 32212 | 38.6% | 13.4% (+25.2)#8 | 13.9% (+24.7)#434 |
| 9. | 32658 | 35.9% | 13.4% (+22.5)#9 | 13.9% (+22.0)#547 |
| 10. | 34268 | 35.7% | 13.4% (+22.3)#10 | 13.9% (+21.8)#557 |
| 11. | 33621 | 28.8% | 13.4% (+15.4)#11 | 13.9% (+14.9)#1,080 |
| 12. | 33924 | 28.6% | 13.4% (+15.1)#12 | 13.9% (+14.6)#1,106 |
| 13. | 33109 | 28.1% | 13.4% (+14.6)#13 | 13.9% (+14.1)#1,175 |
| 14. | 33921 | 27.8% | 13.4% (+14.4)#14 | 13.9% (+13.9)#1,203 |
| 15. | 32140 | 27.3% | 13.4% (+13.9)#15 | 13.9% (+13.4)#1,284 |
| 16. | 32460 | 26.9% | 13.4% (+13.4)#16 | 13.9% (+12.9)#1,370 |
| 17. | 33872 | 26.7% | 13.4% (+13.3)#17 | 13.9% (+12.8)#1,385 |
| 18. | 34473 | 25.4% | 13.4% (+12.0)#18 | 13.9% (+11.5)#1,632 |
| 19. | 32669 | 25.4% | 13.4% (+11.9)#19 | 13.9% (+11.4)#1,651 |
| 20. | 32814 | 25.3% | 13.4% (+11.8)#20 | 13.9% (+11.3)#1,666 |
| 21. | 32463 | 25.0% | 13.4% (+11.6)#21 | 13.9% (+11.1)#1,728 |
| 22. | 32643 | 24.2% | 13.4% (+10.8)#22 | 13.9% (+10.3)#1,944 |
| 23. | 32426 | 24.2% | 13.4% (+10.7)#23 | 13.9% (+10.2)#1,957 |
| 24. | 32561 | 23.8% | 13.4% (+10.4)#24 | 13.9% (+9.86)#2,050 |
| 25. | 34139 | 23.7% | 13.4% (+10.2)#25 | 13.9% (+9.75)#2,081 |
| 26. | 33712 | 23.7% | 13.4% (+10.2)#26 | 13.9% (+9.72)#2,089 |
| 27. | 32324 | 23.5% | 13.4% (+10.0)#27 | 13.9% (+9.53)#2,160 |
| 28. | 34289 | 23.3% | 13.4% (+9.90)#28 | 13.9% (+9.40)#2,203 |
| 29. | 32448 | 23.1% | 13.4% (+9.67)#29 | 13.9% (+9.17)#2,311 |
| 30. | 32445 | 22.7% | 13.4% (+9.28)#30 | 13.9% (+8.78)#2,462 |
| 31. | 32641 | 22.7% | 13.4% (+9.23)#31 | 13.9% (+8.73)#2,486 |
| 32. | 34476 | 22.6% | 13.4% (+9.17)#32 | 13.9% (+8.67)#2,515 |
| 33. | 33473 | 22.5% | 13.4% (+9.08)#33 | 13.9% (+8.58)#2,558 |
| 34. | 33413 | 22.3% | 13.4% (+8.91)#34 | 13.9% (+8.41)#2,628 |
| 35. | 34465 | 22.1% | 13.4% (+8.64)#35 | 13.9% (+8.15)#2,759 |
| 36. | 32332 | 21.9% | 13.4% (+8.51)#36 | 13.9% (+8.01)#2,828 |
| 37. | 32087 | 21.8% | 13.4% (+8.32)#37 | 13.9% (+7.82)#2,922 |
| 38. | 32443 | 21.6% | 13.4% (+8.17)#38 | 13.9% (+7.67)#3,007 |
| 39. | 34452 | 21.4% | 13.4% (+7.95)#39 | 13.9% (+7.45)#3,120 |
| 40. | 32694 | 21.3% | 13.4% (+7.89)#40 | 13.9% (+7.39)#3,153 |
| 41. | 32423 | 21.3% | 13.4% (+7.83)#41 | 13.9% (+7.33)#3,190 |
| 42. | 33875 | 21.3% | 13.4% (+7.82)#42 | 13.9% (+7.32)#3,198 |
| 43. | 32908 | 21.0% | 13.4% (+7.60)#43 | 13.9% (+7.11)#3,348 |
| 44. | 33954 | 20.9% | 13.4% (+7.44)#44 | 13.9% (+6.94)#3,451 |
| 45. | 34238 | 20.8% | 13.4% (+7.41)#45 | 13.9% (+6.91)#3,465 |
| 46. | 32622 | 20.8% | 13.4% (+7.41)#46 | 13.9% (+6.91)#3,470 |
| 47. | 33711 | 20.8% | 13.4% (+7.34)#47 | 13.9% (+6.84)#3,527 |
| 48. | 33493 | 20.6% | 13.4% (+7.17)#48 | 13.9% (+6.67)#3,645 |
| 49. | 33946 | 20.5% | 13.4% (+7.04)#49 | 13.9% (+6.55)#3,739 |
| 50. | 34461 | 20.3% | 13.4% (+6.87)#50 | 13.9% (+6.37)#3,854 |
| 51. | 32615 | 20.2% | 13.4% (+6.77)#51 | 13.9% (+6.27)#3,930 |
| 52. | 34474 | 20.1% | 13.4% (+6.67)#52 | 13.9% (+6.17)#3,996 |
| 53. | 33705 | 20.1% | 13.4% (+6.63)#53 | 13.9% (+6.14)#4,037 |
| 54. | 32430 | 20.1% | 13.4% (+6.61)#54 | 13.9% (+6.12)#4,047 |
| 55. | 32204 | 20.0% | 13.4% (+6.55)#55 | 13.9% (+6.05)#4,113 |
| 56. | 32501 | 19.9% | 13.4% (+6.51)#56 | 13.9% (+6.01)#4,132 |
| 57. | 32640 | 19.9% | 13.4% (+6.50)#57 | 13.9% (+6.00)#4,139 |
| 58. | 34211 | 19.9% | 13.4% (+6.42)#58 | 13.9% (+5.92)#4,191 |
| 59. | 33912 | 19.8% | 13.4% (+6.39)#59 | 13.9% (+5.89)#4,211 |
| 60. | 32667 | 19.8% | 13.4% (+6.34)#60 | 13.9% (+5.85)#4,237 |
| 61. | 32424 | 19.7% | 13.4% (+6.27)#61 | 13.9% (+5.77)#4,300 |
| 62. | 33313 | 19.5% | 13.4% (+6.05)#62 | 13.9% (+5.55)#4,514 |
| 63. | 34287 | 19.5% | 13.4% (+6.02)#63 | 13.9% (+5.52)#4,551 |
| 64. | 34450 | 19.4% | 13.4% (+5.94)#64 | 13.9% (+5.44)#4,631 |
| 65. | 33184 | 19.3% | 13.4% (+5.91)#65 | 13.9% (+5.41)#4,665 |
| 66. | 32442 | 19.3% | 13.4% (+5.90)#66 | 13.9% (+5.41)#4,668 |
| 67. | 32055 | 19.3% | 13.4% (+5.87)#67 | 13.9% (+5.37)#4,691 |
| 68. | 34685 | 19.2% | 13.4% (+5.79)#68 | 13.9% (+5.29)#4,774 |
| 69. | 32065 | 19.2% | 13.4% (+5.76)#69 | 13.9% (+5.26)#4,795 |
| 70. | 32343 | 19.1% | 13.4% (+5.71)#70 | 13.9% (+5.21)#4,844 |
| 71. | 32091 | 19.1% | 13.4% (+5.67)#71 | 13.9% (+5.17)#4,883 |
| 72. | 33983 | 19.1% | 13.4% (+5.65)#72 | 13.9% (+5.15)#4,901 |
| 73. | 34475 | 19.1% | 13.4% (+5.64)#73 | 13.9% (+5.14)#4,906 |
| 74. | 32701 | 19.0% | 13.4% (+5.61)#74 | 13.9% (+5.11)#4,951 |
| 75. | 32778 | 19.0% | 13.4% (+5.61)#75 | 13.9% (+5.11)#4,952 |
| 76. | 33144 | 19.0% | 13.4% (+5.54)#76 | 13.9% (+5.04)#5,017 |
| 77. | 32464 | 18.9% | 13.4% (+5.49)#77 | 13.9% (+4.99)#5,062 |
| 78. | 34613 | 18.9% | 13.4% (+5.49)#78 | 13.9% (+4.99)#5,065 |
| 79. | 34994 | 18.9% | 13.4% (+5.43)#79 | 13.9% (+4.93)#5,126 |
| 80. | 34655 | 18.9% | 13.4% (+5.42)#80 | 13.9% (+4.92)#5,127 |
| 81. | 33417 | 18.8% | 13.4% (+5.39)#81 | 13.9% (+4.89)#5,174 |
| 82. | 32736 | 18.8% | 13.4% (+5.38)#82 | 13.9% (+4.88)#5,190 |
| 83. | 32025 | 18.8% | 13.4% (+5.35)#83 | 13.9% (+4.85)#5,218 |
| 84. | 32217 | 18.8% | 13.4% (+5.35)#84 | 13.9% (+4.85)#5,219 |
| 85. | 33542 | 18.8% | 13.4% (+5.33)#85 | 13.9% (+4.84)#5,229 |
| 86. | 33786 | 18.8% | 13.4% (+5.33)#86 | 13.9% (+4.83)#5,235 |
| 87. | 32202 | 18.7% | 13.4% (+5.29)#87 | 13.9% (+4.79)#5,279 |
| 88. | 33973 | 18.7% | 13.4% (+5.27)#88 | 13.9% (+4.77)#5,298 |
| 89. | 33770 | 18.7% | 13.4% (+5.27)#89 | 13.9% (+4.77)#5,300 |
| 90. | 33876 | 18.7% | 13.4% (+5.27)#90 | 13.9% (+4.77)#5,307 |
| 91. | 34953 | 18.7% | 13.4% (+5.26)#91 | 13.9% (+4.76)#5,320 |
| 92. | 32227 | 18.7% | 13.4% (+5.25)#92 | 13.9% (+4.76)#5,322 |
| 93. | 34957 | 18.6% | 13.4% (+5.19)#93 | 13.9% (+4.69)#5,395 |
| 94. | 33426 | 18.6% | 13.4% (+5.18)#94 | 13.9% (+4.68)#5,398 |
| 95. | 32117 | 18.4% | 13.4% (+5.01)#95 | 13.9% (+4.51)#5,616 |
| 96. | 33194 | 18.4% | 13.4% (+5.01)#96 | 13.9% (+4.51)#5,624 |
| 97. | 32535 | 18.4% | 13.4% (+4.94)#97 | 13.9% (+4.45)#5,704 |
| 98. | 32606 | 18.4% | 13.4% (+4.94)#98 | 13.9% (+4.44)#5,709 |
| 99. | 32730 | 18.3% | 13.4% (+4.85)#99 | 13.9% (+4.35)#5,830 |
| 100. | 34996 | 18.3% | 13.4% (+4.84)#100 | 13.9% (+4.34)#5,843 |
Common Questions
What are the Top 10 Zip Codes with the Highest Percentage of Population Employed in Health Care & Social Assistance in Florida?
Top 10 Zip Codes with the Highest Percentage of Population Employed in Health Care & Social Assistance in Florida are:
What zip code has the Highest Percentage of Population Employed in Health Care & Social Assistance in Florida?
33944 has the Highest Percentage of Population Employed in Health Care & Social Assistance in Florida with 100.0%.
What is the Percentage of Population Employed in Health Care & Social Assistance in the State of Florida?
Percentage of Population Employed in Health Care & Social Assistance in Florida is 13.4%.
What is the Percentage of Population Employed in Health Care & Social Assistance in the United States?
Percentage of Population Employed in Health Care & Social Assistance in the United States is 13.9%.