Zip Codes with the Highest Percentage of Population with a Degree in Arts and Humanities in Florida
RELATED REPORTS & OPTIONS
Arts and Humanities
Florida
Compare Zip Codes
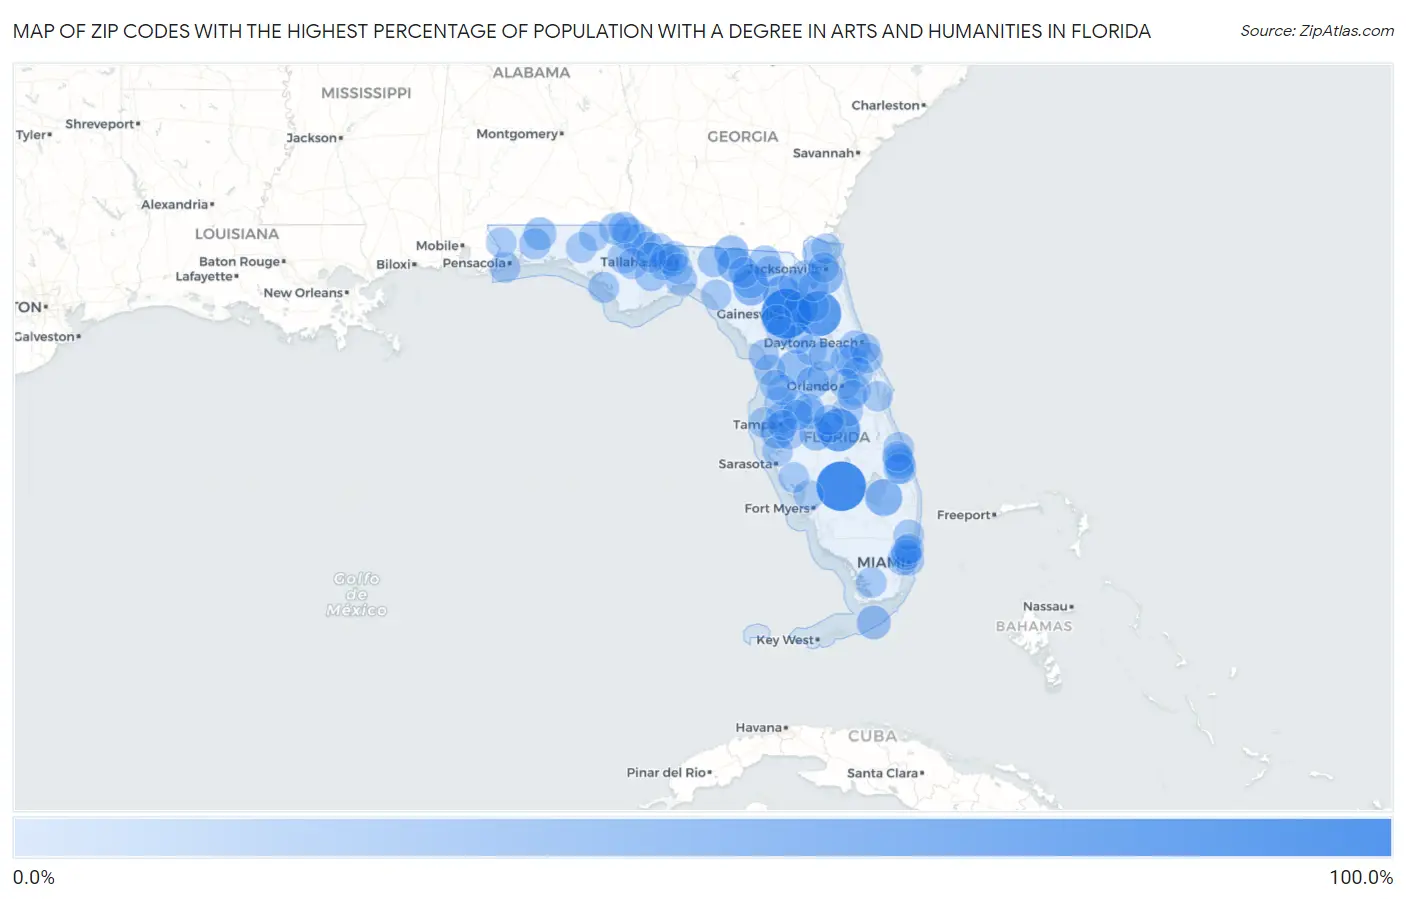
Map of Zip Codes with the Highest Percentage of Population with a Degree in Arts and Humanities in Florida
0.0%
100.0%
Zip Codes with the Highest Percentage of Population with a Degree in Arts and Humanities in Florida
| Zip Code | % Graduates | vs State | vs National | |
| 1. | 32612 | 100.0% | 6.0%(+94.0)#1 | 6.0%(+94.0)#1 |
| 2. | 33944 | 100.0% | 6.0%(+94.0)#2 | 6.0%(+94.0)#43 |
| 3. | 32147 | 78.5% | 6.0%(+72.5)#3 | 6.0%(+72.5)#103 |
| 4. | 33856 | 67.9% | 6.0%(+61.8)#4 | 6.0%(+61.9)#126 |
| 5. | 32697 | 46.7% | 6.0%(+40.6)#5 | 6.0%(+40.7)#256 |
| 6. | 33476 | 41.2% | 6.0%(+35.2)#6 | 6.0%(+35.2)#327 |
| 7. | 32071 | 36.3% | 6.0%(+30.3)#7 | 6.0%(+30.3)#441 |
| 8. | 32212 | 35.9% | 6.0%(+29.9)#8 | 6.0%(+29.9)#448 |
| 9. | 32059 | 32.5% | 6.0%(+26.5)#9 | 6.0%(+26.6)#557 |
| 10. | 32631 | 30.9% | 6.0%(+24.9)#10 | 6.0%(+24.9)#624 |
| 11. | 33538 | 30.7% | 6.0%(+24.7)#11 | 6.0%(+24.7)#635 |
| 12. | 33621 | 29.8% | 6.0%(+23.8)#12 | 6.0%(+23.8)#669 |
| 13. | 32062 | 28.2% | 6.0%(+22.2)#13 | 6.0%(+22.2)#746 |
| 14. | 32350 | 27.0% | 6.0%(+21.0)#14 | 6.0%(+21.0)#824 |
| 15. | 33001 | 26.3% | 6.0%(+20.2)#15 | 6.0%(+20.3)#874 |
| 16. | 33847 | 25.0% | 6.0%(+19.0)#16 | 6.0%(+19.0)#964 |
| 17. | 32443 | 22.9% | 6.0%(+16.9)#17 | 6.0%(+16.9)#1,121 |
| 18. | 32531 | 21.8% | 6.0%(+15.8)#18 | 6.0%(+15.8)#1,255 |
| 19. | 32460 | 20.4% | 6.0%(+14.4)#19 | 6.0%(+14.4)#1,419 |
| 20. | 34753 | 20.1% | 6.0%(+14.1)#20 | 6.0%(+14.1)#1,465 |
| 21. | 32334 | 19.7% | 6.0%(+13.7)#21 | 6.0%(+13.7)#1,543 |
| 22. | 32738 | 18.6% | 6.0%(+12.5)#22 | 6.0%(+12.6)#1,713 |
| 23. | 32421 | 17.8% | 6.0%(+11.8)#23 | 6.0%(+11.8)#1,880 |
| 24. | 32324 | 17.5% | 6.0%(+11.5)#24 | 6.0%(+11.5)#1,959 |
| 25. | 32331 | 16.8% | 6.0%(+10.8)#25 | 6.0%(+10.8)#2,119 |
| 26. | 32426 | 16.7% | 6.0%(+10.6)#26 | 6.0%(+10.7)#2,158 |
| 27. | 32355 | 16.7% | 6.0%(+10.6)#27 | 6.0%(+10.7)#2,169 |
| 28. | 32234 | 16.3% | 6.0%(+10.3)#28 | 6.0%(+10.3)#2,254 |
| 29. | 32096 | 16.2% | 6.0%(+10.1)#29 | 6.0%(+10.2)#2,296 |
| 30. | 32564 | 16.0% | 6.0%(+9.97)#30 | 6.0%(+10.0)#2,340 |
| 31. | 32124 | 15.3% | 6.0%(+9.29)#31 | 6.0%(+9.32)#2,557 |
| 32. | 32831 | 15.3% | 6.0%(+9.22)#32 | 6.0%(+9.26)#2,573 |
| 33. | 33542 | 14.9% | 6.0%(+8.85)#33 | 6.0%(+8.88)#2,728 |
| 34. | 34981 | 14.8% | 6.0%(+8.80)#34 | 6.0%(+8.83)#2,742 |
| 35. | 32445 | 14.4% | 6.0%(+8.38)#35 | 6.0%(+8.42)#2,922 |
| 36. | 33127 | 14.1% | 6.0%(+8.03)#36 | 6.0%(+8.07)#3,102 |
| 37. | 32763 | 14.0% | 6.0%(+7.96)#37 | 6.0%(+7.99)#3,135 |
| 38. | 34637 | 13.9% | 6.0%(+7.84)#38 | 6.0%(+7.88)#3,187 |
| 39. | 32140 | 13.8% | 6.0%(+7.82)#39 | 6.0%(+7.85)#3,197 |
| 40. | 32403 | 13.6% | 6.0%(+7.61)#40 | 6.0%(+7.64)#3,299 |
| 41. | 33122 | 13.2% | 6.0%(+7.19)#41 | 6.0%(+7.23)#3,508 |
| 42. | 32352 | 13.2% | 6.0%(+7.17)#42 | 6.0%(+7.20)#3,518 |
| 43. | 34448 | 13.0% | 6.0%(+7.00)#43 | 6.0%(+7.04)#3,625 |
| 44. | 34772 | 12.9% | 6.0%(+6.92)#44 | 6.0%(+6.95)#3,677 |
| 45. | 33612 | 12.9% | 6.0%(+6.85)#45 | 6.0%(+6.89)#3,719 |
| 46. | 32424 | 12.9% | 6.0%(+6.85)#46 | 6.0%(+6.89)#3,722 |
| 47. | 33056 | 12.9% | 6.0%(+6.84)#47 | 6.0%(+6.87)#3,729 |
| 48. | 32343 | 12.7% | 6.0%(+6.70)#48 | 6.0%(+6.73)#3,812 |
| 49. | 33068 | 12.7% | 6.0%(+6.69)#49 | 6.0%(+6.72)#3,825 |
| 50. | 32508 | 12.6% | 6.0%(+6.53)#50 | 6.0%(+6.57)#3,911 |
| 51. | 34984 | 12.5% | 6.0%(+6.45)#51 | 6.0%(+6.49)#4,000 |
| 52. | 32179 | 12.4% | 6.0%(+6.36)#52 | 6.0%(+6.39)#4,052 |
| 53. | 32348 | 12.4% | 6.0%(+6.34)#53 | 6.0%(+6.38)#4,068 |
| 54. | 32064 | 12.3% | 6.0%(+6.30)#54 | 6.0%(+6.33)#4,097 |
| 55. | 32455 | 12.3% | 6.0%(+6.24)#55 | 6.0%(+6.27)#4,134 |
| 56. | 34983 | 12.1% | 6.0%(+6.07)#56 | 6.0%(+6.11)#4,243 |
| 57. | 33579 | 12.1% | 6.0%(+6.07)#57 | 6.0%(+6.10)#4,248 |
| 58. | 32962 | 12.1% | 6.0%(+6.04)#58 | 6.0%(+6.07)#4,267 |
| 59. | 32055 | 12.0% | 6.0%(+6.02)#59 | 6.0%(+6.05)#4,281 |
| 60. | 32083 | 12.0% | 6.0%(+5.97)#60 | 6.0%(+6.00)#4,309 |
| 61. | 34498 | 11.8% | 6.0%(+5.77)#61 | 6.0%(+5.81)#4,450 |
| 62. | 33805 | 11.8% | 6.0%(+5.77)#62 | 6.0%(+5.80)#4,452 |
| 63. | 32310 | 11.8% | 6.0%(+5.72)#63 | 6.0%(+5.76)#4,503 |
| 64. | 33034 | 11.6% | 6.0%(+5.62)#64 | 6.0%(+5.65)#4,577 |
| 65. | 32132 | 11.5% | 6.0%(+5.50)#65 | 6.0%(+5.54)#4,663 |
| 66. | 33167 | 11.5% | 6.0%(+5.46)#66 | 6.0%(+5.50)#4,698 |
| 67. | 32127 | 11.5% | 6.0%(+5.43)#67 | 6.0%(+5.47)#4,716 |
| 68. | 34222 | 11.5% | 6.0%(+5.43)#68 | 6.0%(+5.46)#4,726 |
| 69. | 34291 | 11.4% | 6.0%(+5.38)#69 | 6.0%(+5.42)#4,761 |
| 70. | 32304 | 11.4% | 6.0%(+5.36)#70 | 6.0%(+5.39)#4,788 |
| 71. | 33853 | 11.2% | 6.0%(+5.22)#71 | 6.0%(+5.25)#4,919 |
| 72. | 34953 | 11.2% | 6.0%(+5.20)#72 | 6.0%(+5.24)#4,930 |
| 73. | 32577 | 11.1% | 6.0%(+5.10)#73 | 6.0%(+5.14)#4,995 |
| 74. | 34604 | 11.1% | 6.0%(+5.08)#74 | 6.0%(+5.12)#5,009 |
| 75. | 32732 | 11.1% | 6.0%(+5.08)#75 | 6.0%(+5.12)#5,013 |
| 76. | 33809 | 11.1% | 6.0%(+5.07)#76 | 6.0%(+5.11)#5,070 |
| 77. | 34613 | 11.1% | 6.0%(+5.02)#77 | 6.0%(+5.06)#5,099 |
| 78. | 34475 | 11.0% | 6.0%(+4.97)#78 | 6.0%(+5.01)#5,137 |
| 79. | 32303 | 11.0% | 6.0%(+4.97)#79 | 6.0%(+5.00)#5,142 |
| 80. | 34705 | 11.0% | 6.0%(+4.94)#80 | 6.0%(+4.97)#5,161 |
| 81. | 33765 | 10.9% | 6.0%(+4.90)#81 | 6.0%(+4.93)#5,201 |
| 82. | 32011 | 10.9% | 6.0%(+4.89)#82 | 6.0%(+4.92)#5,211 |
| 83. | 34947 | 10.9% | 6.0%(+4.88)#83 | 6.0%(+4.92)#5,214 |
| 84. | 32814 | 10.8% | 6.0%(+4.81)#84 | 6.0%(+4.85)#5,277 |
| 85. | 32097 | 10.8% | 6.0%(+4.78)#85 | 6.0%(+4.81)#5,313 |
| 86. | 32784 | 10.8% | 6.0%(+4.77)#86 | 6.0%(+4.80)#5,317 |
| 87. | 33565 | 10.8% | 6.0%(+4.75)#87 | 6.0%(+4.78)#5,330 |
| 88. | 32305 | 10.7% | 6.0%(+4.70)#88 | 6.0%(+4.74)#5,385 |
| 89. | 33023 | 10.7% | 6.0%(+4.70)#89 | 6.0%(+4.73)#5,386 |
| 90. | 32922 | 10.7% | 6.0%(+4.69)#90 | 6.0%(+4.73)#5,393 |
| 91. | 33605 | 10.7% | 6.0%(+4.64)#91 | 6.0%(+4.67)#5,463 |
| 92. | 32832 | 10.6% | 6.0%(+4.57)#92 | 6.0%(+4.61)#5,537 |
| 93. | 33955 | 10.6% | 6.0%(+4.57)#93 | 6.0%(+4.60)#5,540 |
| 94. | 32351 | 10.6% | 6.0%(+4.53)#94 | 6.0%(+4.57)#5,573 |
| 95. | 32425 | 10.5% | 6.0%(+4.49)#95 | 6.0%(+4.52)#5,623 |
| 96. | 32068 | 10.4% | 6.0%(+4.37)#96 | 6.0%(+4.41)#5,741 |
| 97. | 33838 | 10.3% | 6.0%(+4.31)#97 | 6.0%(+4.35)#5,804 |
| 98. | 32696 | 10.3% | 6.0%(+4.29)#98 | 6.0%(+4.33)#5,846 |
| 99. | 32618 | 10.3% | 6.0%(+4.27)#99 | 6.0%(+4.30)#5,876 |
| 100. | 32209 | 10.3% | 6.0%(+4.24)#100 | 6.0%(+4.28)#5,896 |
Common Questions
What are the Top 10 Zip Codes with the Highest Percentage of Population with a Degree in Arts and Humanities in Florida?
Top 10 Zip Codes with the Highest Percentage of Population with a Degree in Arts and Humanities in Florida are:
What zip code has the Highest Percentage of Population with a Degree in Arts and Humanities in Florida?
32612 has the Highest Percentage of Population with a Degree in Arts and Humanities in Florida with 100.0%.
What is the Percentage of Population with a Degree in Arts and Humanities in the State of Florida?
Percentage of Population with a Degree in Arts and Humanities in Florida is 6.0%.
What is the Percentage of Population with a Degree in Arts and Humanities in the United States?
Percentage of Population with a Degree in Arts and Humanities in the United States is 6.0%.