Zip Codes with the Highest Percentage of Population with a Degree in Communications in Florida
RELATED REPORTS & OPTIONS
Communications
Florida
Compare Zip Codes
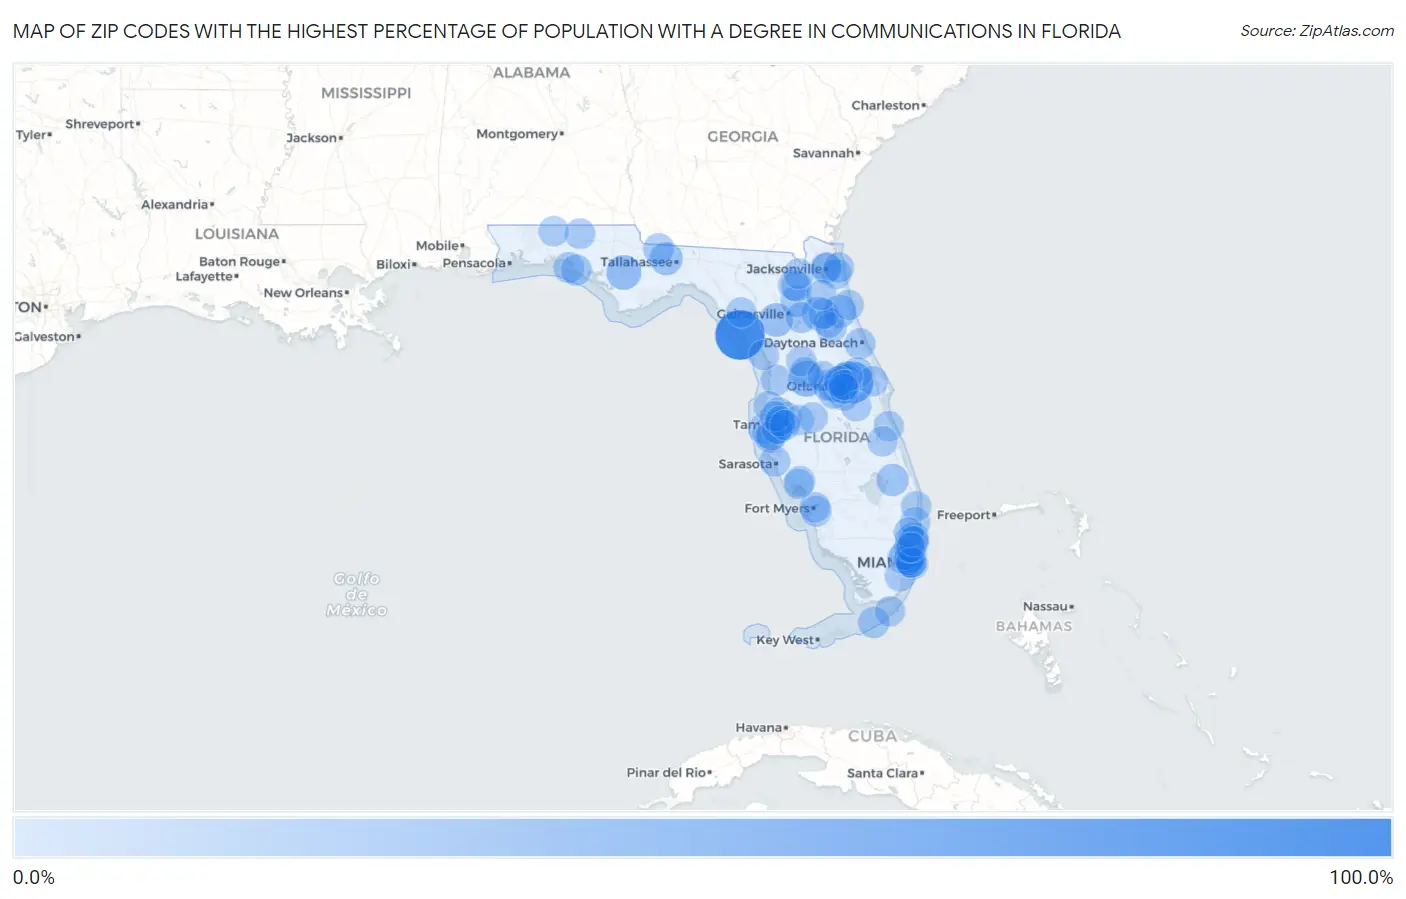
Map of Zip Codes with the Highest Percentage of Population with a Degree in Communications in Florida
0.0%
100.0%
Zip Codes with the Highest Percentage of Population with a Degree in Communications in Florida
| Zip Code | % Graduates | vs State | vs National | |
| 1. | 32692 | 100.0% | 3.9%(+96.1)#1 | 4.1%(+95.9)#13 |
| 2. | 32816 | 61.5% | 3.9%(+57.6)#2 | 4.1%(+57.4)#30 |
| 3. | 33514 | 32.8% | 3.9%(+28.9)#3 | 4.1%(+28.7)#132 |
| 4. | 32449 | 26.8% | 3.9%(+22.9)#4 | 4.1%(+22.7)#187 |
| 5. | 32618 | 22.2% | 3.9%(+18.3)#5 | 4.1%(+18.0)#271 |
| 6. | 32147 | 21.5% | 3.9%(+17.6)#6 | 4.1%(+17.4)#285 |
| 7. | 32145 | 19.3% | 3.9%(+15.4)#7 | 4.1%(+15.2)#352 |
| 8. | 32343 | 19.3% | 3.9%(+15.4)#8 | 4.1%(+15.2)#354 |
| 9. | 34956 | 16.2% | 3.9%(+12.2)#9 | 4.1%(+12.0)#484 |
| 10. | 33109 | 12.0% | 3.9%(+8.05)#10 | 4.1%(+7.84)#825 |
| 11. | 32044 | 11.6% | 3.9%(+7.70)#11 | 4.1%(+7.49)#872 |
| 12. | 32730 | 11.6% | 3.9%(+7.66)#12 | 4.1%(+7.45)#882 |
| 13. | 33001 | 11.3% | 3.9%(+7.33)#13 | 4.1%(+7.11)#936 |
| 14. | 32083 | 10.5% | 3.9%(+6.58)#14 | 4.1%(+6.36)#1,059 |
| 15. | 32459 | 10.0% | 3.9%(+6.12)#15 | 4.1%(+5.91)#1,125 |
| 16. | 34734 | 10.0% | 3.9%(+6.08)#16 | 4.1%(+5.87)#1,131 |
| 17. | 32352 | 9.6% | 3.9%(+5.68)#17 | 4.1%(+5.46)#1,239 |
| 18. | 32461 | 9.5% | 3.9%(+5.53)#18 | 4.1%(+5.32)#1,285 |
| 19. | 32640 | 9.4% | 3.9%(+5.51)#19 | 4.1%(+5.30)#1,292 |
| 20. | 33181 | 9.2% | 3.9%(+5.23)#20 | 4.1%(+5.02)#1,375 |
| 21. | 32114 | 9.1% | 3.9%(+5.20)#21 | 4.1%(+4.99)#1,386 |
| 22. | 34760 | 9.0% | 3.9%(+5.12)#22 | 4.1%(+4.90)#1,419 |
| 23. | 34614 | 9.0% | 3.9%(+5.08)#23 | 4.1%(+4.87)#1,434 |
| 24. | 33637 | 9.0% | 3.9%(+5.07)#24 | 4.1%(+4.86)#1,438 |
| 25. | 33966 | 8.5% | 3.9%(+4.54)#25 | 4.1%(+4.33)#1,647 |
| 26. | 32112 | 8.4% | 3.9%(+4.52)#26 | 4.1%(+4.31)#1,658 |
| 27. | 34234 | 8.4% | 3.9%(+4.52)#27 | 4.1%(+4.31)#1,659 |
| 28. | 33301 | 8.2% | 3.9%(+4.27)#28 | 4.1%(+4.06)#1,763 |
| 29. | 32707 | 8.2% | 3.9%(+4.25)#29 | 4.1%(+4.04)#1,783 |
| 30. | 32751 | 8.0% | 3.9%(+4.08)#30 | 4.1%(+3.87)#1,876 |
| 31. | 33585 | 8.0% | 3.9%(+4.08)#31 | 4.1%(+3.86)#1,883 |
| 32. | 33137 | 8.0% | 3.9%(+4.03)#32 | 4.1%(+3.82)#1,909 |
| 33. | 32202 | 8.0% | 3.9%(+4.03)#33 | 4.1%(+3.82)#1,912 |
| 34. | 32824 | 7.9% | 3.9%(+4.01)#34 | 4.1%(+3.80)#1,920 |
| 35. | 32026 | 7.9% | 3.9%(+3.94)#35 | 4.1%(+3.73)#1,959 |
| 36. | 33773 | 7.7% | 3.9%(+3.79)#36 | 4.1%(+3.58)#2,048 |
| 37. | 33308 | 7.6% | 3.9%(+3.71)#37 | 4.1%(+3.50)#2,109 |
| 38. | 33190 | 7.6% | 3.9%(+3.69)#38 | 4.1%(+3.48)#2,120 |
| 39. | 32181 | 7.6% | 3.9%(+3.66)#39 | 4.1%(+3.45)#2,141 |
| 40. | 32732 | 7.6% | 3.9%(+3.66)#40 | 4.1%(+3.45)#2,144 |
| 41. | 32806 | 7.6% | 3.9%(+3.65)#41 | 4.1%(+3.44)#2,150 |
| 42. | 32801 | 7.5% | 3.9%(+3.58)#42 | 4.1%(+3.37)#2,184 |
| 43. | 32796 | 7.5% | 3.9%(+3.54)#43 | 4.1%(+3.33)#2,219 |
| 44. | 32063 | 7.5% | 3.9%(+3.54)#44 | 4.1%(+3.32)#2,229 |
| 45. | 32464 | 7.4% | 3.9%(+3.52)#45 | 4.1%(+3.31)#2,238 |
| 46. | 32177 | 7.4% | 3.9%(+3.50)#46 | 4.1%(+3.29)#2,249 |
| 47. | 32811 | 7.4% | 3.9%(+3.47)#47 | 4.1%(+3.26)#2,271 |
| 48. | 32804 | 7.4% | 3.9%(+3.45)#48 | 4.1%(+3.24)#2,287 |
| 49. | 33714 | 7.3% | 3.9%(+3.42)#49 | 4.1%(+3.21)#2,305 |
| 50. | 33136 | 7.3% | 3.9%(+3.41)#50 | 4.1%(+3.20)#2,318 |
| 51. | 33606 | 7.3% | 3.9%(+3.37)#51 | 4.1%(+3.16)#2,346 |
| 52. | 32224 | 7.3% | 3.9%(+3.35)#52 | 4.1%(+3.14)#2,372 |
| 53. | 33916 | 7.3% | 3.9%(+3.34)#53 | 4.1%(+3.13)#2,376 |
| 54. | 33616 | 7.2% | 3.9%(+3.32)#54 | 4.1%(+3.11)#2,404 |
| 55. | 33602 | 7.2% | 3.9%(+3.24)#55 | 4.1%(+3.03)#2,460 |
| 56. | 34655 | 7.1% | 3.9%(+3.22)#56 | 4.1%(+3.01)#2,472 |
| 57. | 34288 | 7.1% | 3.9%(+3.16)#57 | 4.1%(+2.95)#2,528 |
| 58. | 33166 | 7.1% | 3.9%(+3.13)#58 | 4.1%(+2.92)#2,547 |
| 59. | 33548 | 7.0% | 3.9%(+3.12)#59 | 4.1%(+2.91)#2,555 |
| 60. | 32807 | 7.0% | 3.9%(+3.07)#60 | 4.1%(+2.86)#2,609 |
| 61. | 32206 | 7.0% | 3.9%(+3.05)#61 | 4.1%(+2.84)#2,623 |
| 62. | 33563 | 7.0% | 3.9%(+3.05)#62 | 4.1%(+2.84)#2,630 |
| 63. | 32043 | 6.9% | 3.9%(+3.00)#63 | 4.1%(+2.79)#2,676 |
| 64. | 34484 | 6.9% | 3.9%(+2.99)#64 | 4.1%(+2.78)#2,687 |
| 65. | 33138 | 6.9% | 3.9%(+2.93)#65 | 4.1%(+2.72)#2,744 |
| 66. | 33701 | 6.8% | 3.9%(+2.92)#66 | 4.1%(+2.71)#2,749 |
| 67. | 33070 | 6.8% | 3.9%(+2.92)#67 | 4.1%(+2.71)#2,750 |
| 68. | 34498 | 6.8% | 3.9%(+2.91)#68 | 4.1%(+2.70)#2,766 |
| 69. | 33801 | 6.8% | 3.9%(+2.90)#69 | 4.1%(+2.68)#2,773 |
| 70. | 32567 | 6.8% | 3.9%(+2.89)#70 | 4.1%(+2.68)#2,785 |
| 71. | 32233 | 6.8% | 3.9%(+2.88)#71 | 4.1%(+2.67)#2,788 |
| 72. | 33150 | 6.8% | 3.9%(+2.85)#72 | 4.1%(+2.64)#2,811 |
| 73. | 34705 | 6.8% | 3.9%(+2.85)#73 | 4.1%(+2.64)#2,814 |
| 74. | 32949 | 6.8% | 3.9%(+2.85)#74 | 4.1%(+2.64)#2,823 |
| 75. | 32708 | 6.7% | 3.9%(+2.80)#75 | 4.1%(+2.59)#2,882 |
| 76. | 34771 | 6.7% | 3.9%(+2.79)#76 | 4.1%(+2.58)#2,892 |
| 77. | 33311 | 6.7% | 3.9%(+2.77)#77 | 4.1%(+2.56)#2,925 |
| 78. | 33139 | 6.6% | 3.9%(+2.69)#78 | 4.1%(+2.48)#3,000 |
| 79. | 33487 | 6.6% | 3.9%(+2.69)#79 | 4.1%(+2.48)#3,002 |
| 80. | 33705 | 6.6% | 3.9%(+2.68)#80 | 4.1%(+2.47)#3,008 |
| 81. | 32966 | 6.6% | 3.9%(+2.67)#81 | 4.1%(+2.46)#3,018 |
| 82. | 32836 | 6.6% | 3.9%(+2.63)#82 | 4.1%(+2.42)#3,064 |
| 83. | 33054 | 6.5% | 3.9%(+2.59)#83 | 4.1%(+2.38)#3,113 |
| 84. | 33611 | 6.5% | 3.9%(+2.59)#84 | 4.1%(+2.38)#3,119 |
| 85. | 33127 | 6.5% | 3.9%(+2.56)#85 | 4.1%(+2.35)#3,147 |
| 86. | 33625 | 6.5% | 3.9%(+2.56)#86 | 4.1%(+2.35)#3,148 |
| 87. | 33603 | 6.5% | 3.9%(+2.56)#87 | 4.1%(+2.35)#3,149 |
| 88. | 33021 | 6.5% | 3.9%(+2.54)#88 | 4.1%(+2.33)#3,174 |
| 89. | 33132 | 6.5% | 3.9%(+2.54)#89 | 4.1%(+2.33)#3,175 |
| 90. | 33405 | 6.4% | 3.9%(+2.51)#90 | 4.1%(+2.30)#3,202 |
| 91. | 33619 | 6.4% | 3.9%(+2.48)#91 | 4.1%(+2.27)#3,234 |
| 92. | 32628 | 6.4% | 3.9%(+2.48)#92 | 4.1%(+2.27)#3,239 |
| 93. | 33063 | 6.4% | 3.9%(+2.47)#93 | 4.1%(+2.26)#3,249 |
| 94. | 32080 | 6.4% | 3.9%(+2.46)#94 | 4.1%(+2.24)#3,277 |
| 95. | 33954 | 6.4% | 3.9%(+2.45)#95 | 4.1%(+2.24)#3,278 |
| 96. | 33316 | 6.4% | 3.9%(+2.45)#96 | 4.1%(+2.24)#3,282 |
| 97. | 32810 | 6.4% | 3.9%(+2.43)#97 | 4.1%(+2.22)#3,312 |
| 98. | 32812 | 6.3% | 3.9%(+2.42)#98 | 4.1%(+2.21)#3,320 |
| 99. | 32803 | 6.3% | 3.9%(+2.36)#99 | 4.1%(+2.15)#3,377 |
| 100. | 33020 | 6.2% | 3.9%(+2.30)#100 | 4.1%(+2.09)#3,460 |
Common Questions
What are the Top 10 Zip Codes with the Highest Percentage of Population with a Degree in Communications in Florida?
Top 10 Zip Codes with the Highest Percentage of Population with a Degree in Communications in Florida are:
What zip code has the Highest Percentage of Population with a Degree in Communications in Florida?
32692 has the Highest Percentage of Population with a Degree in Communications in Florida with 100.0%.
What is the Percentage of Population with a Degree in Communications in the State of Florida?
Percentage of Population with a Degree in Communications in Florida is 3.9%.
What is the Percentage of Population with a Degree in Communications in the United States?
Percentage of Population with a Degree in Communications in the United States is 4.1%.