Zip Codes with the Highest Percentage of Households Heated by Fuel Oil / Kerosene in Florida
RELATED REPORTS & OPTIONS
Fuel Oil Heating
Florida
Compare Zip Codes
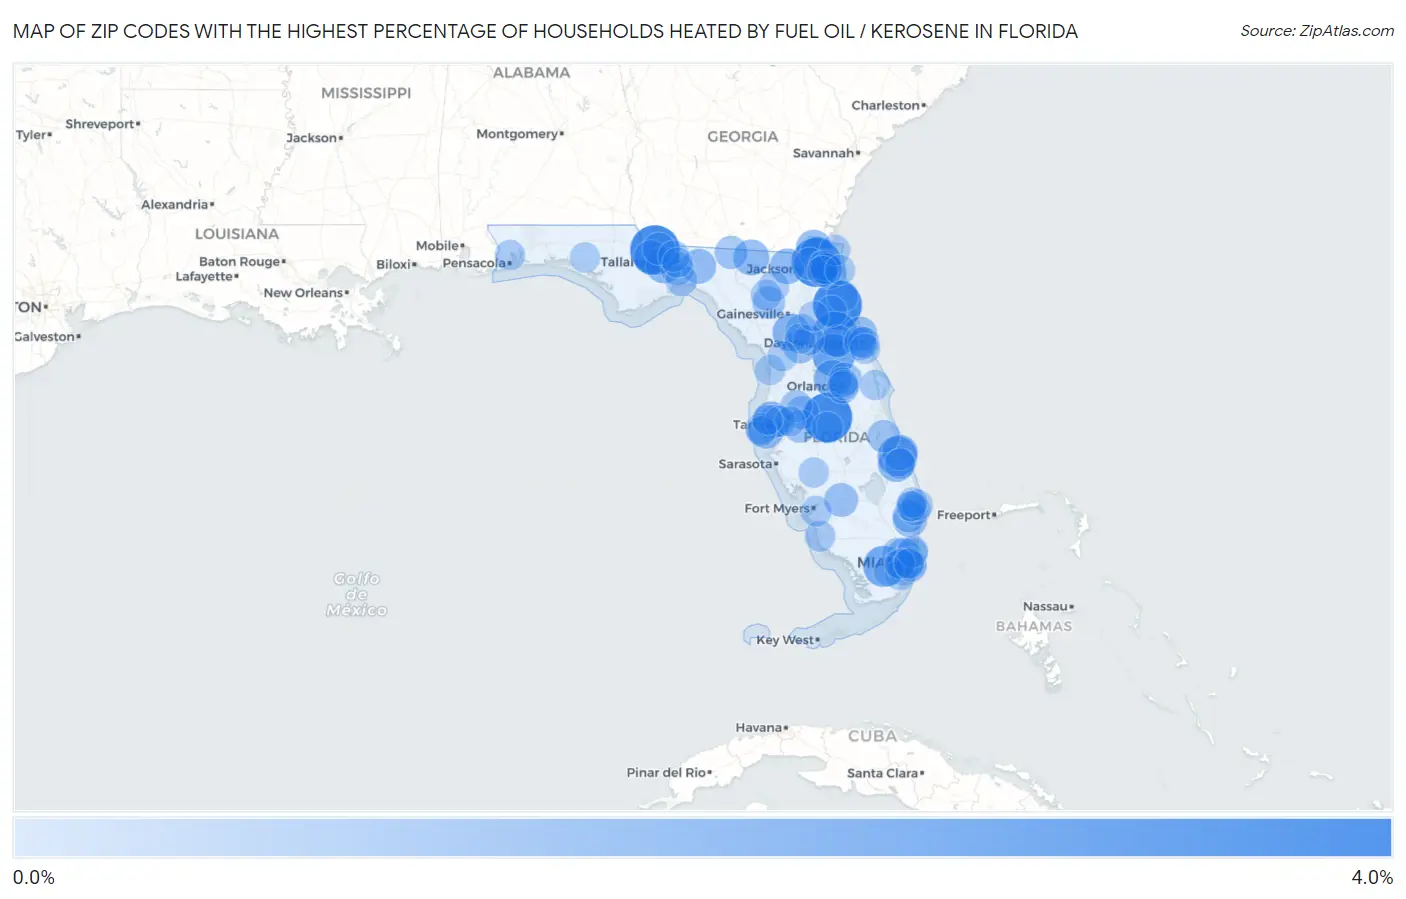
Map of Zip Codes with the Highest Percentage of Households Heated by Fuel Oil / Kerosene in Florida
0.0%
4.0%
Zip Codes with the Highest Percentage of Households Heated by Fuel Oil / Kerosene in Florida
| Zip Code | Fuel Oil Heating | vs State | vs National | |
| 1. | 32332 | 3.9% | 0.10%(+3.80)#1 | 4.2%(-0.300)#8,899 |
| 2. | 33851 | 3.9% | 0.10%(+3.80)#2 | 4.2%(-0.300)#8,904 |
| 3. | 32219 | 3.8% | 0.10%(+3.70)#3 | 4.2%(-0.400)#8,943 |
| 4. | 32033 | 3.8% | 0.10%(+3.70)#4 | 4.2%(-0.400)#8,959 |
| 5. | 32190 | 3.0% | 0.10%(+2.90)#5 | 4.2%(-1.20)#9,718 |
| 6. | 32767 | 2.6% | 0.10%(+2.50)#6 | 4.2%(-1.60)#10,148 |
| 7. | 33194 | 2.3% | 0.10%(+2.20)#7 | 4.2%(-1.90)#10,483 |
| 8. | 34947 | 2.1% | 0.10%(+2.00)#8 | 4.2%(-2.10)#10,759 |
| 9. | 32703 | 1.7% | 0.10%(+1.60)#9 | 4.2%(-2.50)#11,340 |
| 10. | 32686 | 1.7% | 0.10%(+1.60)#10 | 4.2%(-2.50)#11,407 |
| 11. | 33635 | 1.6% | 0.10%(+1.50)#11 | 4.2%(-2.60)#11,521 |
| 12. | 34986 | 1.5% | 0.10%(+1.40)#12 | 4.2%(-2.70)#11,699 |
| 13. | 32310 | 1.5% | 0.10%(+1.40)#13 | 4.2%(-2.70)#11,727 |
| 14. | 32052 | 1.4% | 0.10%(+1.30)#14 | 4.2%(-2.80)#11,926 |
| 15. | 32046 | 1.3% | 0.10%(+1.20)#15 | 4.2%(-2.90)#12,102 |
| 16. | 34946 | 1.3% | 0.10%(+1.20)#16 | 4.2%(-2.90)#12,129 |
| 17. | 32087 | 1.3% | 0.10%(+1.20)#17 | 4.2%(-2.90)#12,135 |
| 18. | 33781 | 1.2% | 0.10%(+1.10)#18 | 4.2%(-3.00)#12,274 |
| 19. | 32351 | 1.2% | 0.10%(+1.10)#19 | 4.2%(-3.00)#12,298 |
| 20. | 32011 | 1.2% | 0.10%(+1.10)#20 | 4.2%(-3.00)#12,302 |
| 21. | 32344 | 1.2% | 0.10%(+1.10)#21 | 4.2%(-3.00)#12,317 |
| 22. | 33446 | 1.1% | 0.10%(+1.00)#22 | 4.2%(-3.10)#12,472 |
| 23. | 34471 | 1.1% | 0.10%(+1.00)#23 | 4.2%(-3.10)#12,474 |
| 24. | 32176 | 1.1% | 0.10%(+1.00)#24 | 4.2%(-3.10)#12,507 |
| 25. | 33014 | 1.0% | 0.10%(+0.900)#25 | 4.2%(-3.20)#12,693 |
| 26. | 33935 | 1.0% | 0.10%(+0.900)#26 | 4.2%(-3.20)#12,721 |
| 27. | 32206 | 1.0% | 0.10%(+0.900)#27 | 4.2%(-3.20)#12,745 |
| 28. | 32204 | 1.0% | 0.10%(+0.900)#28 | 4.2%(-3.20)#12,786 |
| 29. | 33810 | 0.90% | 0.10%(+0.800)#29 | 4.2%(-3.30)#12,937 |
| 30. | 32216 | 0.90% | 0.10%(+0.800)#30 | 4.2%(-3.30)#12,947 |
| 31. | 33634 | 0.90% | 0.10%(+0.800)#31 | 4.2%(-3.30)#12,994 |
| 32. | 32305 | 0.90% | 0.10%(+0.800)#32 | 4.2%(-3.30)#13,000 |
| 33. | 32254 | 0.90% | 0.10%(+0.800)#33 | 4.2%(-3.30)#13,022 |
| 34. | 33567 | 0.90% | 0.10%(+0.800)#34 | 4.2%(-3.30)#13,029 |
| 35. | 32350 | 0.90% | 0.10%(+0.800)#35 | 4.2%(-3.30)#13,164 |
| 36. | 32707 | 0.80% | 0.10%(+0.700)#36 | 4.2%(-3.40)#13,234 |
| 37. | 32209 | 0.80% | 0.10%(+0.700)#37 | 4.2%(-3.40)#13,238 |
| 38. | 32114 | 0.80% | 0.10%(+0.700)#38 | 4.2%(-3.40)#13,240 |
| 39. | 33131 | 0.80% | 0.10%(+0.700)#39 | 4.2%(-3.40)#13,274 |
| 40. | 32643 | 0.80% | 0.10%(+0.700)#40 | 4.2%(-3.40)#13,339 |
| 41. | 33473 | 0.80% | 0.10%(+0.700)#41 | 4.2%(-3.40)#13,340 |
| 42. | 32948 | 0.80% | 0.10%(+0.700)#42 | 4.2%(-3.40)#13,382 |
| 43. | 32352 | 0.80% | 0.10%(+0.700)#43 | 4.2%(-3.40)#13,396 |
| 44. | 32180 | 0.80% | 0.10%(+0.700)#44 | 4.2%(-3.40)#13,400 |
| 45. | 32009 | 0.80% | 0.10%(+0.700)#45 | 4.2%(-3.40)#13,427 |
| 46. | 32806 | 0.70% | 0.10%(+0.600)#46 | 4.2%(-3.50)#13,574 |
| 47. | 33542 | 0.70% | 0.10%(+0.600)#47 | 4.2%(-3.50)#13,583 |
| 48. | 32113 | 0.70% | 0.10%(+0.600)#48 | 4.2%(-3.50)#13,720 |
| 49. | 32355 | 0.70% | 0.10%(+0.600)#49 | 4.2%(-3.50)#13,869 |
| 50. | 33018 | 0.60% | 0.10%(+0.500)#50 | 4.2%(-3.60)#13,878 |
| 51. | 32303 | 0.60% | 0.10%(+0.500)#51 | 4.2%(-3.60)#13,884 |
| 52. | 33155 | 0.60% | 0.10%(+0.500)#52 | 4.2%(-3.60)#13,889 |
| 53. | 32084 | 0.60% | 0.10%(+0.500)#53 | 4.2%(-3.60)#13,906 |
| 54. | 33180 | 0.60% | 0.10%(+0.500)#54 | 4.2%(-3.60)#13,921 |
| 55. | 32208 | 0.60% | 0.10%(+0.500)#55 | 4.2%(-3.60)#13,929 |
| 56. | 32117 | 0.60% | 0.10%(+0.500)#56 | 4.2%(-3.60)#13,936 |
| 57. | 32118 | 0.60% | 0.10%(+0.500)#57 | 4.2%(-3.60)#14,002 |
| 58. | 33778 | 0.60% | 0.10%(+0.500)#58 | 4.2%(-3.60)#14,018 |
| 59. | 33859 | 0.60% | 0.10%(+0.500)#59 | 4.2%(-3.60)#14,052 |
| 60. | 32202 | 0.60% | 0.10%(+0.500)#60 | 4.2%(-3.60)#14,103 |
| 61. | 32131 | 0.60% | 0.10%(+0.500)#61 | 4.2%(-3.60)#14,137 |
| 62. | 33165 | 0.50% | 0.10%(+0.400)#62 | 4.2%(-3.70)#14,283 |
| 63. | 33415 | 0.50% | 0.10%(+0.400)#63 | 4.2%(-3.70)#14,284 |
| 64. | 33461 | 0.50% | 0.10%(+0.400)#64 | 4.2%(-3.70)#14,291 |
| 65. | 34983 | 0.50% | 0.10%(+0.400)#65 | 4.2%(-3.70)#14,297 |
| 66. | 32034 | 0.50% | 0.10%(+0.400)#66 | 4.2%(-3.70)#14,315 |
| 67. | 33156 | 0.50% | 0.10%(+0.400)#67 | 4.2%(-3.70)#14,340 |
| 68. | 32205 | 0.50% | 0.10%(+0.400)#68 | 4.2%(-3.70)#14,348 |
| 69. | 33189 | 0.50% | 0.10%(+0.400)#69 | 4.2%(-3.70)#14,394 |
| 70. | 32025 | 0.50% | 0.10%(+0.400)#70 | 4.2%(-3.70)#14,399 |
| 71. | 33603 | 0.50% | 0.10%(+0.400)#71 | 4.2%(-3.70)#14,421 |
| 72. | 33136 | 0.50% | 0.10%(+0.400)#72 | 4.2%(-3.70)#14,435 |
| 73. | 34105 | 0.50% | 0.10%(+0.400)#73 | 4.2%(-3.70)#14,440 |
| 74. | 33149 | 0.50% | 0.10%(+0.400)#74 | 4.2%(-3.70)#14,456 |
| 75. | 34488 | 0.50% | 0.10%(+0.400)#75 | 4.2%(-3.70)#14,482 |
| 76. | 33966 | 0.50% | 0.10%(+0.400)#76 | 4.2%(-3.70)#14,489 |
| 77. | 33480 | 0.50% | 0.10%(+0.400)#77 | 4.2%(-3.70)#14,493 |
| 78. | 32038 | 0.50% | 0.10%(+0.400)#78 | 4.2%(-3.70)#14,503 |
| 79. | 33196 | 0.40% | 0.10%(+0.300)#79 | 4.2%(-3.80)#14,719 |
| 80. | 32514 | 0.40% | 0.10%(+0.300)#80 | 4.2%(-3.80)#14,743 |
| 81. | 33160 | 0.40% | 0.10%(+0.300)#81 | 4.2%(-3.80)#14,748 |
| 82. | 32780 | 0.40% | 0.10%(+0.300)#82 | 4.2%(-3.80)#14,766 |
| 83. | 33417 | 0.40% | 0.10%(+0.300)#83 | 4.2%(-3.80)#14,778 |
| 84. | 33174 | 0.40% | 0.10%(+0.300)#84 | 4.2%(-3.80)#14,786 |
| 85. | 32301 | 0.40% | 0.10%(+0.300)#85 | 4.2%(-3.80)#14,790 |
| 86. | 34266 | 0.40% | 0.10%(+0.300)#86 | 4.2%(-3.80)#14,828 |
| 87. | 32127 | 0.40% | 0.10%(+0.300)#87 | 4.2%(-3.80)#14,831 |
| 88. | 33584 | 0.40% | 0.10%(+0.300)#88 | 4.2%(-3.80)#14,832 |
| 89. | 32789 | 0.40% | 0.10%(+0.300)#89 | 4.2%(-3.80)#14,841 |
| 90. | 33772 | 0.40% | 0.10%(+0.300)#90 | 4.2%(-3.80)#14,860 |
| 91. | 32803 | 0.40% | 0.10%(+0.300)#91 | 4.2%(-3.80)#14,868 |
| 92. | 33413 | 0.40% | 0.10%(+0.300)#92 | 4.2%(-3.80)#14,912 |
| 93. | 34695 | 0.40% | 0.10%(+0.300)#93 | 4.2%(-3.80)#14,914 |
| 94. | 33129 | 0.40% | 0.10%(+0.300)#94 | 4.2%(-3.80)#14,933 |
| 95. | 34479 | 0.40% | 0.10%(+0.300)#95 | 4.2%(-3.80)#14,950 |
| 96. | 32148 | 0.40% | 0.10%(+0.300)#96 | 4.2%(-3.80)#14,986 |
| 97. | 34448 | 0.40% | 0.10%(+0.300)#97 | 4.2%(-3.80)#14,987 |
| 98. | 34434 | 0.40% | 0.10%(+0.300)#98 | 4.2%(-3.80)#14,995 |
| 99. | 32266 | 0.40% | 0.10%(+0.300)#99 | 4.2%(-3.80)#15,047 |
| 100. | 32462 | 0.40% | 0.10%(+0.300)#100 | 4.2%(-3.80)#15,092 |
Common Questions
What are the Top 10 Zip Codes with the Highest Percentage of Households Heated by Fuel Oil / Kerosene in Florida?
Top 10 Zip Codes with the Highest Percentage of Households Heated by Fuel Oil / Kerosene in Florida are:
What zip code has the Highest Percentage of Households Heated by Fuel Oil / Kerosene in Florida?
32332 has the Highest Percentage of Households Heated by Fuel Oil / Kerosene in Florida with 3.9%.
What is the Percentage of Households Heated by Fuel Oil / Kerosene in the State of Florida?
Percentage of Households Heated by Fuel Oil / Kerosene in Florida is 0.10%.
What is the Percentage of Households Heated by Fuel Oil / Kerosene in the United States?
Percentage of Households Heated by Fuel Oil / Kerosene in the United States is 4.2%.