Zip Codes with the Highest Percentage of Self-Employed / Incorporated in Florida
RELATED REPORTS & OPTIONS
Self-Employed / Incorporated
Florida
Compare Zip Codes
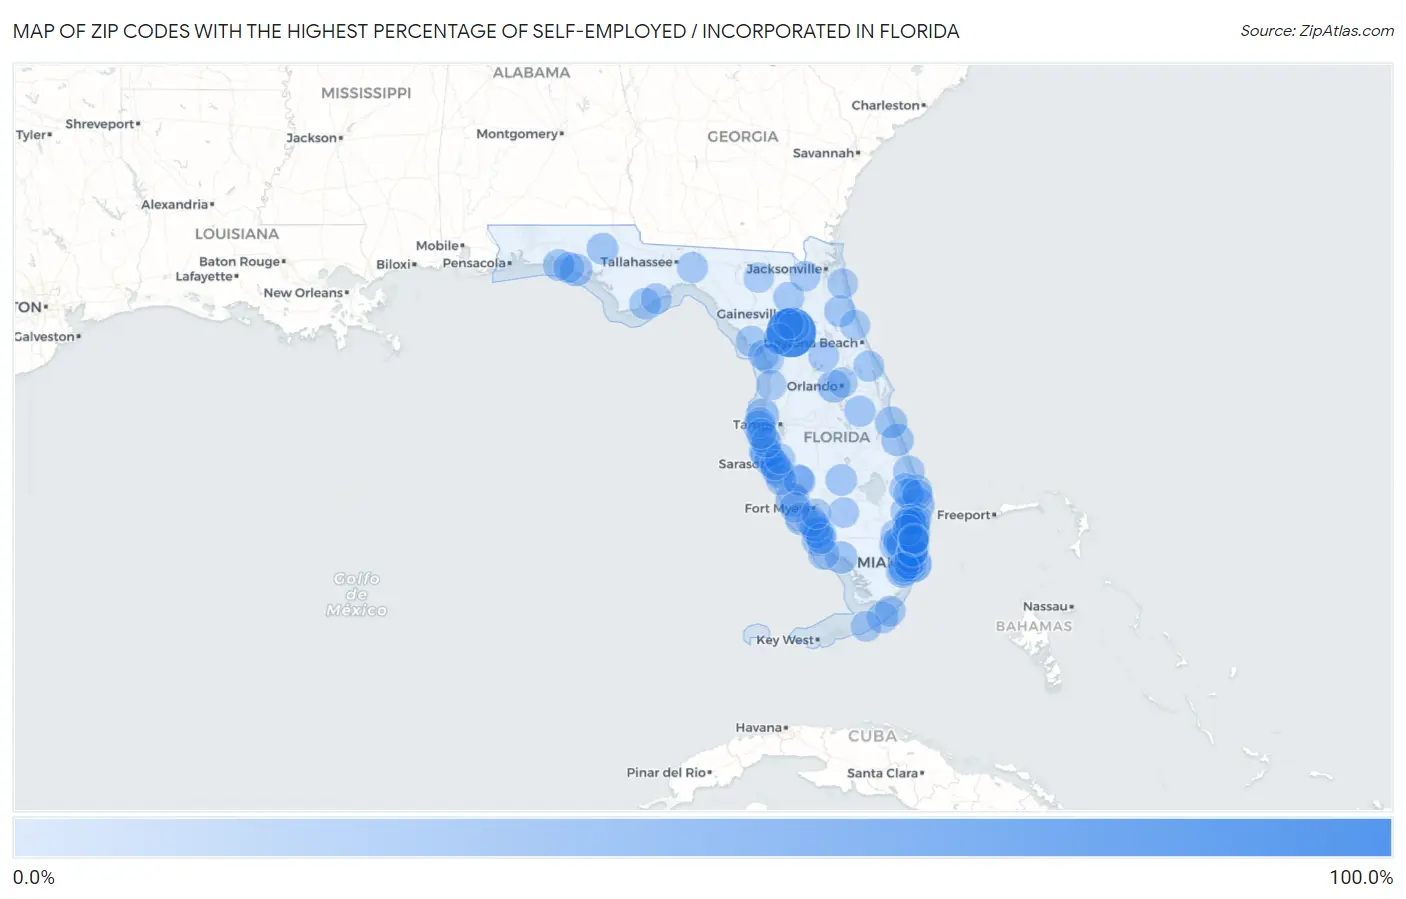
Map of Zip Codes with the Highest Percentage of Self-Employed / Incorporated in Florida
0.0%
100.0%
Zip Codes with the Highest Percentage of Self-Employed / Incorporated in Florida
| Zip Code | % Self-Employed / Incorporated | vs State | vs National | |
| 1. | 32634 | 100.0% | 6.1%(+93.9)#1 | 3.8%(+96.2)#22 |
| 2. | 33109 | 47.8% | 6.1%(+41.7)#2 | 3.8%(+44.0)#95 |
| 3. | 33480 | 29.0% | 6.1%(+22.9)#3 | 3.8%(+25.2)#230 |
| 4. | 33921 | 27.8% | 6.1%(+21.7)#4 | 3.8%(+24.0)#252 |
| 5. | 34681 | 25.4% | 6.1%(+19.3)#5 | 3.8%(+21.6)#301 |
| 6. | 33158 | 24.4% | 6.1%(+18.3)#6 | 3.8%(+20.6)#329 |
| 7. | 34734 | 23.4% | 6.1%(+17.3)#7 | 3.8%(+19.6)#359 |
| 8. | 33957 | 22.7% | 6.1%(+16.6)#8 | 3.8%(+18.9)#385 |
| 9. | 32461 | 21.7% | 6.1%(+15.6)#9 | 3.8%(+17.9)#422 |
| 10. | 32963 | 21.7% | 6.1%(+15.6)#10 | 3.8%(+17.9)#424 |
| 11. | 34139 | 21.1% | 6.1%(+14.9)#11 | 3.8%(+17.2)#446 |
| 12. | 34216 | 20.2% | 6.1%(+14.1)#12 | 3.8%(+16.3)#499 |
| 13. | 34217 | 19.3% | 6.1%(+13.2)#13 | 3.8%(+15.5)#538 |
| 14. | 32951 | 19.3% | 6.1%(+13.1)#14 | 3.8%(+15.4)#544 |
| 15. | 34228 | 18.8% | 6.1%(+12.7)#15 | 3.8%(+15.0)#565 |
| 16. | 34109 | 18.5% | 6.1%(+12.4)#16 | 3.8%(+14.7)#588 |
| 17. | 34102 | 18.3% | 6.1%(+12.2)#17 | 3.8%(+14.5)#603 |
| 18. | 33154 | 18.2% | 6.1%(+12.1)#18 | 3.8%(+14.4)#611 |
| 19. | 32664 | 18.2% | 6.1%(+12.1)#19 | 3.8%(+14.4)#614 |
| 20. | 32463 | 18.2% | 6.1%(+12.1)#20 | 3.8%(+14.4)#616 |
| 21. | 33960 | 18.0% | 6.1%(+11.8)#21 | 3.8%(+14.1)#629 |
| 22. | 32145 | 18.0% | 6.1%(+11.8)#22 | 3.8%(+14.1)#630 |
| 23. | 32550 | 17.5% | 6.1%(+11.4)#23 | 3.8%(+13.7)#662 |
| 24. | 33036 | 17.3% | 6.1%(+11.2)#24 | 3.8%(+13.5)#677 |
| 25. | 33332 | 17.3% | 6.1%(+11.2)#25 | 3.8%(+13.5)#679 |
| 26. | 34996 | 17.2% | 6.1%(+11.1)#26 | 3.8%(+13.4)#687 |
| 27. | 34145 | 16.9% | 6.1%(+10.8)#27 | 3.8%(+13.1)#715 |
| 28. | 33327 | 16.8% | 6.1%(+10.7)#28 | 3.8%(+13.0)#725 |
| 29. | 32328 | 16.7% | 6.1%(+10.6)#29 | 3.8%(+12.9)#731 |
| 30. | 33477 | 16.7% | 6.1%(+10.6)#30 | 3.8%(+12.9)#733 |
| 31. | 33156 | 16.6% | 6.1%(+10.4)#31 | 3.8%(+12.7)#757 |
| 32. | 34242 | 16.4% | 6.1%(+10.3)#32 | 3.8%(+12.6)#769 |
| 33. | 33786 | 16.4% | 6.1%(+10.3)#33 | 3.8%(+12.5)#773 |
| 34. | 34773 | 16.3% | 6.1%(+10.2)#34 | 3.8%(+12.5)#776 |
| 35. | 34108 | 16.1% | 6.1%(+9.99)#35 | 3.8%(+12.3)#805 |
| 36. | 33449 | 16.0% | 6.1%(+9.94)#36 | 3.8%(+12.2)#809 |
| 37. | 33019 | 15.9% | 6.1%(+9.80)#37 | 3.8%(+12.1)#833 |
| 38. | 33331 | 15.9% | 6.1%(+9.79)#38 | 3.8%(+12.1)#835 |
| 39. | 33131 | 15.8% | 6.1%(+9.64)#39 | 3.8%(+11.9)#854 |
| 40. | 33149 | 15.6% | 6.1%(+9.51)#40 | 3.8%(+11.8)#867 |
| 41. | 32361 | 15.6% | 6.1%(+9.46)#41 | 3.8%(+11.8)#872 |
| 42. | 32625 | 15.5% | 6.1%(+9.41)#42 | 3.8%(+11.7)#878 |
| 43. | 32622 | 15.5% | 6.1%(+9.40)#43 | 3.8%(+11.7)#881 |
| 44. | 33478 | 15.5% | 6.1%(+9.35)#44 | 3.8%(+11.6)#890 |
| 45. | 33306 | 15.4% | 6.1%(+9.29)#45 | 3.8%(+11.6)#897 |
| 46. | 34229 | 15.1% | 6.1%(+8.97)#46 | 3.8%(+11.3)#936 |
| 47. | 32459 | 15.1% | 6.1%(+8.95)#47 | 3.8%(+11.2)#941 |
| 48. | 33070 | 14.9% | 6.1%(+8.83)#48 | 3.8%(+11.1)#963 |
| 49. | 32759 | 14.9% | 6.1%(+8.81)#49 | 3.8%(+11.1)#966 |
| 50. | 33418 | 14.9% | 6.1%(+8.77)#50 | 3.8%(+11.1)#980 |
| 51. | 34498 | 14.7% | 6.1%(+8.63)#51 | 3.8%(+10.9)#999 |
| 52. | 34134 | 14.4% | 6.1%(+8.32)#52 | 3.8%(+10.6)#1,046 |
| 53. | 33050 | 14.4% | 6.1%(+8.32)#53 | 3.8%(+10.6)#1,047 |
| 54. | 34288 | 14.4% | 6.1%(+8.31)#54 | 3.8%(+10.6)#1,049 |
| 55. | 33433 | 14.4% | 6.1%(+8.30)#55 | 3.8%(+10.6)#1,050 |
| 56. | 32322 | 14.3% | 6.1%(+8.21)#56 | 3.8%(+10.5)#1,067 |
| 57. | 33483 | 14.2% | 6.1%(+8.06)#57 | 3.8%(+10.4)#1,100 |
| 58. | 34289 | 14.2% | 6.1%(+8.05)#58 | 3.8%(+10.3)#1,101 |
| 59. | 33931 | 14.2% | 6.1%(+8.04)#59 | 3.8%(+10.3)#1,103 |
| 60. | 33434 | 14.1% | 6.1%(+7.95)#60 | 3.8%(+10.2)#1,120 |
| 61. | 33706 | 14.0% | 6.1%(+7.89)#61 | 3.8%(+10.2)#1,127 |
| 62. | 33140 | 14.0% | 6.1%(+7.84)#62 | 3.8%(+10.1)#1,141 |
| 63. | 34285 | 13.9% | 6.1%(+7.76)#63 | 3.8%(+10.1)#1,160 |
| 64. | 33326 | 13.8% | 6.1%(+7.65)#64 | 3.8%(+9.95)#1,188 |
| 65. | 33486 | 13.7% | 6.1%(+7.60)#65 | 3.8%(+9.90)#1,196 |
| 66. | 33408 | 13.7% | 6.1%(+7.57)#66 | 3.8%(+9.86)#1,205 |
| 67. | 32668 | 13.5% | 6.1%(+7.41)#67 | 3.8%(+9.71)#1,229 |
| 68. | 33062 | 13.5% | 6.1%(+7.36)#68 | 3.8%(+9.65)#1,236 |
| 69. | 33330 | 13.5% | 6.1%(+7.34)#69 | 3.8%(+9.63)#1,239 |
| 70. | 33138 | 13.4% | 6.1%(+7.32)#70 | 3.8%(+9.61)#1,243 |
| 71. | 33496 | 13.4% | 6.1%(+7.28)#71 | 3.8%(+9.58)#1,248 |
| 72. | 32784 | 13.4% | 6.1%(+7.28)#72 | 3.8%(+9.58)#1,249 |
| 73. | 32667 | 13.3% | 6.1%(+7.22)#73 | 3.8%(+9.51)#1,258 |
| 74. | 33446 | 13.3% | 6.1%(+7.19)#74 | 3.8%(+9.49)#1,264 |
| 75. | 33930 | 13.2% | 6.1%(+7.10)#75 | 3.8%(+9.40)#1,274 |
| 76. | 33129 | 13.1% | 6.1%(+7.01)#76 | 3.8%(+9.31)#1,294 |
| 77. | 32234 | 13.1% | 6.1%(+6.98)#77 | 3.8%(+9.27)#1,304 |
| 78. | 32082 | 13.1% | 6.1%(+6.96)#78 | 3.8%(+9.25)#1,307 |
| 79. | 33922 | 13.1% | 6.1%(+6.94)#79 | 3.8%(+9.24)#1,312 |
| 80. | 33767 | 13.0% | 6.1%(+6.93)#80 | 3.8%(+9.22)#1,316 |
| 81. | 34428 | 13.0% | 6.1%(+6.86)#81 | 3.8%(+9.16)#1,326 |
| 82. | 34236 | 12.9% | 6.1%(+6.77)#82 | 3.8%(+9.07)#1,337 |
| 83. | 33160 | 12.8% | 6.1%(+6.65)#83 | 3.8%(+8.95)#1,370 |
| 84. | 34104 | 12.7% | 6.1%(+6.55)#84 | 3.8%(+8.84)#1,400 |
| 85. | 33912 | 12.6% | 6.1%(+6.48)#85 | 3.8%(+8.77)#1,417 |
| 86. | 34201 | 12.6% | 6.1%(+6.47)#86 | 3.8%(+8.76)#1,421 |
| 87. | 33498 | 12.6% | 6.1%(+6.46)#87 | 3.8%(+8.75)#1,424 |
| 88. | 33487 | 12.5% | 6.1%(+6.39)#88 | 3.8%(+8.69)#1,437 |
| 89. | 33715 | 12.5% | 6.1%(+6.38)#89 | 3.8%(+8.67)#1,453 |
| 90. | 33180 | 12.4% | 6.1%(+6.30)#90 | 3.8%(+8.59)#1,471 |
| 91. | 33316 | 12.4% | 6.1%(+6.27)#91 | 3.8%(+8.56)#1,478 |
| 92. | 33067 | 12.3% | 6.1%(+6.22)#92 | 3.8%(+8.52)#1,488 |
| 93. | 32094 | 12.3% | 6.1%(+6.17)#93 | 3.8%(+8.46)#1,499 |
| 94. | 33304 | 12.2% | 6.1%(+6.13)#94 | 3.8%(+8.43)#1,509 |
| 95. | 34607 | 12.2% | 6.1%(+6.08)#95 | 3.8%(+8.38)#1,521 |
| 96. | 32136 | 12.1% | 6.1%(+6.03)#96 | 3.8%(+8.33)#1,533 |
| 97. | 33708 | 12.1% | 6.1%(+6.02)#97 | 3.8%(+8.31)#1,538 |
| 98. | 33305 | 12.0% | 6.1%(+5.86)#98 | 3.8%(+8.15)#1,569 |
| 99. | 32789 | 11.9% | 6.1%(+5.82)#99 | 3.8%(+8.11)#1,578 |
| 100. | 33143 | 11.9% | 6.1%(+5.74)#100 | 3.8%(+8.03)#1,594 |
Common Questions
What are the Top 10 Zip Codes with the Highest Percentage of Self-Employed / Incorporated in Florida?
Top 10 Zip Codes with the Highest Percentage of Self-Employed / Incorporated in Florida are:
What zip code has the Highest Percentage of Self-Employed / Incorporated in Florida?
32634 has the Highest Percentage of Self-Employed / Incorporated in Florida with 100.0%.
What is the Percentage of Self-Employed / Incorporated in the State of Florida?
Percentage of Self-Employed / Incorporated in Florida is 6.1%.
What is the Percentage of Self-Employed / Incorporated in the United States?
Percentage of Self-Employed / Incorporated in the United States is 3.8%.