Zip Codes with the Highest Percentage of Population Employed in Real Estate, Rental & Leasing in Florida
RELATED REPORTS & OPTIONS
Real Estate, Rental & Leasing
Florida
Compare Zip Codes
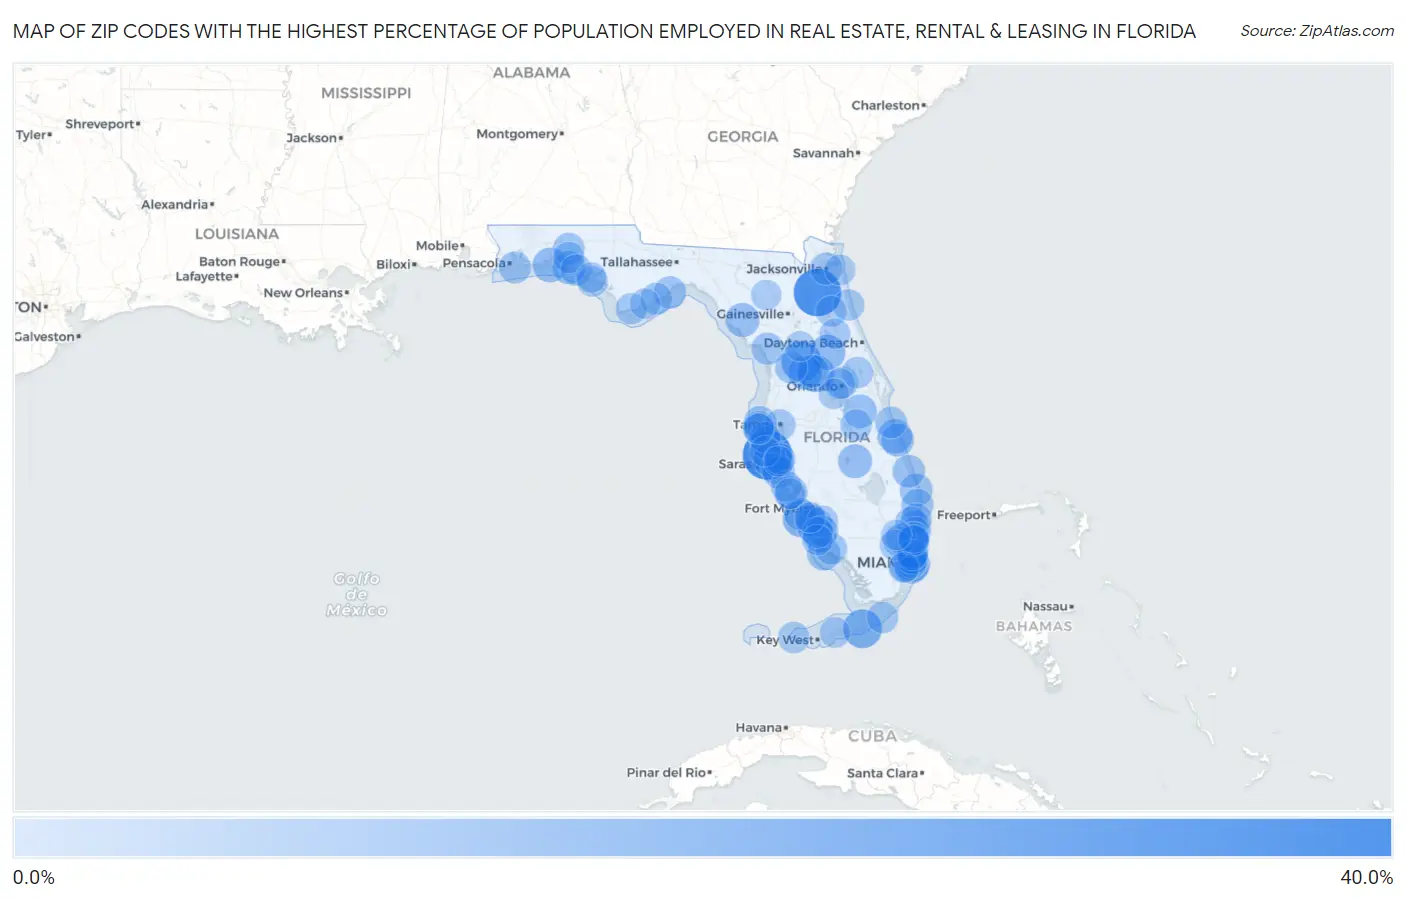
Map of Zip Codes with the Highest Percentage of Population Employed in Real Estate, Rental & Leasing in Florida
0.0%
40.0%
Zip Codes with the Highest Percentage of Population Employed in Real Estate, Rental & Leasing in Florida
| Zip Code | % Employed | vs State | vs National | |
| 1. | 34215 | 30.3% | 2.8%(+27.5)#1 | 1.9%(+28.4)#44 |
| 2. | 32079 | 27.8% | 2.8%(+25.0)#2 | 1.9%(+25.9)#56 |
| 3. | 34484 | 17.9% | 2.8%(+15.1)#3 | 1.9%(+16.0)#128 |
| 4. | 33051 | 16.2% | 2.8%(+13.4)#4 | 1.9%(+14.3)#150 |
| 5. | 33957 | 13.8% | 2.8%(+11.0)#5 | 1.9%(+11.9)#210 |
| 6. | 34797 | 13.1% | 2.8%(+10.3)#6 | 1.9%(+11.2)#222 |
| 7. | 34134 | 12.6% | 2.8%(+9.80)#7 | 1.9%(+10.7)#241 |
| 8. | 33109 | 11.9% | 2.8%(+9.14)#8 | 1.9%(+10.0)#266 |
| 9. | 32702 | 11.8% | 2.8%(+8.98)#9 | 1.9%(+9.89)#272 |
| 10. | 33149 | 10.9% | 2.8%(+8.07)#10 | 1.9%(+8.98)#318 |
| 11. | 32541 | 10.7% | 2.8%(+7.90)#11 | 1.9%(+8.81)#327 |
| 12. | 32970 | 10.6% | 2.8%(+7.79)#12 | 1.9%(+8.69)#338 |
| 13. | 33585 | 10.3% | 2.8%(+7.47)#13 | 1.9%(+8.37)#361 |
| 14. | 33857 | 9.9% | 2.8%(+7.10)#14 | 1.9%(+8.00)#387 |
| 15. | 32680 | 9.8% | 2.8%(+7.05)#15 | 1.9%(+7.95)#391 |
| 16. | 34228 | 9.5% | 2.8%(+6.75)#16 | 1.9%(+7.65)#418 |
| 17. | 34773 | 9.3% | 2.8%(+6.53)#17 | 1.9%(+7.44)#444 |
| 18. | 34145 | 9.3% | 2.8%(+6.49)#18 | 1.9%(+7.40)#446 |
| 19. | 32459 | 9.0% | 2.8%(+6.21)#19 | 1.9%(+7.11)#463 |
| 20. | 32963 | 8.6% | 2.8%(+5.82)#20 | 1.9%(+6.73)#488 |
| 21. | 33477 | 8.5% | 2.8%(+5.73)#21 | 1.9%(+6.63)#493 |
| 22. | 34762 | 8.4% | 2.8%(+5.64)#22 | 1.9%(+6.54)#502 |
| 23. | 33767 | 8.4% | 2.8%(+5.56)#23 | 1.9%(+6.47)#510 |
| 24. | 34996 | 8.3% | 2.8%(+5.54)#24 | 1.9%(+6.45)#513 |
| 25. | 33131 | 8.0% | 2.8%(+5.17)#25 | 1.9%(+6.08)#558 |
| 26. | 32346 | 8.0% | 2.8%(+5.15)#26 | 1.9%(+6.06)#561 |
| 27. | 34105 | 7.9% | 2.8%(+5.09)#27 | 1.9%(+5.99)#572 |
| 28. | 32202 | 7.8% | 2.8%(+5.02)#28 | 1.9%(+5.93)#584 |
| 29. | 33947 | 7.8% | 2.8%(+5.01)#29 | 1.9%(+5.91)#585 |
| 30. | 34449 | 7.7% | 2.8%(+4.93)#30 | 1.9%(+5.84)#600 |
| 31. | 34450 | 7.6% | 2.8%(+4.79)#31 | 1.9%(+5.70)#619 |
| 32. | 33480 | 7.5% | 2.8%(+4.74)#32 | 1.9%(+5.65)#629 |
| 33. | 34229 | 7.5% | 2.8%(+4.73)#33 | 1.9%(+5.63)#633 |
| 34. | 33180 | 7.5% | 2.8%(+4.69)#34 | 1.9%(+5.59)#640 |
| 35. | 33432 | 7.4% | 2.8%(+4.65)#35 | 1.9%(+5.56)#645 |
| 36. | 33931 | 7.3% | 2.8%(+4.55)#36 | 1.9%(+5.45)#671 |
| 37. | 32561 | 7.3% | 2.8%(+4.53)#37 | 1.9%(+5.44)#672 |
| 38. | 33785 | 7.2% | 2.8%(+4.44)#38 | 1.9%(+5.34)#682 |
| 39. | 33715 | 7.2% | 2.8%(+4.43)#39 | 1.9%(+5.33)#688 |
| 40. | 33956 | 7.2% | 2.8%(+4.42)#40 | 1.9%(+5.32)#691 |
| 41. | 32322 | 7.2% | 2.8%(+4.41)#41 | 1.9%(+5.31)#693 |
| 42. | 33496 | 7.2% | 2.8%(+4.36)#42 | 1.9%(+5.27)#698 |
| 43. | 32435 | 7.2% | 2.8%(+4.35)#43 | 1.9%(+5.26)#700 |
| 44. | 33140 | 7.1% | 2.8%(+4.35)#44 | 1.9%(+5.26)#701 |
| 45. | 32951 | 7.0% | 2.8%(+4.24)#45 | 1.9%(+5.14)#725 |
| 46. | 32789 | 7.0% | 2.8%(+4.17)#46 | 1.9%(+5.07)#736 |
| 47. | 34114 | 7.0% | 2.8%(+4.16)#47 | 1.9%(+5.06)#738 |
| 48. | 33138 | 6.9% | 2.8%(+4.15)#48 | 1.9%(+5.05)#739 |
| 49. | 33301 | 6.8% | 2.8%(+4.02)#49 | 1.9%(+4.92)#764 |
| 50. | 33181 | 6.8% | 2.8%(+3.96)#50 | 1.9%(+4.87)#774 |
| 51. | 33036 | 6.7% | 2.8%(+3.91)#51 | 1.9%(+4.81)#787 |
| 52. | 33040 | 6.6% | 2.8%(+3.84)#52 | 1.9%(+4.74)#797 |
| 53. | 32439 | 6.5% | 2.8%(+3.72)#53 | 1.9%(+4.63)#816 |
| 54. | 34739 | 6.5% | 2.8%(+3.72)#54 | 1.9%(+4.63)#818 |
| 55. | 32461 | 6.5% | 2.8%(+3.71)#55 | 1.9%(+4.62)#819 |
| 56. | 33308 | 6.5% | 2.8%(+3.70)#56 | 1.9%(+4.60)#825 |
| 57. | 33928 | 6.5% | 2.8%(+3.66)#57 | 1.9%(+4.57)#832 |
| 58. | 33146 | 6.4% | 2.8%(+3.65)#58 | 1.9%(+4.56)#838 |
| 59. | 33062 | 6.4% | 2.8%(+3.65)#59 | 1.9%(+4.55)#840 |
| 60. | 32732 | 6.4% | 2.8%(+3.61)#60 | 1.9%(+4.52)#847 |
| 61. | 32080 | 6.4% | 2.8%(+3.61)#61 | 1.9%(+4.51)#849 |
| 62. | 33160 | 6.4% | 2.8%(+3.60)#62 | 1.9%(+4.51)#851 |
| 63. | 34119 | 6.4% | 2.8%(+3.58)#63 | 1.9%(+4.49)#859 |
| 64. | 34108 | 6.3% | 2.8%(+3.54)#64 | 1.9%(+4.44)#873 |
| 65. | 33606 | 6.3% | 2.8%(+3.53)#65 | 1.9%(+4.43)#878 |
| 66. | 32320 | 6.2% | 2.8%(+3.44)#66 | 1.9%(+4.35)#907 |
| 67. | 34242 | 6.2% | 2.8%(+3.43)#67 | 1.9%(+4.34)#911 |
| 68. | 34223 | 6.1% | 2.8%(+3.33)#68 | 1.9%(+4.24)#937 |
| 69. | 33946 | 6.1% | 2.8%(+3.26)#69 | 1.9%(+4.17)#955 |
| 70. | 33483 | 6.0% | 2.8%(+3.23)#70 | 1.9%(+4.13)#966 |
| 71. | 33707 | 5.9% | 2.8%(+3.15)#71 | 1.9%(+4.05)#997 |
| 72. | 34201 | 5.9% | 2.8%(+3.14)#72 | 1.9%(+4.04)#1,001 |
| 73. | 34102 | 5.9% | 2.8%(+3.12)#73 | 1.9%(+4.03)#1,005 |
| 74. | 32408 | 5.9% | 2.8%(+3.11)#74 | 1.9%(+4.02)#1,009 |
| 75. | 32131 | 5.9% | 2.8%(+3.09)#75 | 1.9%(+3.99)#1,014 |
| 76. | 32804 | 5.9% | 2.8%(+3.07)#76 | 1.9%(+3.97)#1,025 |
| 77. | 32266 | 5.9% | 2.8%(+3.07)#77 | 1.9%(+3.97)#1,026 |
| 78. | 33139 | 5.9% | 2.8%(+3.06)#78 | 1.9%(+3.97)#1,029 |
| 79. | 33316 | 5.9% | 2.8%(+3.06)#79 | 1.9%(+3.97)#1,030 |
| 80. | 33786 | 5.9% | 2.8%(+3.06)#80 | 1.9%(+3.96)#1,031 |
| 81. | 33326 | 5.8% | 2.8%(+3.01)#81 | 1.9%(+3.92)#1,040 |
| 82. | 34216 | 5.8% | 2.8%(+2.96)#82 | 1.9%(+3.87)#1,054 |
| 83. | 33141 | 5.7% | 2.8%(+2.92)#83 | 1.9%(+3.82)#1,071 |
| 84. | 33323 | 5.7% | 2.8%(+2.86)#84 | 1.9%(+3.76)#1,095 |
| 85. | 33908 | 5.6% | 2.8%(+2.84)#85 | 1.9%(+3.75)#1,102 |
| 86. | 34235 | 5.6% | 2.8%(+2.83)#86 | 1.9%(+3.74)#1,106 |
| 87. | 33332 | 5.6% | 2.8%(+2.79)#87 | 1.9%(+3.70)#1,117 |
| 88. | 33154 | 5.6% | 2.8%(+2.76)#88 | 1.9%(+3.67)#1,128 |
| 89. | 33042 | 5.5% | 2.8%(+2.75)#89 | 1.9%(+3.65)#1,135 |
| 90. | 32190 | 5.5% | 2.8%(+2.72)#90 | 1.9%(+3.62)#1,139 |
| 91. | 33306 | 5.5% | 2.8%(+2.65)#91 | 1.9%(+3.56)#1,173 |
| 92. | 32328 | 5.4% | 2.8%(+2.64)#92 | 1.9%(+3.54)#1,181 |
| 93. | 33304 | 5.4% | 2.8%(+2.63)#93 | 1.9%(+3.54)#1,187 |
| 94. | 32836 | 5.4% | 2.8%(+2.58)#94 | 1.9%(+3.49)#1,207 |
| 95. | 33327 | 5.3% | 2.8%(+2.55)#95 | 1.9%(+3.45)#1,220 |
| 96. | 33143 | 5.3% | 2.8%(+2.52)#96 | 1.9%(+3.43)#1,236 |
| 97. | 34471 | 5.3% | 2.8%(+2.51)#97 | 1.9%(+3.42)#1,241 |
| 98. | 33774 | 5.3% | 2.8%(+2.50)#98 | 1.9%(+3.40)#1,251 |
| 99. | 32407 | 5.3% | 2.8%(+2.49)#99 | 1.9%(+3.40)#1,253 |
| 100. | 32038 | 5.2% | 2.8%(+2.44)#100 | 1.9%(+3.34)#1,274 |
Common Questions
What are the Top 10 Zip Codes with the Highest Percentage of Population Employed in Real Estate, Rental & Leasing in Florida?
Top 10 Zip Codes with the Highest Percentage of Population Employed in Real Estate, Rental & Leasing in Florida are:
What zip code has the Highest Percentage of Population Employed in Real Estate, Rental & Leasing in Florida?
34215 has the Highest Percentage of Population Employed in Real Estate, Rental & Leasing in Florida with 30.3%.
What is the Percentage of Population Employed in Real Estate, Rental & Leasing in the State of Florida?
Percentage of Population Employed in Real Estate, Rental & Leasing in Florida is 2.8%.
What is the Percentage of Population Employed in Real Estate, Rental & Leasing in the United States?
Percentage of Population Employed in Real Estate, Rental & Leasing in the United States is 1.9%.