Zip Codes with the Highest Percentage of Population with a Degree in Psychology in Florida
RELATED REPORTS & OPTIONS
Psychology
Florida
Compare Zip Codes
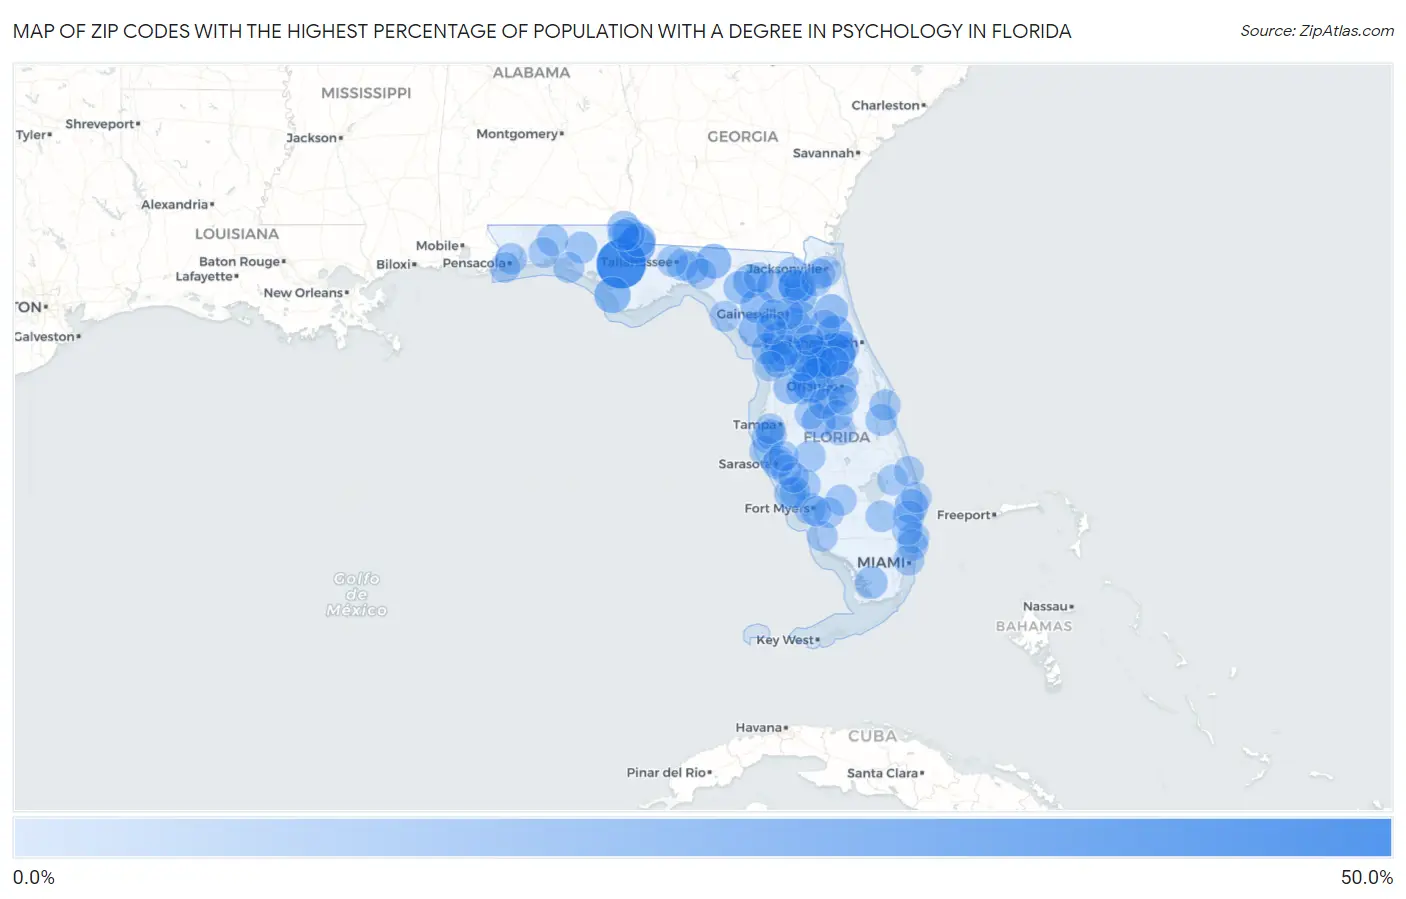
Map of Zip Codes with the Highest Percentage of Population with a Degree in Psychology in Florida
0.0%
50.0%
Zip Codes with the Highest Percentage of Population with a Degree in Psychology in Florida
| Zip Code | % Graduates | vs State | vs National | |
| 1. | 32430 | 41.0% | 5.0%(+36.0)#1 | 5.1%(+35.9)#169 |
| 2. | 32767 | 30.0% | 5.0%(+25.0)#2 | 5.1%(+24.9)#296 |
| 3. | 32133 | 28.0% | 5.0%(+23.0)#3 | 5.1%(+22.9)#338 |
| 4. | 34753 | 24.4% | 5.0%(+19.4)#4 | 5.1%(+19.3)#446 |
| 5. | 32442 | 20.9% | 5.0%(+15.9)#5 | 5.1%(+15.8)#606 |
| 6. | 32410 | 18.0% | 5.0%(+13.0)#6 | 5.1%(+12.9)#800 |
| 7. | 32190 | 17.8% | 5.0%(+12.8)#7 | 5.1%(+12.8)#817 |
| 8. | 32664 | 17.2% | 5.0%(+12.2)#8 | 5.1%(+12.2)#876 |
| 9. | 32626 | 16.2% | 5.0%(+11.2)#9 | 5.1%(+11.2)#987 |
| 10. | 32026 | 15.7% | 5.0%(+10.7)#10 | 5.1%(+10.7)#1,041 |
| 11. | 32331 | 15.7% | 5.0%(+10.7)#11 | 5.1%(+10.6)#1,046 |
| 12. | 32619 | 14.6% | 5.0%(+9.62)#12 | 5.1%(+9.57)#1,183 |
| 13. | 32668 | 14.5% | 5.0%(+9.52)#13 | 5.1%(+9.47)#1,197 |
| 14. | 33413 | 14.1% | 5.0%(+9.07)#14 | 5.1%(+9.01)#1,274 |
| 15. | 32131 | 14.1% | 5.0%(+9.05)#15 | 5.1%(+9.00)#1,275 |
| 16. | 32460 | 13.9% | 5.0%(+8.89)#16 | 5.1%(+8.84)#1,291 |
| 17. | 32091 | 13.8% | 5.0%(+8.83)#17 | 5.1%(+8.78)#1,308 |
| 18. | 32062 | 13.7% | 5.0%(+8.71)#18 | 5.1%(+8.66)#1,331 |
| 19. | 32025 | 13.7% | 5.0%(+8.70)#19 | 5.1%(+8.65)#1,332 |
| 20. | 33880 | 13.6% | 5.0%(+8.64)#20 | 5.1%(+8.59)#1,341 |
| 21. | 34602 | 12.8% | 5.0%(+7.85)#21 | 5.1%(+7.80)#1,508 |
| 22. | 32445 | 12.6% | 5.0%(+7.61)#22 | 5.1%(+7.56)#1,564 |
| 23. | 32066 | 12.4% | 5.0%(+7.44)#23 | 5.1%(+7.39)#1,617 |
| 24. | 32443 | 12.4% | 5.0%(+7.43)#24 | 5.1%(+7.38)#1,622 |
| 25. | 32130 | 12.3% | 5.0%(+7.28)#25 | 5.1%(+7.23)#1,653 |
| 26. | 32179 | 12.1% | 5.0%(+7.10)#26 | 5.1%(+7.04)#1,701 |
| 27. | 32701 | 12.0% | 5.0%(+7.00)#27 | 5.1%(+6.95)#1,722 |
| 28. | 34465 | 12.0% | 5.0%(+6.98)#28 | 5.1%(+6.93)#1,735 |
| 29. | 33034 | 11.9% | 5.0%(+6.93)#29 | 5.1%(+6.88)#1,749 |
| 30. | 32735 | 11.5% | 5.0%(+6.55)#30 | 5.1%(+6.50)#1,869 |
| 31. | 32361 | 11.1% | 5.0%(+6.11)#31 | 5.1%(+6.06)#2,027 |
| 32. | 32058 | 10.9% | 5.0%(+5.91)#32 | 5.1%(+5.86)#2,092 |
| 33. | 32640 | 10.8% | 5.0%(+5.81)#33 | 5.1%(+5.76)#2,129 |
| 34. | 34433 | 10.7% | 5.0%(+5.72)#34 | 5.1%(+5.67)#2,165 |
| 35. | 34449 | 10.4% | 5.0%(+5.44)#35 | 5.1%(+5.38)#2,281 |
| 36. | 32455 | 10.4% | 5.0%(+5.40)#36 | 5.1%(+5.35)#2,293 |
| 37. | 33711 | 10.3% | 5.0%(+5.33)#37 | 5.1%(+5.28)#2,323 |
| 38. | 32446 | 10.3% | 5.0%(+5.29)#38 | 5.1%(+5.24)#2,346 |
| 39. | 33946 | 10.3% | 5.0%(+5.28)#39 | 5.1%(+5.23)#2,353 |
| 40. | 32539 | 10.2% | 5.0%(+5.24)#40 | 5.1%(+5.19)#2,367 |
| 41. | 32907 | 10.1% | 5.0%(+5.13)#41 | 5.1%(+5.08)#2,426 |
| 42. | 33990 | 10.1% | 5.0%(+5.09)#42 | 5.1%(+5.03)#2,451 |
| 43. | 32601 | 9.9% | 5.0%(+4.95)#43 | 5.1%(+4.90)#2,525 |
| 44. | 32504 | 9.9% | 5.0%(+4.90)#44 | 5.1%(+4.85)#2,556 |
| 45. | 34797 | 9.9% | 5.0%(+4.88)#45 | 5.1%(+4.83)#2,566 |
| 46. | 32311 | 9.8% | 5.0%(+4.82)#46 | 5.1%(+4.77)#2,588 |
| 47. | 33865 | 9.8% | 5.0%(+4.81)#47 | 5.1%(+4.75)#2,602 |
| 48. | 33473 | 9.8% | 5.0%(+4.78)#48 | 5.1%(+4.72)#2,619 |
| 49. | 33493 | 9.7% | 5.0%(+4.68)#49 | 5.1%(+4.63)#2,675 |
| 50. | 33983 | 9.7% | 5.0%(+4.66)#50 | 5.1%(+4.60)#2,690 |
| 51. | 32040 | 9.6% | 5.0%(+4.63)#51 | 5.1%(+4.58)#2,706 |
| 52. | 32304 | 9.5% | 5.0%(+4.53)#52 | 5.1%(+4.48)#2,761 |
| 53. | 33981 | 9.5% | 5.0%(+4.53)#53 | 5.1%(+4.47)#2,764 |
| 54. | 32083 | 9.5% | 5.0%(+4.50)#54 | 5.1%(+4.45)#2,778 |
| 55. | 33306 | 9.4% | 5.0%(+4.42)#55 | 5.1%(+4.37)#2,834 |
| 56. | 32669 | 9.4% | 5.0%(+4.42)#56 | 5.1%(+4.37)#2,835 |
| 57. | 32736 | 9.4% | 5.0%(+4.37)#57 | 5.1%(+4.32)#2,860 |
| 58. | 33004 | 9.3% | 5.0%(+4.35)#58 | 5.1%(+4.29)#2,870 |
| 59. | 32925 | 9.3% | 5.0%(+4.30)#59 | 5.1%(+4.25)#2,905 |
| 60. | 34216 | 9.3% | 5.0%(+4.27)#60 | 5.1%(+4.22)#2,935 |
| 61. | 33597 | 9.2% | 5.0%(+4.22)#61 | 5.1%(+4.16)#2,980 |
| 62. | 34785 | 9.1% | 5.0%(+4.15)#62 | 5.1%(+4.10)#3,015 |
| 63. | 33935 | 9.0% | 5.0%(+4.04)#63 | 5.1%(+3.99)#3,104 |
| 64. | 34432 | 9.0% | 5.0%(+4.02)#64 | 5.1%(+3.97)#3,116 |
| 65. | 32459 | 9.0% | 5.0%(+4.00)#65 | 5.1%(+3.95)#3,129 |
| 66. | 33127 | 9.0% | 5.0%(+4.00)#66 | 5.1%(+3.95)#3,135 |
| 67. | 34434 | 9.0% | 5.0%(+3.98)#67 | 5.1%(+3.93)#3,152 |
| 68. | 33701 | 9.0% | 5.0%(+3.97)#68 | 5.1%(+3.92)#3,162 |
| 69. | 34747 | 8.8% | 5.0%(+3.78)#69 | 5.1%(+3.73)#3,317 |
| 70. | 34956 | 8.8% | 5.0%(+3.76)#70 | 5.1%(+3.71)#3,336 |
| 71. | 32193 | 8.7% | 5.0%(+3.75)#71 | 5.1%(+3.70)#3,342 |
| 72. | 33854 | 8.7% | 5.0%(+3.74)#72 | 5.1%(+3.69)#3,360 |
| 73. | 33067 | 8.7% | 5.0%(+3.74)#73 | 5.1%(+3.69)#3,362 |
| 74. | 33805 | 8.7% | 5.0%(+3.73)#74 | 5.1%(+3.68)#3,370 |
| 75. | 32359 | 8.7% | 5.0%(+3.73)#75 | 5.1%(+3.67)#3,377 |
| 76. | 32621 | 8.7% | 5.0%(+3.66)#76 | 5.1%(+3.60)#3,454 |
| 77. | 34235 | 8.6% | 5.0%(+3.63)#77 | 5.1%(+3.57)#3,485 |
| 78. | 33897 | 8.6% | 5.0%(+3.60)#78 | 5.1%(+3.54)#3,513 |
| 79. | 33974 | 8.6% | 5.0%(+3.57)#79 | 5.1%(+3.52)#3,535 |
| 80. | 32336 | 8.6% | 5.0%(+3.57)#80 | 5.1%(+3.52)#3,539 |
| 81. | 32542 | 8.6% | 5.0%(+3.57)#81 | 5.1%(+3.52)#3,547 |
| 82. | 34237 | 8.5% | 5.0%(+3.54)#82 | 5.1%(+3.49)#3,569 |
| 83. | 34241 | 8.4% | 5.0%(+3.45)#83 | 5.1%(+3.39)#3,661 |
| 84. | 33403 | 8.4% | 5.0%(+3.43)#84 | 5.1%(+3.38)#3,683 |
| 85. | 32207 | 8.4% | 5.0%(+3.38)#85 | 5.1%(+3.33)#3,726 |
| 86. | 33716 | 8.4% | 5.0%(+3.37)#86 | 5.1%(+3.32)#3,737 |
| 87. | 34291 | 8.4% | 5.0%(+3.36)#87 | 5.1%(+3.31)#3,741 |
| 88. | 32508 | 8.3% | 5.0%(+3.29)#88 | 5.1%(+3.24)#3,815 |
| 89. | 34116 | 8.2% | 5.0%(+3.25)#89 | 5.1%(+3.20)#3,854 |
| 90. | 32210 | 8.2% | 5.0%(+3.23)#90 | 5.1%(+3.18)#3,879 |
| 91. | 32065 | 8.2% | 5.0%(+3.15)#91 | 5.1%(+3.10)#3,962 |
| 92. | 33966 | 8.1% | 5.0%(+3.13)#92 | 5.1%(+3.08)#3,988 |
| 93. | 34211 | 8.1% | 5.0%(+3.10)#93 | 5.1%(+3.04)#4,024 |
| 94. | 32809 | 8.0% | 5.0%(+3.02)#94 | 5.1%(+2.97)#4,103 |
| 95. | 34759 | 8.0% | 5.0%(+3.01)#95 | 5.1%(+2.96)#4,121 |
| 96. | 34429 | 8.0% | 5.0%(+2.98)#96 | 5.1%(+2.93)#4,160 |
| 97. | 34743 | 7.9% | 5.0%(+2.90)#97 | 5.1%(+2.85)#4,259 |
| 98. | 34488 | 7.9% | 5.0%(+2.88)#98 | 5.1%(+2.83)#4,283 |
| 99. | 34996 | 7.8% | 5.0%(+2.85)#99 | 5.1%(+2.79)#4,318 |
| 100. | 32094 | 7.8% | 5.0%(+2.78)#100 | 5.1%(+2.72)#4,398 |
Common Questions
What are the Top 10 Zip Codes with the Highest Percentage of Population with a Degree in Psychology in Florida?
Top 10 Zip Codes with the Highest Percentage of Population with a Degree in Psychology in Florida are:
What zip code has the Highest Percentage of Population with a Degree in Psychology in Florida?
32430 has the Highest Percentage of Population with a Degree in Psychology in Florida with 41.0%.
What is the Percentage of Population with a Degree in Psychology in the State of Florida?
Percentage of Population with a Degree in Psychology in Florida is 5.0%.
What is the Percentage of Population with a Degree in Psychology in the United States?
Percentage of Population with a Degree in Psychology in the United States is 5.1%.