Zip Codes with the Largest Lithuanian Community in Florida
RELATED REPORTS & OPTIONS
Lithuanian
Florida
Compare Zip Codes
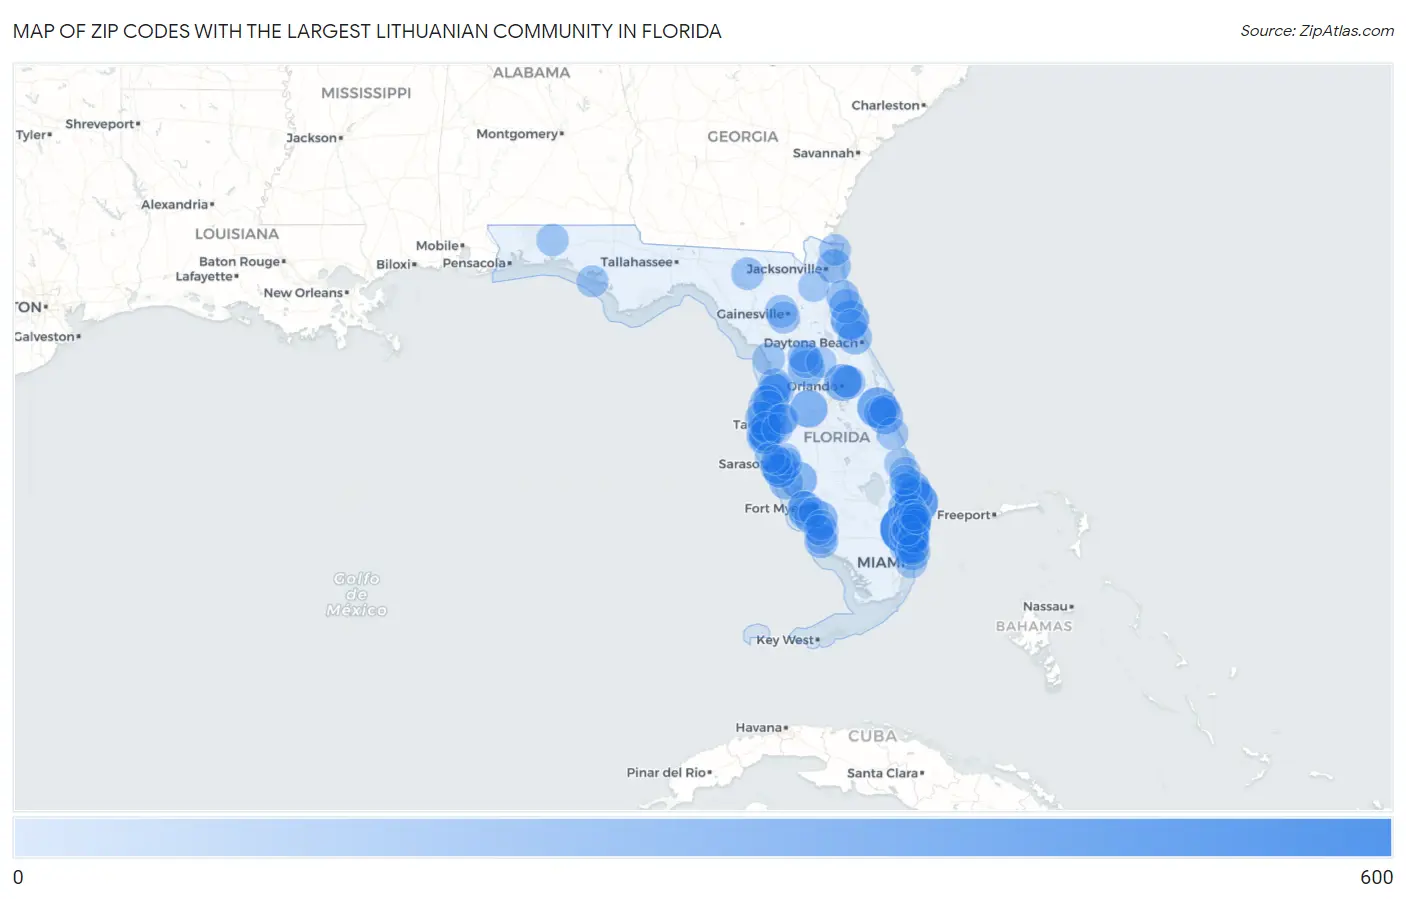
Map of Zip Codes with the Largest Lithuanian Community in Florida
0
600
Zip Codes with the Largest Lithuanian Community in Florida
| Zip Code | Lithuanian | vs State | vs National | |
| 1. | 33076 | 548 | 38,740(1.41%)#1 | 613,139(0.09%)#46 |
| 2. | 33401 | 406 | 38,740(1.05%)#2 | 613,139(0.07%)#106 |
| 3. | 32940 | 338 | 38,740(0.87%)#3 | 613,139(0.06%)#161 |
| 4. | 33496 | 318 | 38,740(0.82%)#4 | 613,139(0.05%)#186 |
| 5. | 32137 | 297 | 38,740(0.77%)#5 | 613,139(0.05%)#216 |
| 6. | 34233 | 284 | 38,740(0.73%)#6 | 613,139(0.05%)#246 |
| 7. | 33809 | 274 | 38,740(0.71%)#7 | 613,139(0.04%)#261 |
| 8. | 32789 | 259 | 38,740(0.67%)#8 | 613,139(0.04%)#296 |
| 9. | 32163 | 254 | 38,740(0.66%)#9 | 613,139(0.04%)#311 |
| 10. | 34286 | 252 | 38,740(0.65%)#10 | 613,139(0.04%)#312 |
| 11. | 33709 | 248 | 38,740(0.64%)#11 | 613,139(0.04%)#325 |
| 12. | 33410 | 245 | 38,740(0.63%)#12 | 613,139(0.04%)#332 |
| 13. | 32901 | 238 | 38,740(0.61%)#13 | 613,139(0.04%)#360 |
| 14. | 33458 | 237 | 38,740(0.61%)#14 | 613,139(0.04%)#361 |
| 15. | 34654 | 235 | 38,740(0.61%)#15 | 613,139(0.04%)#372 |
| 16. | 33414 | 231 | 38,740(0.60%)#16 | 613,139(0.04%)#382 |
| 17. | 33073 | 225 | 38,740(0.58%)#17 | 613,139(0.04%)#406 |
| 18. | 33965 | 225 | 38,740(0.58%)#18 | 613,139(0.04%)#407 |
| 19. | 33160 | 221 | 38,740(0.57%)#19 | 613,139(0.04%)#419 |
| 20. | 33991 | 220 | 38,740(0.57%)#20 | 613,139(0.04%)#426 |
| 21. | 32225 | 199 | 38,740(0.51%)#21 | 613,139(0.03%)#518 |
| 22. | 33467 | 195 | 38,740(0.50%)#22 | 613,139(0.03%)#547 |
| 23. | 32174 | 195 | 38,740(0.50%)#23 | 613,139(0.03%)#548 |
| 24. | 32086 | 195 | 38,740(0.50%)#24 | 613,139(0.03%)#551 |
| 25. | 34293 | 194 | 38,740(0.50%)#25 | 613,139(0.03%)#555 |
| 26. | 34112 | 194 | 38,740(0.50%)#26 | 613,139(0.03%)#556 |
| 27. | 32162 | 191 | 38,740(0.49%)#27 | 613,139(0.03%)#581 |
| 28. | 33706 | 191 | 38,740(0.49%)#28 | 613,139(0.03%)#588 |
| 29. | 34238 | 186 | 38,740(0.48%)#29 | 613,139(0.03%)#624 |
| 30. | 34609 | 184 | 38,740(0.47%)#30 | 613,139(0.03%)#634 |
| 31. | 32817 | 174 | 38,740(0.45%)#31 | 613,139(0.03%)#701 |
| 32. | 34613 | 174 | 38,740(0.45%)#32 | 613,139(0.03%)#703 |
| 33. | 34684 | 169 | 38,740(0.44%)#33 | 613,139(0.03%)#755 |
| 34. | 32934 | 169 | 38,740(0.44%)#34 | 613,139(0.03%)#758 |
| 35. | 32084 | 166 | 38,740(0.43%)#35 | 613,139(0.03%)#773 |
| 36. | 33702 | 166 | 38,740(0.43%)#36 | 613,139(0.03%)#774 |
| 37. | 32606 | 166 | 38,740(0.43%)#37 | 613,139(0.03%)#775 |
| 38. | 33434 | 166 | 38,740(0.43%)#38 | 613,139(0.03%)#776 |
| 39. | 32060 | 165 | 38,740(0.43%)#39 | 613,139(0.03%)#787 |
| 40. | 33024 | 164 | 38,740(0.42%)#40 | 613,139(0.03%)#790 |
| 41. | 34608 | 164 | 38,740(0.42%)#41 | 613,139(0.03%)#792 |
| 42. | 33707 | 163 | 38,740(0.42%)#42 | 613,139(0.03%)#805 |
| 43. | 33626 | 162 | 38,740(0.42%)#43 | 613,139(0.03%)#816 |
| 44. | 32539 | 159 | 38,740(0.41%)#44 | 613,139(0.03%)#843 |
| 45. | 34428 | 158 | 38,740(0.41%)#45 | 613,139(0.03%)#858 |
| 46. | 32608 | 157 | 38,740(0.41%)#46 | 613,139(0.03%)#863 |
| 47. | 33433 | 157 | 38,740(0.41%)#47 | 613,139(0.03%)#864 |
| 48. | 33069 | 157 | 38,740(0.41%)#48 | 613,139(0.03%)#867 |
| 49. | 32792 | 156 | 38,740(0.40%)#49 | 613,139(0.03%)#877 |
| 50. | 33764 | 156 | 38,740(0.40%)#50 | 613,139(0.03%)#882 |
| 51. | 33021 | 155 | 38,740(0.40%)#51 | 613,139(0.03%)#888 |
| 52. | 34668 | 152 | 38,740(0.39%)#52 | 613,139(0.02%)#919 |
| 53. | 34698 | 152 | 38,740(0.39%)#53 | 613,139(0.02%)#923 |
| 54. | 34240 | 152 | 38,740(0.39%)#54 | 613,139(0.02%)#927 |
| 55. | 33428 | 151 | 38,740(0.39%)#55 | 613,139(0.02%)#932 |
| 56. | 33437 | 150 | 38,740(0.39%)#56 | 613,139(0.02%)#936 |
| 57. | 34491 | 150 | 38,740(0.39%)#57 | 613,139(0.02%)#938 |
| 58. | 33710 | 148 | 38,740(0.38%)#58 | 613,139(0.02%)#962 |
| 59. | 34119 | 148 | 38,740(0.38%)#59 | 613,139(0.02%)#963 |
| 60. | 32408 | 148 | 38,740(0.38%)#60 | 613,139(0.02%)#967 |
| 61. | 32958 | 147 | 38,740(0.38%)#61 | 613,139(0.02%)#975 |
| 62. | 33312 | 146 | 38,740(0.38%)#62 | 613,139(0.02%)#983 |
| 63. | 33301 | 146 | 38,740(0.38%)#63 | 613,139(0.02%)#991 |
| 64. | 33914 | 145 | 38,740(0.37%)#64 | 613,139(0.02%)#1,000 |
| 65. | 32034 | 144 | 38,740(0.37%)#65 | 613,139(0.02%)#1,014 |
| 66. | 33487 | 144 | 38,740(0.37%)#66 | 613,139(0.02%)#1,020 |
| 67. | 33019 | 144 | 38,740(0.37%)#67 | 613,139(0.02%)#1,023 |
| 68. | 33305 | 143 | 38,740(0.37%)#68 | 613,139(0.02%)#1,031 |
| 69. | 34983 | 142 | 38,740(0.37%)#69 | 613,139(0.02%)#1,037 |
| 70. | 34655 | 142 | 38,740(0.37%)#70 | 613,139(0.02%)#1,038 |
| 71. | 33604 | 142 | 38,740(0.37%)#71 | 613,139(0.02%)#1,040 |
| 72. | 32164 | 141 | 38,740(0.36%)#72 | 613,139(0.02%)#1,049 |
| 73. | 33139 | 141 | 38,740(0.36%)#73 | 613,139(0.02%)#1,055 |
| 74. | 33908 | 138 | 38,740(0.36%)#74 | 613,139(0.02%)#1,101 |
| 75. | 33760 | 137 | 38,740(0.35%)#75 | 613,139(0.02%)#1,110 |
| 76. | 34994 | 137 | 38,740(0.35%)#76 | 613,139(0.02%)#1,112 |
| 77. | 33071 | 135 | 38,740(0.35%)#77 | 613,139(0.02%)#1,128 |
| 78. | 32068 | 134 | 38,740(0.35%)#78 | 613,139(0.02%)#1,139 |
| 79. | 34202 | 133 | 38,740(0.34%)#79 | 613,139(0.02%)#1,156 |
| 80. | 33484 | 132 | 38,740(0.34%)#80 | 613,139(0.02%)#1,169 |
| 81. | 33478 | 127 | 38,740(0.33%)#81 | 613,139(0.02%)#1,232 |
| 82. | 34104 | 125 | 38,740(0.32%)#82 | 613,139(0.02%)#1,248 |
| 83. | 33431 | 125 | 38,740(0.32%)#83 | 613,139(0.02%)#1,250 |
| 84. | 33611 | 124 | 38,740(0.32%)#84 | 613,139(0.02%)#1,258 |
| 85. | 32937 | 124 | 38,740(0.32%)#85 | 613,139(0.02%)#1,262 |
| 86. | 32735 | 123 | 38,740(0.32%)#86 | 613,139(0.02%)#1,291 |
| 87. | 33308 | 120 | 38,740(0.31%)#87 | 613,139(0.02%)#1,337 |
| 88. | 33617 | 119 | 38,740(0.31%)#88 | 613,139(0.02%)#1,350 |
| 89. | 33009 | 119 | 38,740(0.31%)#89 | 613,139(0.02%)#1,352 |
| 90. | 33993 | 119 | 38,740(0.31%)#90 | 613,139(0.02%)#1,358 |
| 91. | 33067 | 118 | 38,740(0.30%)#91 | 613,139(0.02%)#1,372 |
| 92. | 33436 | 117 | 38,740(0.30%)#92 | 613,139(0.02%)#1,384 |
| 93. | 34997 | 116 | 38,740(0.30%)#93 | 613,139(0.02%)#1,402 |
| 94. | 33907 | 116 | 38,740(0.30%)#94 | 613,139(0.02%)#1,410 |
| 95. | 34231 | 114 | 38,740(0.29%)#95 | 613,139(0.02%)#1,446 |
| 96. | 34210 | 114 | 38,740(0.29%)#96 | 613,139(0.02%)#1,452 |
| 97. | 34135 | 113 | 38,740(0.29%)#97 | 613,139(0.02%)#1,460 |
| 98. | 34110 | 113 | 38,740(0.29%)#98 | 613,139(0.02%)#1,468 |
| 99. | 33483 | 113 | 38,740(0.29%)#99 | 613,139(0.02%)#1,473 |
| 100. | 34243 | 112 | 38,740(0.29%)#100 | 613,139(0.02%)#1,484 |
Common Questions
What are the Top 10 Zip Codes with the Largest Lithuanian Community in Florida?
Top 10 Zip Codes with the Largest Lithuanian Community in Florida are:
What zip code has the Largest Lithuanian Community in Florida?
33076 has the Largest Lithuanian Community in Florida with 548.
What is the Total Lithuanian Population in the State of Florida?
Total Lithuanian Population in Florida is 38,740.
What is the Total Lithuanian Population in the United States?
Total Lithuanian Population in the United States is 613,139.