Zip Codes with the Highest Percentage of Households Without a Vehicle in Florida
RELATED REPORTS & OPTIONS
Households without a Cars
Florida
Compare Zip Codes
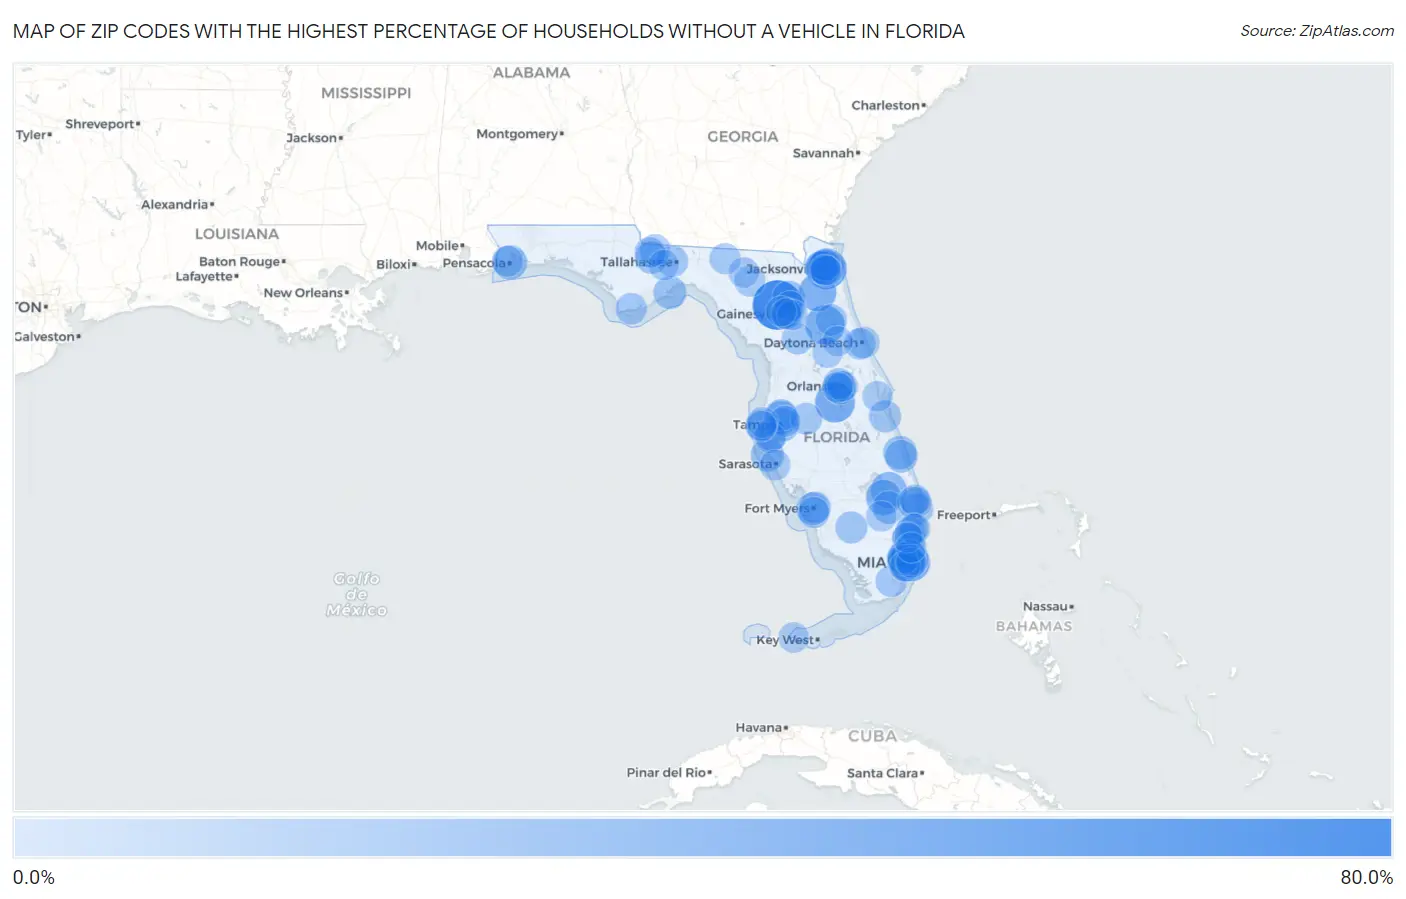
Map of Zip Codes with the Highest Percentage of Households Without a Vehicle in Florida
0.0%
80.0%
Zip Codes with the Highest Percentage of Households Without a Vehicle in Florida
| Zip Code | Housholds Without a Car | vs State | vs National | |
| 1. | 32616 | 67.6% | 6.0%(+61.6)#1 | 8.3%(+59.3)#211 |
| 2. | 32202 | 41.2% | 6.0%(+35.2)#2 | 8.3%(+32.9)#491 |
| 3. | 33848 | 38.5% | 6.0%(+32.5)#3 | 8.3%(+30.2)#549 |
| 4. | 32193 | 37.0% | 6.0%(+31.0)#4 | 8.3%(+28.7)#592 |
| 5. | 33128 | 35.9% | 6.0%(+29.9)#5 | 8.3%(+27.6)#616 |
| 6. | 33139 | 32.5% | 6.0%(+26.5)#6 | 8.3%(+24.2)#710 |
| 7. | 32079 | 32.2% | 6.0%(+26.2)#7 | 8.3%(+23.9)#723 |
| 8. | 33136 | 28.8% | 6.0%(+22.8)#8 | 8.3%(+20.5)#856 |
| 9. | 33438 | 27.0% | 6.0%(+21.0)#9 | 8.3%(+18.7)#942 |
| 10. | 32206 | 26.2% | 6.0%(+20.2)#10 | 8.3%(+17.9)#984 |
| 11. | 33476 | 25.8% | 6.0%(+19.8)#11 | 8.3%(+17.5)#1,018 |
| 12. | 33135 | 24.3% | 6.0%(+18.3)#12 | 8.3%(+16.0)#1,110 |
| 13. | 33130 | 24.2% | 6.0%(+18.2)#13 | 8.3%(+15.9)#1,117 |
| 14. | 33127 | 23.1% | 6.0%(+17.1)#14 | 8.3%(+14.8)#1,204 |
| 15. | 33150 | 22.9% | 6.0%(+16.9)#15 | 8.3%(+14.6)#1,221 |
| 16. | 32501 | 22.3% | 6.0%(+16.3)#16 | 8.3%(+14.0)#1,276 |
| 17. | 32209 | 21.3% | 6.0%(+15.3)#17 | 8.3%(+13.0)#1,353 |
| 18. | 33125 | 21.0% | 6.0%(+15.0)#18 | 8.3%(+12.7)#1,393 |
| 19. | 34946 | 19.5% | 6.0%(+13.5)#19 | 8.3%(+11.2)#1,570 |
| 20. | 33142 | 19.3% | 6.0%(+13.3)#20 | 8.3%(+11.0)#1,591 |
| 21. | 34215 | 19.3% | 6.0%(+13.3)#21 | 8.3%(+11.0)#1,599 |
| 22. | 33612 | 19.2% | 6.0%(+13.2)#22 | 8.3%(+10.9)#1,604 |
| 23. | 32622 | 18.9% | 6.0%(+12.9)#23 | 8.3%(+10.6)#1,651 |
| 24. | 33605 | 18.7% | 6.0%(+12.7)#24 | 8.3%(+10.4)#1,682 |
| 25. | 32346 | 18.4% | 6.0%(+12.4)#25 | 8.3%(+10.1)#1,729 |
| 26. | 34950 | 17.8% | 6.0%(+11.8)#26 | 8.3%(+9.50)#1,816 |
| 27. | 33901 | 17.5% | 6.0%(+11.5)#27 | 8.3%(+9.20)#1,859 |
| 28. | 33430 | 17.2% | 6.0%(+11.2)#28 | 8.3%(+8.90)#1,915 |
| 29. | 32254 | 17.2% | 6.0%(+11.2)#29 | 8.3%(+8.90)#1,918 |
| 30. | 33141 | 16.8% | 6.0%(+10.8)#30 | 8.3%(+8.50)#1,991 |
| 31. | 32351 | 16.8% | 6.0%(+10.8)#31 | 8.3%(+8.50)#1,993 |
| 32. | 32901 | 16.2% | 6.0%(+10.2)#32 | 8.3%(+7.90)#2,104 |
| 33. | 34142 | 15.7% | 6.0%(+9.70)#33 | 8.3%(+7.40)#2,213 |
| 34. | 33010 | 15.5% | 6.0%(+9.50)#34 | 8.3%(+7.20)#2,249 |
| 35. | 33167 | 15.1% | 6.0%(+9.10)#35 | 8.3%(+6.80)#2,357 |
| 36. | 33701 | 15.1% | 6.0%(+9.10)#36 | 8.3%(+6.80)#2,358 |
| 37. | 33916 | 15.0% | 6.0%(+9.00)#37 | 8.3%(+6.70)#2,385 |
| 38. | 33138 | 14.9% | 6.0%(+8.90)#38 | 8.3%(+6.60)#2,408 |
| 39. | 32601 | 14.6% | 6.0%(+8.60)#39 | 8.3%(+6.30)#2,499 |
| 40. | 33613 | 14.4% | 6.0%(+8.40)#40 | 8.3%(+6.10)#2,544 |
| 41. | 33815 | 14.4% | 6.0%(+8.40)#41 | 8.3%(+6.10)#2,555 |
| 42. | 32118 | 14.2% | 6.0%(+8.20)#42 | 8.3%(+5.90)#2,631 |
| 43. | 32805 | 14.1% | 6.0%(+8.10)#43 | 8.3%(+5.80)#2,667 |
| 44. | 33460 | 14.0% | 6.0%(+8.00)#44 | 8.3%(+5.70)#2,693 |
| 45. | 32114 | 13.9% | 6.0%(+7.90)#45 | 8.3%(+5.60)#2,722 |
| 46. | 32208 | 13.9% | 6.0%(+7.90)#46 | 8.3%(+5.60)#2,724 |
| 47. | 32320 | 13.9% | 6.0%(+7.90)#47 | 8.3%(+5.60)#2,743 |
| 48. | 32304 | 13.8% | 6.0%(+7.80)#48 | 8.3%(+5.50)#2,763 |
| 49. | 33030 | 13.7% | 6.0%(+7.70)#49 | 8.3%(+5.40)#2,804 |
| 50. | 33313 | 13.6% | 6.0%(+7.60)#50 | 8.3%(+5.30)#2,837 |
| 51. | 32332 | 13.6% | 6.0%(+7.60)#51 | 8.3%(+5.30)#2,861 |
| 52. | 34475 | 13.5% | 6.0%(+7.50)#52 | 8.3%(+5.20)#2,884 |
| 53. | 32187 | 13.5% | 6.0%(+7.50)#53 | 8.3%(+5.20)#2,900 |
| 54. | 32839 | 13.4% | 6.0%(+7.40)#54 | 8.3%(+5.10)#2,913 |
| 55. | 33054 | 13.4% | 6.0%(+7.40)#55 | 8.3%(+5.10)#2,918 |
| 56. | 33907 | 13.1% | 6.0%(+7.10)#56 | 8.3%(+4.80)#3,051 |
| 57. | 32340 | 13.0% | 6.0%(+7.00)#57 | 8.3%(+4.70)#3,098 |
| 58. | 33140 | 12.9% | 6.0%(+6.90)#58 | 8.3%(+4.60)#3,142 |
| 59. | 33012 | 12.8% | 6.0%(+6.80)#59 | 8.3%(+4.50)#3,170 |
| 60. | 33417 | 12.6% | 6.0%(+6.60)#60 | 8.3%(+4.30)#3,266 |
| 61. | 32207 | 12.6% | 6.0%(+6.60)#61 | 8.3%(+4.30)#3,267 |
| 62. | 32808 | 12.5% | 6.0%(+6.50)#62 | 8.3%(+4.20)#3,309 |
| 63. | 33610 | 12.5% | 6.0%(+6.50)#63 | 8.3%(+4.20)#3,310 |
| 64. | 33401 | 12.2% | 6.0%(+6.20)#64 | 8.3%(+3.90)#3,454 |
| 65. | 33705 | 12.2% | 6.0%(+6.20)#65 | 8.3%(+3.90)#3,456 |
| 66. | 33311 | 12.1% | 6.0%(+6.10)#66 | 8.3%(+3.80)#3,493 |
| 67. | 33756 | 12.1% | 6.0%(+6.10)#67 | 8.3%(+3.80)#3,502 |
| 68. | 32505 | 12.1% | 6.0%(+6.10)#68 | 8.3%(+3.80)#3,503 |
| 69. | 33066 | 12.1% | 6.0%(+6.10)#69 | 8.3%(+3.80)#3,514 |
| 70. | 32062 | 12.1% | 6.0%(+6.10)#70 | 8.3%(+3.80)#3,535 |
| 71. | 33755 | 12.0% | 6.0%(+6.00)#71 | 8.3%(+3.70)#3,552 |
| 72. | 34236 | 12.0% | 6.0%(+6.00)#72 | 8.3%(+3.70)#3,561 |
| 73. | 32330 | 12.0% | 6.0%(+6.00)#73 | 8.3%(+3.70)#3,587 |
| 74. | 33407 | 11.9% | 6.0%(+5.90)#74 | 8.3%(+3.60)#3,606 |
| 75. | 33442 | 11.8% | 6.0%(+5.80)#75 | 8.3%(+3.50)#3,663 |
| 76. | 33770 | 11.8% | 6.0%(+5.80)#76 | 8.3%(+3.50)#3,665 |
| 77. | 32204 | 11.8% | 6.0%(+5.80)#77 | 8.3%(+3.50)#3,679 |
| 78. | 33131 | 11.6% | 6.0%(+5.60)#78 | 8.3%(+3.30)#3,766 |
| 79. | 33441 | 11.4% | 6.0%(+5.40)#79 | 8.3%(+3.10)#3,888 |
| 80. | 32064 | 11.4% | 6.0%(+5.40)#80 | 8.3%(+3.10)#3,900 |
| 81. | 33161 | 11.3% | 6.0%(+5.30)#81 | 8.3%(+3.00)#3,929 |
| 82. | 32310 | 11.3% | 6.0%(+5.30)#82 | 8.3%(+3.00)#3,954 |
| 83. | 33147 | 11.2% | 6.0%(+5.20)#83 | 8.3%(+2.90)#3,998 |
| 84. | 33040 | 11.2% | 6.0%(+5.20)#84 | 8.3%(+2.90)#4,004 |
| 85. | 33137 | 11.2% | 6.0%(+5.20)#85 | 8.3%(+2.90)#4,020 |
| 86. | 32609 | 11.2% | 6.0%(+5.20)#86 | 8.3%(+2.90)#4,021 |
| 87. | 32702 | 11.2% | 6.0%(+5.20)#87 | 8.3%(+2.90)#4,043 |
| 88. | 33122 | 11.2% | 6.0%(+5.20)#88 | 8.3%(+2.90)#4,047 |
| 89. | 33493 | 11.1% | 6.0%(+5.10)#89 | 8.3%(+2.80)#4,093 |
| 90. | 32641 | 11.0% | 6.0%(+5.00)#90 | 8.3%(+2.70)#4,136 |
| 91. | 32801 | 11.0% | 6.0%(+5.00)#91 | 8.3%(+2.70)#4,139 |
| 92. | 32603 | 11.0% | 6.0%(+5.00)#92 | 8.3%(+2.70)#4,147 |
| 93. | 32606 | 10.8% | 6.0%(+4.80)#93 | 8.3%(+2.50)#4,249 |
| 94. | 33146 | 10.8% | 6.0%(+4.80)#94 | 8.3%(+2.50)#4,258 |
| 95. | 32922 | 10.8% | 6.0%(+4.80)#95 | 8.3%(+2.50)#4,260 |
| 96. | 32811 | 10.7% | 6.0%(+4.70)#96 | 8.3%(+2.40)#4,302 |
| 97. | 33132 | 10.7% | 6.0%(+4.70)#97 | 8.3%(+2.40)#4,318 |
| 98. | 32180 | 10.7% | 6.0%(+4.70)#98 | 8.3%(+2.40)#4,342 |
| 99. | 33319 | 10.6% | 6.0%(+4.60)#99 | 8.3%(+2.30)#4,373 |
| 100. | 33020 | 10.6% | 6.0%(+4.60)#100 | 8.3%(+2.30)#4,376 |
Common Questions
What are the Top 10 Zip Codes with the Highest Percentage of Households Without a Vehicle in Florida?
Top 10 Zip Codes with the Highest Percentage of Households Without a Vehicle in Florida are:
What zip code has the Highest Percentage of Households Without a Vehicle in Florida?
32616 has the Highest Percentage of Households Without a Vehicle in Florida with 67.6%.
What is the Percentage of Households Without a Vehicle in the State of Florida?
Percentage of Households Without a Vehicle in Florida is 6.0%.
What is the Percentage of Households Without a Vehicle in the United States?
Percentage of Households Without a Vehicle in the United States is 8.3%.