Zip Codes with the Highest Percentage of Population with a Degree in Education in Florida
RELATED REPORTS & OPTIONS
Education
Florida
Compare Zip Codes
Map of Zip Codes with the Highest Percentage of Population with a Degree in Education in Florida
20.0%
100.0%
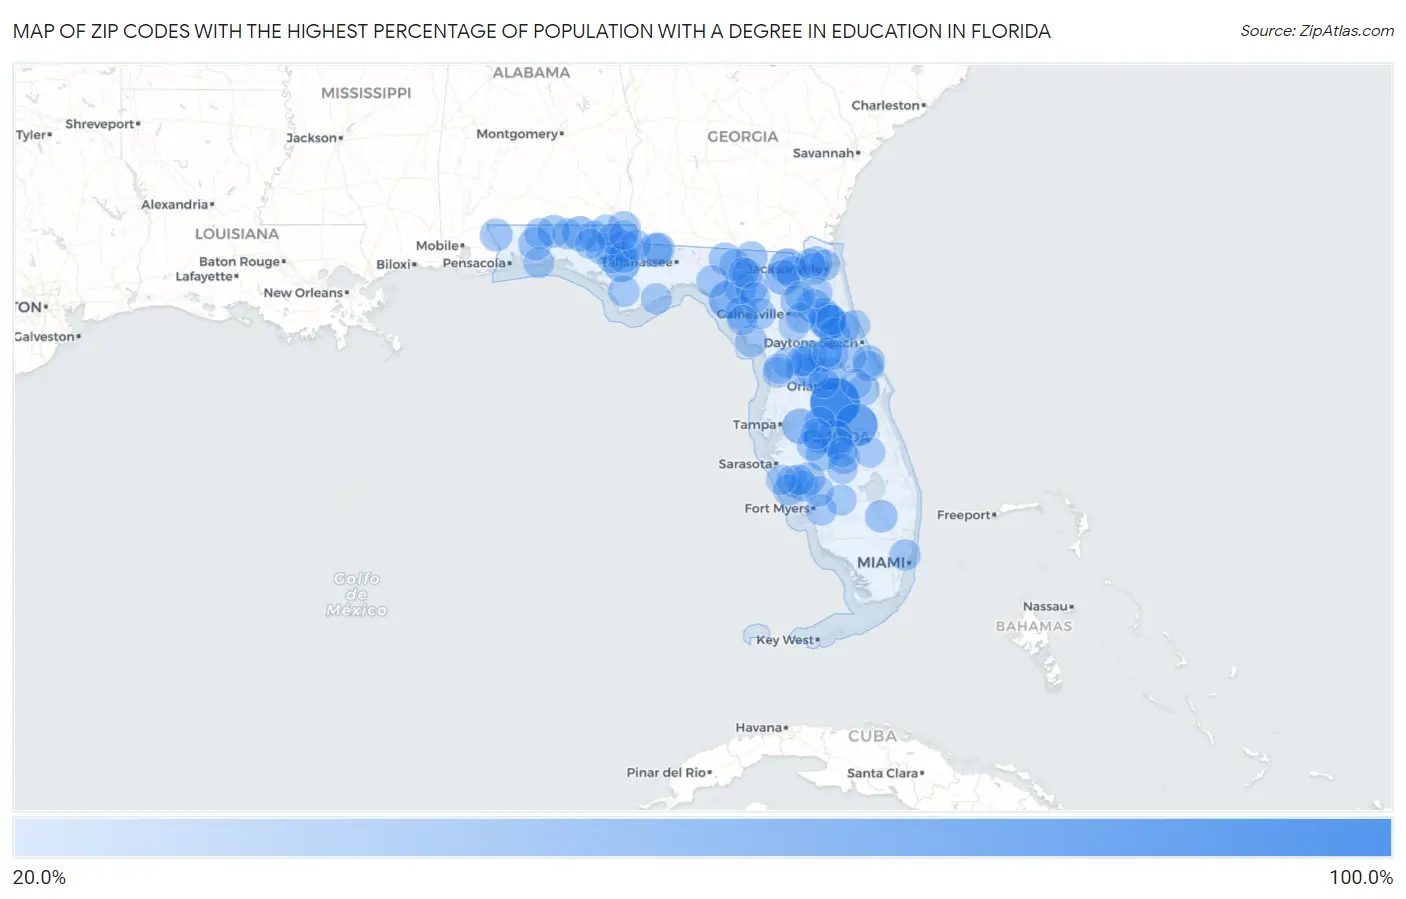
Zip Codes with the Highest Percentage of Population with a Degree in Education in Florida
| Zip Code | % Graduates | vs State | vs National | |
| 1. | 33848 | 100.0% | 12.1% (+87.9)#1 | 11.1% (+88.9)#58 |
| 2. | 34739 | 71.4% | 12.1% (+59.4)#2 | 11.1% (+60.4)#492 |
| 3. | 32189 | 50.3% | 12.1% (+38.3)#3 | 11.1% (+39.3)#1,130 |
| 4. | 32356 | 50.0% | 12.1% (+37.9)#4 | 11.1% (+38.9)#1,240 |
| 5. | 32430 | 46.7% | 12.1% (+34.6)#5 | 11.1% (+35.6)#1,413 |
| 6. | 32087 | 43.1% | 12.1% (+31.1)#6 | 11.1% (+32.1)#1,740 |
| 7. | 33843 | 42.3% | 12.1% (+30.2)#7 | 11.1% (+31.2)#1,833 |
| 8. | 33567 | 42.2% | 12.1% (+30.2)#8 | 11.1% (+31.2)#1,839 |
| 9. | 32464 | 40.9% | 12.1% (+28.8)#9 | 11.1% (+29.8)#2,030 |
| 10. | 32181 | 40.0% | 12.1% (+27.9)#10 | 11.1% (+28.9)#2,120 |
| 11. | 32072 | 40.0% | 12.1% (+27.9)#11 | 11.1% (+28.9)#2,181 |
| 12. | 32140 | 36.9% | 12.1% (+24.9)#12 | 11.1% (+25.9)#2,677 |
| 13. | 32332 | 36.4% | 12.1% (+24.4)#13 | 11.1% (+25.4)#2,749 |
| 14. | 33890 | 34.5% | 12.1% (+22.4)#14 | 11.1% (+23.4)#3,148 |
| 15. | 32066 | 34.1% | 12.1% (+22.0)#15 | 11.1% (+23.0)#3,246 |
| 16. | 32564 | 33.3% | 12.1% (+21.3)#16 | 11.1% (+22.3)#3,413 |
| 17. | 33521 | 31.8% | 12.1% (+19.8)#17 | 11.1% (+20.8)#3,889 |
| 18. | 32040 | 31.7% | 12.1% (+19.6)#18 | 11.1% (+20.6)#3,924 |
| 19. | 33841 | 31.6% | 12.1% (+19.6)#19 | 11.1% (+20.6)#3,930 |
| 20. | 32445 | 31.5% | 12.1% (+19.5)#20 | 11.1% (+20.5)#3,957 |
| 21. | 34269 | 31.4% | 12.1% (+19.4)#21 | 11.1% (+20.4)#3,997 |
| 22. | 32568 | 31.3% | 12.1% (+19.2)#22 | 11.1% (+20.2)#4,030 |
| 23. | 32567 | 31.1% | 12.1% (+19.1)#23 | 11.1% (+20.1)#4,080 |
| 24. | 32798 | 30.7% | 12.1% (+18.6)#24 | 11.1% (+19.6)#4,239 |
| 25. | 33493 | 30.6% | 12.1% (+18.6)#25 | 11.1% (+19.6)#4,241 |
| 26. | 33876 | 30.6% | 12.1% (+18.5)#26 | 11.1% (+19.5)#4,267 |
| 27. | 32448 | 30.3% | 12.1% (+18.3)#27 | 11.1% (+19.3)#4,353 |
| 28. | 32628 | 30.3% | 12.1% (+18.2)#28 | 11.1% (+19.2)#4,376 |
| 29. | 32071 | 30.3% | 12.1% (+18.2)#29 | 11.1% (+19.2)#4,380 |
| 30. | 32219 | 30.3% | 12.1% (+18.2)#30 | 11.1% (+19.2)#4,386 |
| 31. | 32340 | 30.1% | 12.1% (+18.1)#31 | 11.1% (+19.1)#4,427 |
| 32. | 32347 | 30.1% | 12.1% (+18.1)#32 | 11.1% (+19.0)#4,429 |
| 33. | 32625 | 30.0% | 12.1% (+17.9)#33 | 11.1% (+18.9)#4,461 |
| 34. | 32052 | 29.5% | 12.1% (+17.4)#34 | 11.1% (+18.4)#4,670 |
| 35. | 32141 | 29.5% | 12.1% (+17.4)#35 | 11.1% (+18.4)#4,676 |
| 36. | 32352 | 29.0% | 12.1% (+16.9)#36 | 11.1% (+17.9)#4,883 |
| 37. | 34748 | 28.8% | 12.1% (+16.7)#37 | 11.1% (+17.7)#4,974 |
| 38. | 32110 | 28.6% | 12.1% (+16.5)#38 | 11.1% (+17.5)#5,034 |
| 39. | 32177 | 28.0% | 12.1% (+15.9)#39 | 11.1% (+16.9)#5,312 |
| 40. | 32220 | 27.9% | 12.1% (+15.9)#40 | 11.1% (+16.9)#5,343 |
| 41. | 32044 | 27.9% | 12.1% (+15.8)#41 | 11.1% (+16.8)#5,361 |
| 42. | 32059 | 27.8% | 12.1% (+15.8)#42 | 11.1% (+16.8)#5,388 |
| 43. | 34287 | 27.8% | 12.1% (+15.7)#43 | 11.1% (+16.7)#5,420 |
| 44. | 33825 | 27.7% | 12.1% (+15.6)#44 | 11.1% (+16.6)#5,457 |
| 45. | 32438 | 27.7% | 12.1% (+15.6)#45 | 11.1% (+16.6)#5,458 |
| 46. | 32784 | 27.7% | 12.1% (+15.6)#46 | 11.1% (+16.6)#5,479 |
| 47. | 32190 | 27.3% | 12.1% (+15.2)#47 | 11.1% (+16.2)#5,643 |
| 48. | 32162 | 27.0% | 12.1% (+14.9)#48 | 11.1% (+15.9)#5,790 |
| 49. | 33834 | 27.0% | 12.1% (+14.9)#49 | 11.1% (+15.9)#5,798 |
| 50. | 32465 | 26.9% | 12.1% (+14.9)#50 | 11.1% (+15.9)#5,812 |
| 51. | 33839 | 26.7% | 12.1% (+14.7)#51 | 11.1% (+15.7)#5,927 |
| 52. | 32133 | 26.6% | 12.1% (+14.6)#52 | 11.1% (+15.6)#5,986 |
| 53. | 33054 | 26.4% | 12.1% (+14.3)#53 | 11.1% (+15.3)#6,101 |
| 54. | 32428 | 26.3% | 12.1% (+14.2)#54 | 11.1% (+15.2)#6,162 |
| 55. | 32421 | 26.3% | 12.1% (+14.2)#55 | 11.1% (+15.2)#6,163 |
| 56. | 32709 | 26.0% | 12.1% (+14.0)#56 | 11.1% (+15.0)#6,288 |
| 57. | 32531 | 26.0% | 12.1% (+14.0)#57 | 11.1% (+15.0)#6,301 |
| 58. | 32693 | 25.8% | 12.1% (+13.8)#58 | 11.1% (+14.8)#6,393 |
| 59. | 34224 | 25.6% | 12.1% (+13.6)#59 | 11.1% (+14.6)#6,513 |
| 60. | 32544 | 25.2% | 12.1% (+13.1)#60 | 11.1% (+14.1)#6,756 |
| 61. | 33980 | 25.2% | 12.1% (+13.1)#61 | 11.1% (+14.1)#6,757 |
| 62. | 32322 | 25.1% | 12.1% (+13.1)#62 | 11.1% (+14.1)#6,778 |
| 63. | 33847 | 25.0% | 12.1% (+12.9)#63 | 11.1% (+13.9)#6,889 |
| 64. | 34756 | 25.0% | 12.1% (+12.9)#64 | 11.1% (+13.9)#6,955 |
| 65. | 32759 | 24.9% | 12.1% (+12.8)#65 | 11.1% (+13.8)#6,981 |
| 66. | 33935 | 24.8% | 12.1% (+12.7)#66 | 11.1% (+13.7)#7,038 |
| 67. | 32433 | 24.8% | 12.1% (+12.7)#67 | 11.1% (+13.7)#7,061 |
| 68. | 32425 | 24.6% | 12.1% (+12.6)#68 | 11.1% (+13.6)#7,139 |
| 69. | 32440 | 24.6% | 12.1% (+12.6)#69 | 11.1% (+13.6)#7,145 |
| 70. | 33973 | 24.4% | 12.1% (+12.4)#70 | 11.1% (+13.4)#7,238 |
| 71. | 34453 | 24.1% | 12.1% (+12.0)#71 | 11.1% (+13.0)#7,476 |
| 72. | 32208 | 24.0% | 12.1% (+12.0)#72 | 11.1% (+13.0)#7,523 |
| 73. | 32431 | 24.0% | 12.1% (+11.9)#73 | 11.1% (+12.9)#7,566 |
| 74. | 32060 | 23.8% | 12.1% (+11.7)#74 | 11.1% (+12.7)#7,683 |
| 75. | 32064 | 23.7% | 12.1% (+11.6)#75 | 11.1% (+12.6)#7,743 |
| 76. | 34446 | 23.4% | 12.1% (+11.4)#76 | 11.1% (+12.4)#7,921 |
| 77. | 32008 | 23.4% | 12.1% (+11.4)#77 | 11.1% (+12.4)#7,923 |
| 78. | 32744 | 23.1% | 12.1% (+11.0)#78 | 11.1% (+12.0)#8,175 |
| 79. | 32442 | 23.1% | 12.1% (+11.0)#79 | 11.1% (+12.0)#8,180 |
| 80. | 33982 | 23.0% | 12.1% (+10.9)#80 | 11.1% (+11.9)#8,203 |
| 81. | 34484 | 22.9% | 12.1% (+10.8)#81 | 11.1% (+11.8)#8,304 |
| 82. | 34972 | 22.8% | 12.1% (+10.8)#82 | 11.1% (+11.8)#8,330 |
| 83. | 32680 | 22.8% | 12.1% (+10.7)#83 | 11.1% (+11.7)#8,372 |
| 84. | 32187 | 22.5% | 12.1% (+10.4)#84 | 11.1% (+11.4)#8,579 |
| 85. | 32009 | 22.5% | 12.1% (+10.4)#85 | 11.1% (+11.4)#8,583 |
| 86. | 34286 | 22.3% | 12.1% (+10.3)#86 | 11.1% (+11.3)#8,700 |
| 87. | 32136 | 22.2% | 12.1% (+10.1)#87 | 11.1% (+11.1)#8,818 |
| 88. | 34461 | 22.1% | 12.1% (+10.0)#88 | 11.1% (+11.0)#8,861 |
| 89. | 32640 | 22.0% | 12.1% (+9.97)#89 | 11.1% (+11.0)#8,908 |
| 90. | 34285 | 22.0% | 12.1% (+9.96)#90 | 11.1% (+11.0)#8,914 |
| 91. | 33852 | 22.0% | 12.1% (+9.95)#91 | 11.1% (+10.9)#8,923 |
| 92. | 32767 | 22.0% | 12.1% (+9.94)#92 | 11.1% (+10.9)#8,927 |
| 93. | 32427 | 22.0% | 12.1% (+9.92)#93 | 11.1% (+10.9)#8,946 |
| 94. | 32664 | 21.8% | 12.1% (+9.78)#94 | 11.1% (+10.8)#9,045 |
| 95. | 32079 | 21.8% | 12.1% (+9.77)#95 | 11.1% (+10.8)#9,054 |
| 96. | 32446 | 21.8% | 12.1% (+9.72)#96 | 11.1% (+10.7)#9,093 |
| 97. | 33870 | 21.7% | 12.1% (+9.67)#97 | 11.1% (+10.7)#9,130 |
| 98. | 32091 | 21.7% | 12.1% (+9.59)#98 | 11.1% (+10.6)#9,177 |
| 99. | 32702 | 21.6% | 12.1% (+9.59)#99 | 11.1% (+10.6)#9,182 |
| 100. | 32820 | 21.6% | 12.1% (+9.59)#100 | 11.1% (+10.6)#9,184 |
Common Questions
What are the Top 10 Zip Codes with the Highest Percentage of Population with a Degree in Education in Florida?
Top 10 Zip Codes with the Highest Percentage of Population with a Degree in Education in Florida are:
What zip code has the Highest Percentage of Population with a Degree in Education in Florida?
33848 has the Highest Percentage of Population with a Degree in Education in Florida with 100.0%.
What is the Percentage of Population with a Degree in Education in the State of Florida?
Percentage of Population with a Degree in Education in Florida is 12.1%.
What is the Percentage of Population with a Degree in Education in the United States?
Percentage of Population with a Degree in Education in the United States is 11.1%.