Seminole vs Immigrants from Australia GED/Equivalency
COMPARE
Seminole
Immigrants from Australia
GED/Equivalency
GED/Equivalency Comparison
Seminole
Immigrants from Australia
82.8%
GED/EQUIVALENCY
0.1/ 100
METRIC RATING
275th/ 347
METRIC RANK
88.6%
GED/EQUIVALENCY
99.8/ 100
METRIC RATING
26th/ 347
METRIC RANK
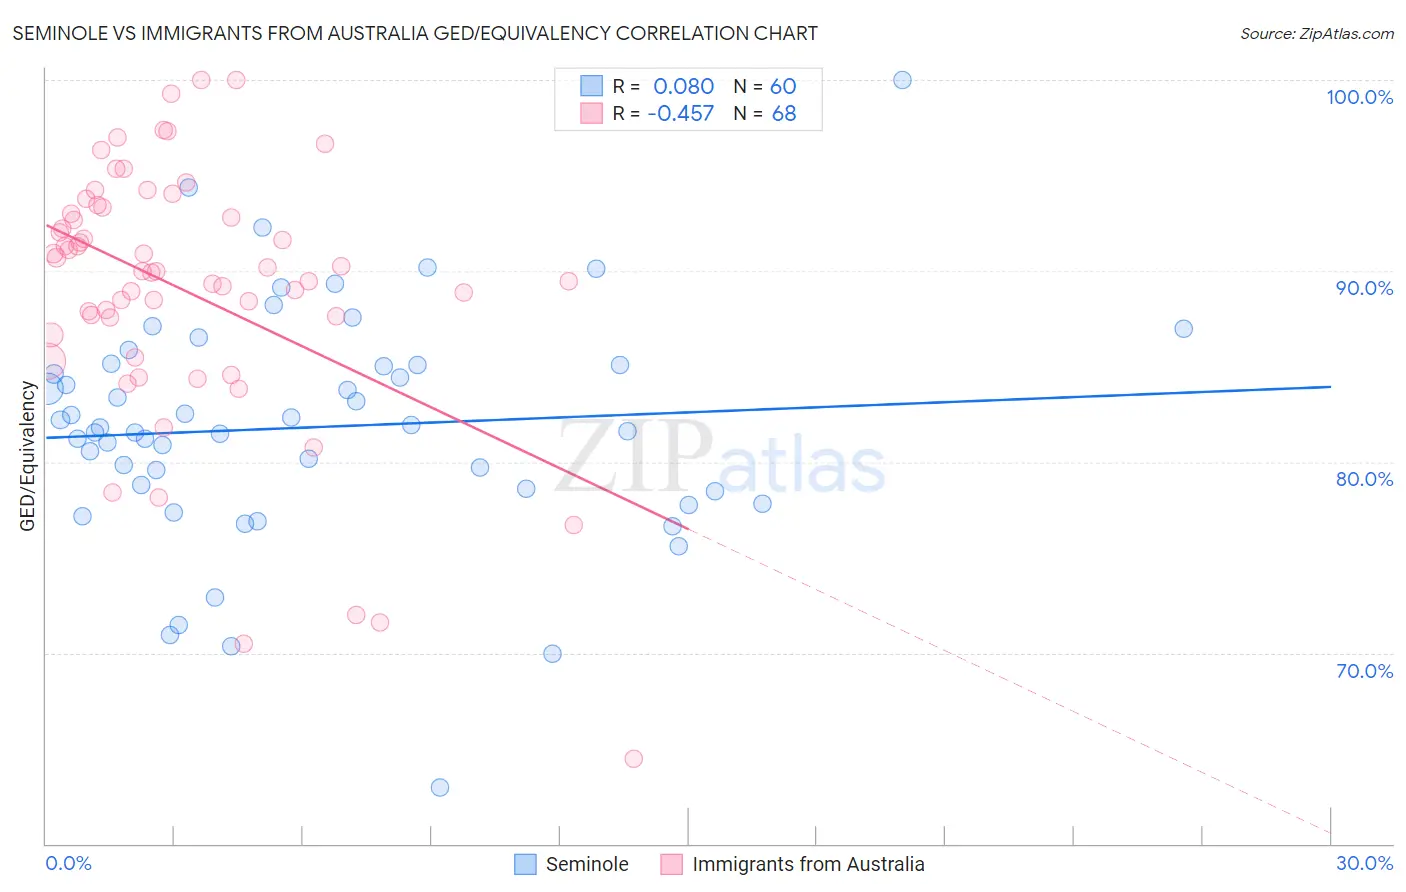
Seminole vs Immigrants from Australia GED/Equivalency Correlation Chart
The statistical analysis conducted on geographies consisting of 118,314,162 people shows a slight positive correlation between the proportion of Seminole and percentage of population with at least ged/equivalency education in the United States with a correlation coefficient (R) of 0.080 and weighted average of 82.8%. Similarly, the statistical analysis conducted on geographies consisting of 227,202,828 people shows a moderate negative correlation between the proportion of Immigrants from Australia and percentage of population with at least ged/equivalency education in the United States with a correlation coefficient (R) of -0.457 and weighted average of 88.6%, a difference of 7.0%.
GED/Equivalency Correlation Summary
| Measurement | Seminole | Immigrants from Australia |
| Minimum | 63.0% | 64.5% |
| Maximum | 100.0% | 100.0% |
| Range | 37.0% | 35.5% |
| Mean | 81.8% | 88.9% |
| Median | 81.7% | 90.0% |
| Interquartile 25% (IQ1) | 78.5% | 87.1% |
| Interquartile 75% (IQ3) | 85.1% | 93.2% |
| Interquartile Range (IQR) | 6.5% | 6.1% |
| Standard Deviation (Sample) | 6.2% | 6.9% |
| Standard Deviation (Population) | 6.1% | 6.9% |
Similar Demographics by GED/Equivalency
Demographics Similar to Seminole by GED/Equivalency
In terms of ged/equivalency, the demographic groups most similar to Seminole are Black/African American (82.8%, a difference of 0.020%), Arapaho (82.8%, a difference of 0.040%), Immigrants from Trinidad and Tobago (82.8%, a difference of 0.060%), Immigrants from Laos (82.7%, a difference of 0.070%), and Pennsylvania German (82.9%, a difference of 0.080%).
| Demographics | Rating | Rank | GED/Equivalency |
| Immigrants | Burma/Myanmar | 0.2 /100 | #268 | Tragic 83.0% |
| Hopi | 0.2 /100 | #269 | Tragic 83.0% |
| Immigrants | Jamaica | 0.2 /100 | #270 | Tragic 82.9% |
| U.S. Virgin Islanders | 0.2 /100 | #271 | Tragic 82.9% |
| Barbadians | 0.1 /100 | #272 | Tragic 82.9% |
| Pennsylvania Germans | 0.1 /100 | #273 | Tragic 82.9% |
| Immigrants | Trinidad and Tobago | 0.1 /100 | #274 | Tragic 82.8% |
| Seminole | 0.1 /100 | #275 | Tragic 82.8% |
| Blacks/African Americans | 0.1 /100 | #276 | Tragic 82.8% |
| Arapaho | 0.1 /100 | #277 | Tragic 82.8% |
| Immigrants | Laos | 0.1 /100 | #278 | Tragic 82.7% |
| Immigrants | Fiji | 0.1 /100 | #279 | Tragic 82.7% |
| Cheyenne | 0.1 /100 | #280 | Tragic 82.7% |
| Sioux | 0.1 /100 | #281 | Tragic 82.6% |
| Immigrants | Immigrants | 0.1 /100 | #282 | Tragic 82.6% |
Demographics Similar to Immigrants from Australia by GED/Equivalency
In terms of ged/equivalency, the demographic groups most similar to Immigrants from Australia are Slovak (88.6%, a difference of 0.0%), Estonian (88.6%, a difference of 0.0%), Russian (88.6%, a difference of 0.010%), Immigrants from Ireland (88.6%, a difference of 0.020%), and Luxembourger (88.6%, a difference of 0.030%).
| Demographics | Rating | Rank | GED/Equivalency |
| Swedes | 99.9 /100 | #19 | Exceptional 88.8% |
| Maltese | 99.9 /100 | #20 | Exceptional 88.6% |
| Luxembourgers | 99.8 /100 | #21 | Exceptional 88.6% |
| Immigrants | Ireland | 99.8 /100 | #22 | Exceptional 88.6% |
| Russians | 99.8 /100 | #23 | Exceptional 88.6% |
| Slovaks | 99.8 /100 | #24 | Exceptional 88.6% |
| Estonians | 99.8 /100 | #25 | Exceptional 88.6% |
| Immigrants | Australia | 99.8 /100 | #26 | Exceptional 88.6% |
| Immigrants | Lithuania | 99.8 /100 | #27 | Exceptional 88.6% |
| Immigrants | Northern Europe | 99.8 /100 | #28 | Exceptional 88.5% |
| Poles | 99.8 /100 | #29 | Exceptional 88.5% |
| Turks | 99.8 /100 | #30 | Exceptional 88.5% |
| Bhutanese | 99.8 /100 | #31 | Exceptional 88.4% |
| Danes | 99.8 /100 | #32 | Exceptional 88.4% |
| Immigrants | Sweden | 99.7 /100 | #33 | Exceptional 88.4% |