Seminole vs Belizean GED/Equivalency
COMPARE
Seminole
Belizean
GED/Equivalency
GED/Equivalency Comparison
Seminole
Belizeans
82.8%
GED/EQUIVALENCY
0.1/ 100
METRIC RATING
275th/ 347
METRIC RANK
80.9%
GED/EQUIVALENCY
0.0/ 100
METRIC RATING
314th/ 347
METRIC RANK
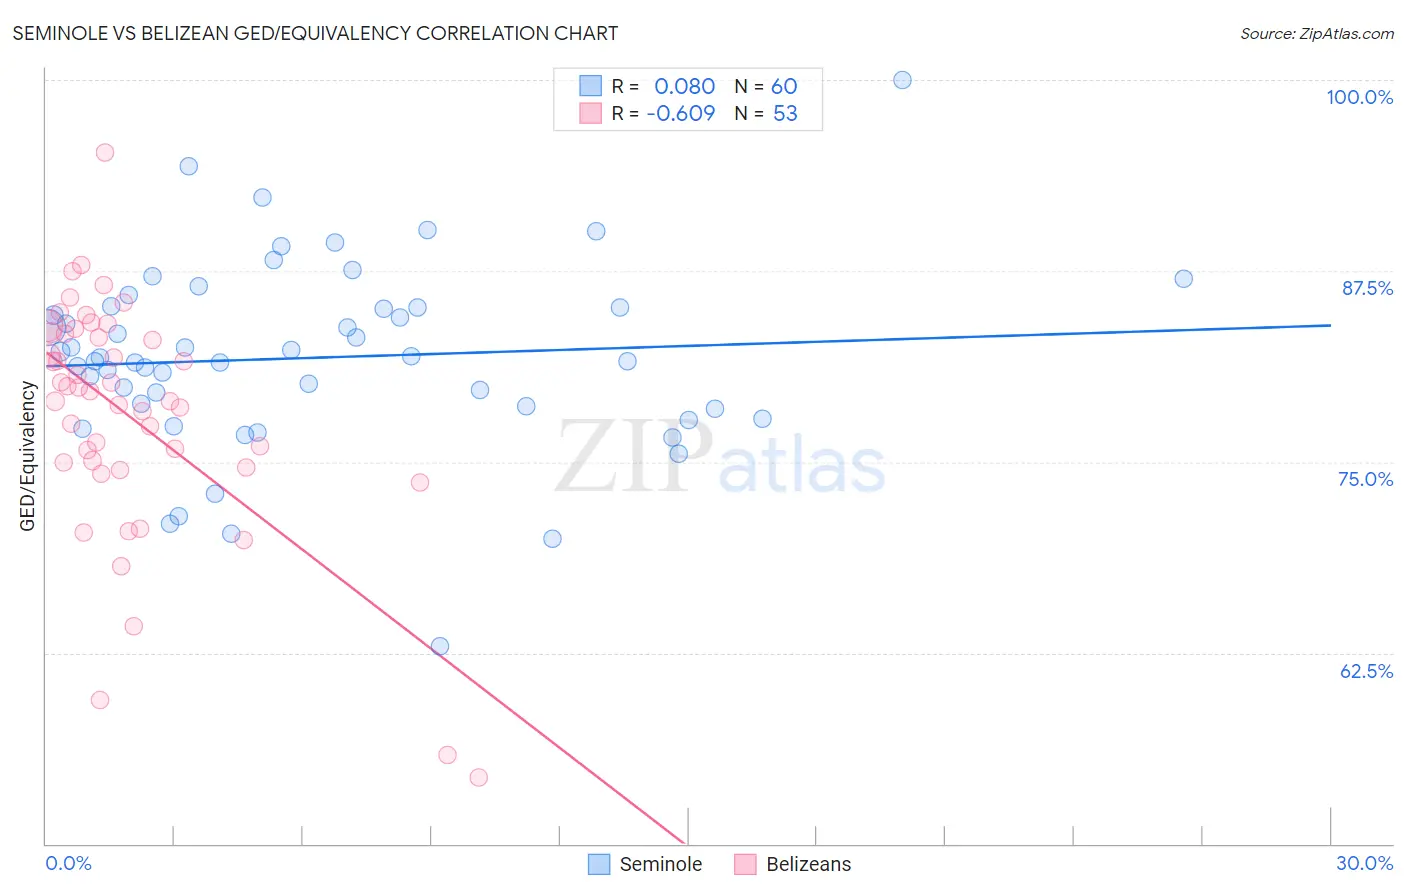
Seminole vs Belizean GED/Equivalency Correlation Chart
The statistical analysis conducted on geographies consisting of 118,314,162 people shows a slight positive correlation between the proportion of Seminole and percentage of population with at least ged/equivalency education in the United States with a correlation coefficient (R) of 0.080 and weighted average of 82.8%. Similarly, the statistical analysis conducted on geographies consisting of 144,224,111 people shows a significant negative correlation between the proportion of Belizeans and percentage of population with at least ged/equivalency education in the United States with a correlation coefficient (R) of -0.609 and weighted average of 80.9%, a difference of 2.3%.
GED/Equivalency Correlation Summary
| Measurement | Seminole | Belizean |
| Minimum | 63.0% | 54.3% |
| Maximum | 100.0% | 95.3% |
| Range | 37.0% | 40.9% |
| Mean | 81.8% | 78.1% |
| Median | 81.7% | 79.6% |
| Interquartile 25% (IQ1) | 78.5% | 74.8% |
| Interquartile 75% (IQ3) | 85.1% | 83.4% |
| Interquartile Range (IQR) | 6.5% | 8.6% |
| Standard Deviation (Sample) | 6.2% | 7.8% |
| Standard Deviation (Population) | 6.1% | 7.7% |
Similar Demographics by GED/Equivalency
Demographics Similar to Seminole by GED/Equivalency
In terms of ged/equivalency, the demographic groups most similar to Seminole are Black/African American (82.8%, a difference of 0.020%), Arapaho (82.8%, a difference of 0.040%), Immigrants from Trinidad and Tobago (82.8%, a difference of 0.060%), Immigrants from Laos (82.7%, a difference of 0.070%), and Pennsylvania German (82.9%, a difference of 0.080%).
| Demographics | Rating | Rank | GED/Equivalency |
| Immigrants | Burma/Myanmar | 0.2 /100 | #268 | Tragic 83.0% |
| Hopi | 0.2 /100 | #269 | Tragic 83.0% |
| Immigrants | Jamaica | 0.2 /100 | #270 | Tragic 82.9% |
| U.S. Virgin Islanders | 0.2 /100 | #271 | Tragic 82.9% |
| Barbadians | 0.1 /100 | #272 | Tragic 82.9% |
| Pennsylvania Germans | 0.1 /100 | #273 | Tragic 82.9% |
| Immigrants | Trinidad and Tobago | 0.1 /100 | #274 | Tragic 82.8% |
| Seminole | 0.1 /100 | #275 | Tragic 82.8% |
| Blacks/African Americans | 0.1 /100 | #276 | Tragic 82.8% |
| Arapaho | 0.1 /100 | #277 | Tragic 82.8% |
| Immigrants | Laos | 0.1 /100 | #278 | Tragic 82.7% |
| Immigrants | Fiji | 0.1 /100 | #279 | Tragic 82.7% |
| Cheyenne | 0.1 /100 | #280 | Tragic 82.7% |
| Sioux | 0.1 /100 | #281 | Tragic 82.6% |
| Immigrants | Immigrants | 0.1 /100 | #282 | Tragic 82.6% |
Demographics Similar to Belizeans by GED/Equivalency
In terms of ged/equivalency, the demographic groups most similar to Belizeans are Nicaraguan (80.9%, a difference of 0.020%), Cape Verdean (80.9%, a difference of 0.020%), Immigrants from Guyana (81.0%, a difference of 0.060%), Native/Alaskan (80.9%, a difference of 0.060%), and Immigrants from Ecuador (81.0%, a difference of 0.13%).
| Demographics | Rating | Rank | GED/Equivalency |
| Immigrants | Dominica | 0.0 /100 | #307 | Tragic 81.1% |
| Puerto Ricans | 0.0 /100 | #308 | Tragic 81.1% |
| Immigrants | Ecuador | 0.0 /100 | #309 | Tragic 81.0% |
| Immigrants | Guyana | 0.0 /100 | #310 | Tragic 81.0% |
| Natives/Alaskans | 0.0 /100 | #311 | Tragic 80.9% |
| Nicaraguans | 0.0 /100 | #312 | Tragic 80.9% |
| Cape Verdeans | 0.0 /100 | #313 | Tragic 80.9% |
| Belizeans | 0.0 /100 | #314 | Tragic 80.9% |
| Apache | 0.0 /100 | #315 | Tragic 80.7% |
| Central American Indians | 0.0 /100 | #316 | Tragic 80.6% |
| Immigrants | Caribbean | 0.0 /100 | #317 | Tragic 80.5% |
| Yaqui | 0.0 /100 | #318 | Tragic 80.5% |
| Immigrants | Belize | 0.0 /100 | #319 | Tragic 80.5% |
| Immigrants | Cuba | 0.0 /100 | #320 | Tragic 80.2% |
| Yup'ik | 0.0 /100 | #321 | Tragic 80.0% |