Seminole vs Czechoslovakian GED/Equivalency
COMPARE
Seminole
Czechoslovakian
GED/Equivalency
GED/Equivalency Comparison
Seminole
Czechoslovakians
82.8%
GED/EQUIVALENCY
0.1/ 100
METRIC RATING
275th/ 347
METRIC RANK
87.4%
GED/EQUIVALENCY
97.6/ 100
METRIC RATING
96th/ 347
METRIC RANK
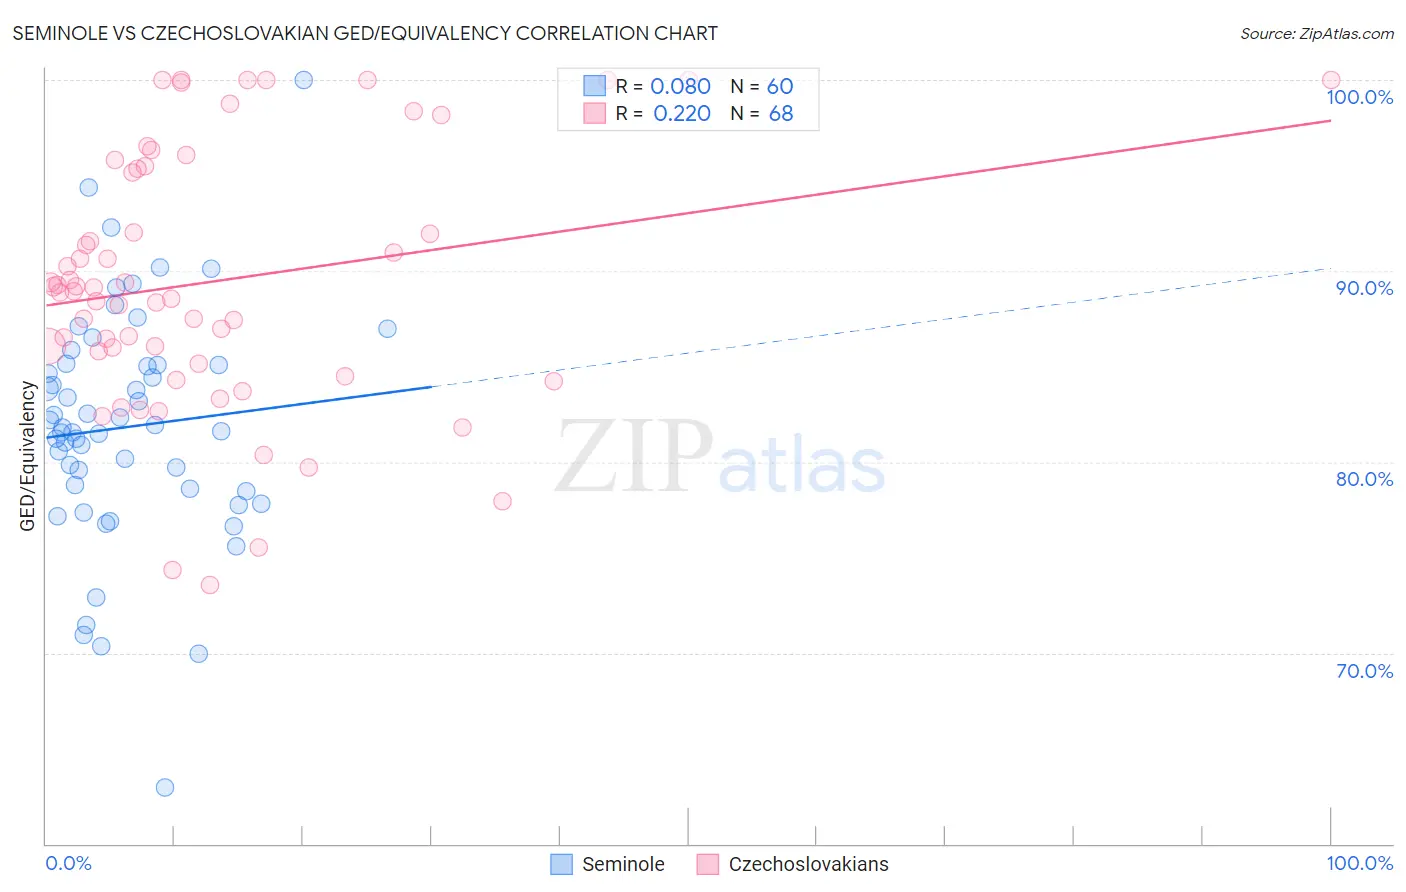
Seminole vs Czechoslovakian GED/Equivalency Correlation Chart
The statistical analysis conducted on geographies consisting of 118,314,162 people shows a slight positive correlation between the proportion of Seminole and percentage of population with at least ged/equivalency education in the United States with a correlation coefficient (R) of 0.080 and weighted average of 82.8%. Similarly, the statistical analysis conducted on geographies consisting of 368,668,598 people shows a weak positive correlation between the proportion of Czechoslovakians and percentage of population with at least ged/equivalency education in the United States with a correlation coefficient (R) of 0.220 and weighted average of 87.4%, a difference of 5.6%.
GED/Equivalency Correlation Summary
| Measurement | Seminole | Czechoslovakian |
| Minimum | 63.0% | 73.5% |
| Maximum | 100.0% | 100.0% |
| Range | 37.0% | 26.5% |
| Mean | 81.8% | 89.5% |
| Median | 81.7% | 89.0% |
| Interquartile 25% (IQ1) | 78.5% | 85.5% |
| Interquartile 75% (IQ3) | 85.1% | 95.4% |
| Interquartile Range (IQR) | 6.5% | 9.9% |
| Standard Deviation (Sample) | 6.2% | 6.7% |
| Standard Deviation (Population) | 6.1% | 6.7% |
Similar Demographics by GED/Equivalency
Demographics Similar to Seminole by GED/Equivalency
In terms of ged/equivalency, the demographic groups most similar to Seminole are Black/African American (82.8%, a difference of 0.020%), Arapaho (82.8%, a difference of 0.040%), Immigrants from Trinidad and Tobago (82.8%, a difference of 0.060%), Immigrants from Laos (82.7%, a difference of 0.070%), and Pennsylvania German (82.9%, a difference of 0.080%).
| Demographics | Rating | Rank | GED/Equivalency |
| Immigrants | Burma/Myanmar | 0.2 /100 | #268 | Tragic 83.0% |
| Hopi | 0.2 /100 | #269 | Tragic 83.0% |
| Immigrants | Jamaica | 0.2 /100 | #270 | Tragic 82.9% |
| U.S. Virgin Islanders | 0.2 /100 | #271 | Tragic 82.9% |
| Barbadians | 0.1 /100 | #272 | Tragic 82.9% |
| Pennsylvania Germans | 0.1 /100 | #273 | Tragic 82.9% |
| Immigrants | Trinidad and Tobago | 0.1 /100 | #274 | Tragic 82.8% |
| Seminole | 0.1 /100 | #275 | Tragic 82.8% |
| Blacks/African Americans | 0.1 /100 | #276 | Tragic 82.8% |
| Arapaho | 0.1 /100 | #277 | Tragic 82.8% |
| Immigrants | Laos | 0.1 /100 | #278 | Tragic 82.7% |
| Immigrants | Fiji | 0.1 /100 | #279 | Tragic 82.7% |
| Cheyenne | 0.1 /100 | #280 | Tragic 82.7% |
| Sioux | 0.1 /100 | #281 | Tragic 82.6% |
| Immigrants | Immigrants | 0.1 /100 | #282 | Tragic 82.6% |
Demographics Similar to Czechoslovakians by GED/Equivalency
In terms of ged/equivalency, the demographic groups most similar to Czechoslovakians are Immigrants from Greece (87.4%, a difference of 0.020%), Immigrants from Russia (87.4%, a difference of 0.030%), Israeli (87.4%, a difference of 0.040%), Immigrants from North Macedonia (87.4%, a difference of 0.040%), and Hungarian (87.4%, a difference of 0.060%).
| Demographics | Rating | Rank | GED/Equivalency |
| Hungarians | 97.9 /100 | #89 | Exceptional 87.4% |
| Welsh | 97.9 /100 | #90 | Exceptional 87.4% |
| Immigrants | Eastern Asia | 97.9 /100 | #91 | Exceptional 87.4% |
| Israelis | 97.8 /100 | #92 | Exceptional 87.4% |
| Immigrants | North Macedonia | 97.8 /100 | #93 | Exceptional 87.4% |
| Immigrants | Russia | 97.8 /100 | #94 | Exceptional 87.4% |
| Immigrants | Greece | 97.7 /100 | #95 | Exceptional 87.4% |
| Czechoslovakians | 97.6 /100 | #96 | Exceptional 87.4% |
| Immigrants | Western Europe | 97.3 /100 | #97 | Exceptional 87.3% |
| Immigrants | Croatia | 96.9 /100 | #98 | Exceptional 87.3% |
| Immigrants | Belarus | 96.9 /100 | #99 | Exceptional 87.3% |
| Palestinians | 96.8 /100 | #100 | Exceptional 87.3% |
| Syrians | 96.6 /100 | #101 | Exceptional 87.2% |
| Lebanese | 96.2 /100 | #102 | Exceptional 87.2% |
| Jordanians | 96.1 /100 | #103 | Exceptional 87.2% |