Immigrants from Spain vs Bulgarian Self-Care Disability
COMPARE
Immigrants from Spain
Bulgarian
Self-Care Disability
Self-Care Disability Comparison
Immigrants from Spain
Bulgarians
2.3%
SELF-CARE DISABILITY
98.7/ 100
METRIC RATING
84th/ 347
METRIC RANK
2.2%
SELF-CARE DISABILITY
100.0/ 100
METRIC RATING
21st/ 347
METRIC RANK
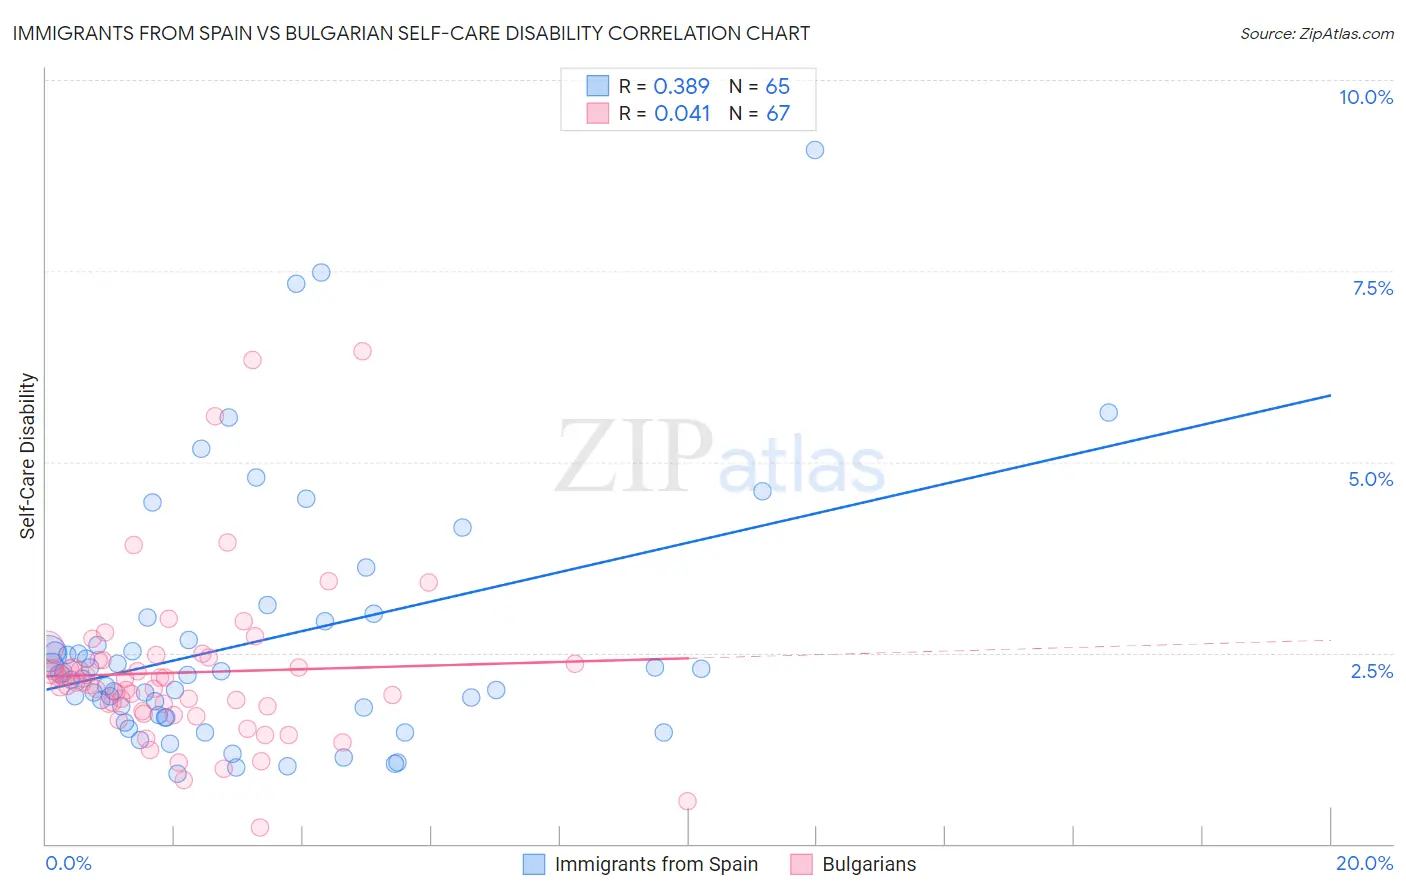
Immigrants from Spain vs Bulgarian Self-Care Disability Correlation Chart
The statistical analysis conducted on geographies consisting of 239,524,195 people shows a mild positive correlation between the proportion of Immigrants from Spain and percentage of population with self-care disability in the United States with a correlation coefficient (R) of 0.389 and weighted average of 2.3%. Similarly, the statistical analysis conducted on geographies consisting of 205,516,049 people shows no correlation between the proportion of Bulgarians and percentage of population with self-care disability in the United States with a correlation coefficient (R) of 0.041 and weighted average of 2.2%, a difference of 5.0%.
Self-Care Disability Correlation Summary
| Measurement | Immigrants from Spain | Bulgarian |
| Minimum | 0.91% | 0.21% |
| Maximum | 9.1% | 6.5% |
| Range | 8.2% | 6.2% |
| Mean | 2.6% | 2.2% |
| Median | 2.2% | 2.1% |
| Interquartile 25% (IQ1) | 1.7% | 1.7% |
| Interquartile 75% (IQ3) | 2.8% | 2.4% |
| Interquartile Range (IQR) | 1.1% | 0.68% |
| Standard Deviation (Sample) | 1.6% | 1.1% |
| Standard Deviation (Population) | 1.6% | 1.1% |
Similar Demographics by Self-Care Disability
Demographics Similar to Immigrants from Spain by Self-Care Disability
In terms of self-care disability, the demographic groups most similar to Immigrants from Spain are Indian (Asian) (2.3%, a difference of 0.040%), Immigrants from Denmark (2.3%, a difference of 0.10%), Ugandan (2.3%, a difference of 0.11%), Chilean (2.3%, a difference of 0.17%), and Estonian (2.3%, a difference of 0.34%).
| Demographics | Rating | Rank | Self-Care Disability |
| Immigrants | Middle Africa | 99.0 /100 | #77 | Exceptional 2.3% |
| Immigrants | Ireland | 99.0 /100 | #78 | Exceptional 2.3% |
| Immigrants | Kenya | 99.0 /100 | #79 | Exceptional 2.3% |
| Chileans | 98.8 /100 | #80 | Exceptional 2.3% |
| Ugandans | 98.8 /100 | #81 | Exceptional 2.3% |
| Immigrants | Denmark | 98.8 /100 | #82 | Exceptional 2.3% |
| Indians (Asian) | 98.7 /100 | #83 | Exceptional 2.3% |
| Immigrants | Spain | 98.7 /100 | #84 | Exceptional 2.3% |
| Estonians | 98.3 /100 | #85 | Exceptional 2.3% |
| Immigrants | Northern Africa | 98.2 /100 | #86 | Exceptional 2.3% |
| Sierra Leoneans | 98.0 /100 | #87 | Exceptional 2.4% |
| Lithuanians | 98.0 /100 | #88 | Exceptional 2.4% |
| Immigrants | Congo | 98.0 /100 | #89 | Exceptional 2.4% |
| Immigrants | Czechoslovakia | 97.7 /100 | #90 | Exceptional 2.4% |
| Immigrants | Jordan | 97.7 /100 | #91 | Exceptional 2.4% |
Demographics Similar to Bulgarians by Self-Care Disability
In terms of self-care disability, the demographic groups most similar to Bulgarians are Immigrants from Venezuela (2.2%, a difference of 0.040%), Tongan (2.2%, a difference of 0.25%), Cambodian (2.2%, a difference of 0.25%), Immigrants from Eritrea (2.2%, a difference of 0.33%), and Cypriot (2.2%, a difference of 0.55%).
| Demographics | Rating | Rank | Self-Care Disability |
| Luxembourgers | 100.0 /100 | #14 | Exceptional 2.2% |
| Okinawans | 100.0 /100 | #15 | Exceptional 2.2% |
| Immigrants | Kuwait | 100.0 /100 | #16 | Exceptional 2.2% |
| Immigrants | Saudi Arabia | 100.0 /100 | #17 | Exceptional 2.2% |
| Immigrants | Taiwan | 100.0 /100 | #18 | Exceptional 2.2% |
| Immigrants | Eritrea | 100.0 /100 | #19 | Exceptional 2.2% |
| Tongans | 100.0 /100 | #20 | Exceptional 2.2% |
| Bulgarians | 100.0 /100 | #21 | Exceptional 2.2% |
| Immigrants | Venezuela | 100.0 /100 | #22 | Exceptional 2.2% |
| Cambodians | 100.0 /100 | #23 | Exceptional 2.2% |
| Cypriots | 100.0 /100 | #24 | Exceptional 2.2% |
| Turks | 100.0 /100 | #25 | Exceptional 2.2% |
| Immigrants | Sri Lanka | 99.9 /100 | #26 | Exceptional 2.2% |
| Venezuelans | 99.9 /100 | #27 | Exceptional 2.2% |
| Inupiat | 99.9 /100 | #28 | Exceptional 2.2% |