Immigrants from Cameroon vs Immigrants from Argentina Self-Care Disability
COMPARE
Immigrants from Cameroon
Immigrants from Argentina
Self-Care Disability
Self-Care Disability Comparison
Immigrants from Cameroon
Immigrants from Argentina
2.3%
SELF-CARE DISABILITY
99.6/ 100
METRIC RATING
58th/ 347
METRIC RANK
2.3%
SELF-CARE DISABILITY
99.3/ 100
METRIC RATING
66th/ 347
METRIC RANK
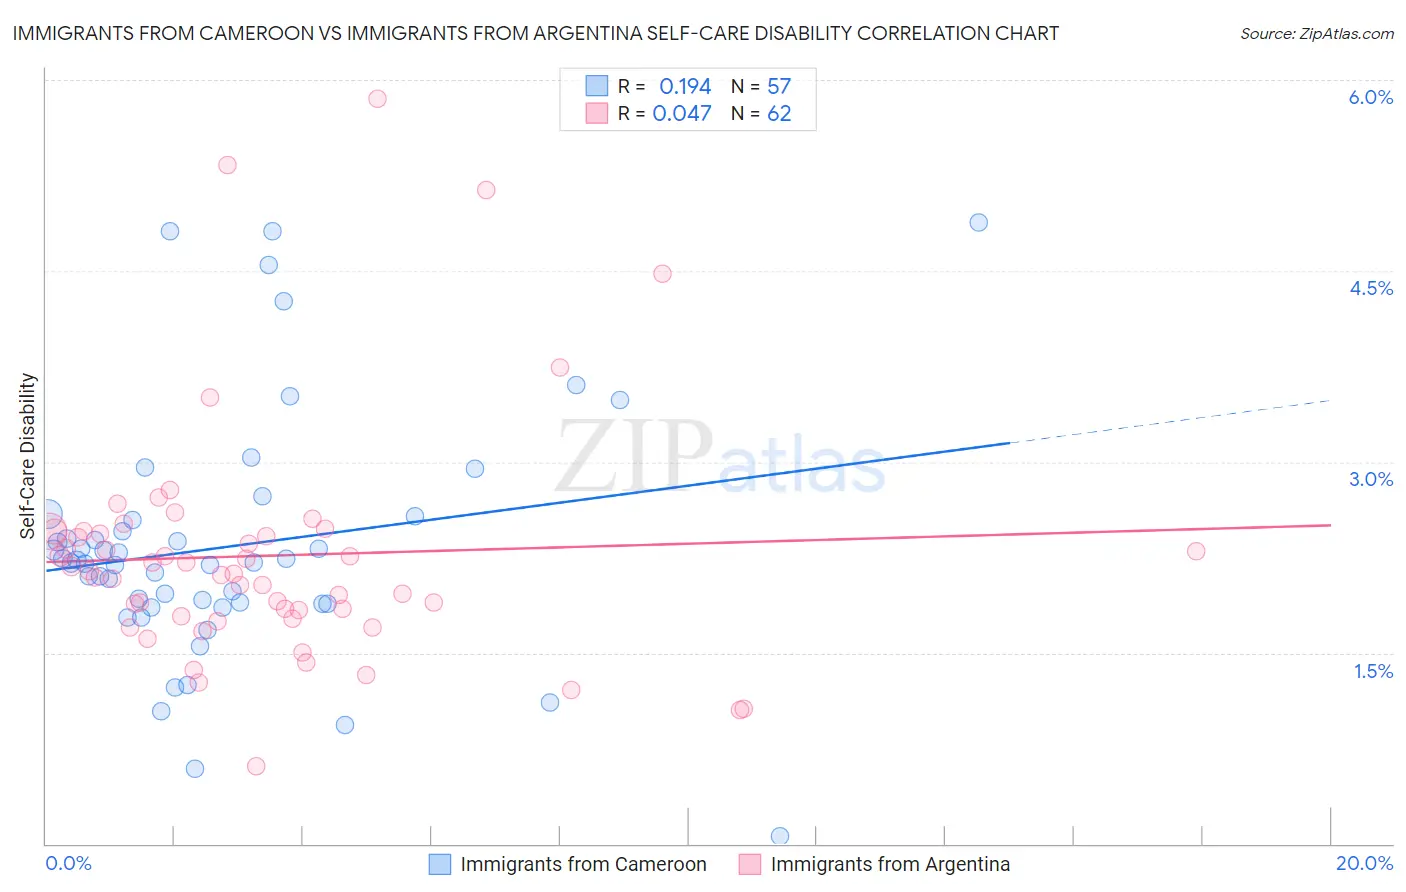
Immigrants from Cameroon vs Immigrants from Argentina Self-Care Disability Correlation Chart
The statistical analysis conducted on geographies consisting of 130,698,319 people shows a poor positive correlation between the proportion of Immigrants from Cameroon and percentage of population with self-care disability in the United States with a correlation coefficient (R) of 0.194 and weighted average of 2.3%. Similarly, the statistical analysis conducted on geographies consisting of 264,279,860 people shows no correlation between the proportion of Immigrants from Argentina and percentage of population with self-care disability in the United States with a correlation coefficient (R) of 0.047 and weighted average of 2.3%, a difference of 0.62%.
Self-Care Disability Correlation Summary
| Measurement | Immigrants from Cameroon | Immigrants from Argentina |
| Minimum | 0.061% | 0.61% |
| Maximum | 4.9% | 5.8% |
| Range | 4.8% | 5.2% |
| Mean | 2.3% | 2.3% |
| Median | 2.2% | 2.1% |
| Interquartile 25% (IQ1) | 1.9% | 1.8% |
| Interquartile 75% (IQ3) | 2.6% | 2.5% |
| Interquartile Range (IQR) | 0.67% | 0.66% |
| Standard Deviation (Sample) | 0.97% | 0.95% |
| Standard Deviation (Population) | 0.96% | 0.94% |
Demographics Similar to Immigrants from Cameroon and Immigrants from Argentina by Self-Care Disability
In terms of self-care disability, the demographic groups most similar to Immigrants from Cameroon are Immigrants from Belgium (2.3%, a difference of 0.070%), Immigrants from Eastern Asia (2.3%, a difference of 0.080%), New Zealander (2.3%, a difference of 0.11%), Immigrants from France (2.3%, a difference of 0.12%), and Argentinean (2.3%, a difference of 0.18%). Similarly, the demographic groups most similar to Immigrants from Argentina are Brazilian (2.3%, a difference of 0.030%), South African (2.3%, a difference of 0.030%), Swedish (2.3%, a difference of 0.090%), Mongolian (2.3%, a difference of 0.10%), and Immigrants from Zaire (2.3%, a difference of 0.12%).
| Demographics | Rating | Rank | Self-Care Disability |
| Immigrants | Serbia | 99.6 /100 | #52 | Exceptional 2.3% |
| Australians | 99.6 /100 | #53 | Exceptional 2.3% |
| Argentineans | 99.6 /100 | #54 | Exceptional 2.3% |
| Immigrants | France | 99.6 /100 | #55 | Exceptional 2.3% |
| Immigrants | Eastern Asia | 99.6 /100 | #56 | Exceptional 2.3% |
| Immigrants | Belgium | 99.6 /100 | #57 | Exceptional 2.3% |
| Immigrants | Cameroon | 99.6 /100 | #58 | Exceptional 2.3% |
| New Zealanders | 99.5 /100 | #59 | Exceptional 2.3% |
| Immigrants | Japan | 99.5 /100 | #60 | Exceptional 2.3% |
| Palestinians | 99.4 /100 | #61 | Exceptional 2.3% |
| Egyptians | 99.4 /100 | #62 | Exceptional 2.3% |
| Mongolians | 99.3 /100 | #63 | Exceptional 2.3% |
| Swedes | 99.3 /100 | #64 | Exceptional 2.3% |
| Brazilians | 99.3 /100 | #65 | Exceptional 2.3% |
| Immigrants | Argentina | 99.3 /100 | #66 | Exceptional 2.3% |
| South Africans | 99.3 /100 | #67 | Exceptional 2.3% |
| Immigrants | Zaire | 99.2 /100 | #68 | Exceptional 2.3% |
| Immigrants | Norway | 99.2 /100 | #69 | Exceptional 2.3% |
| Immigrants | Northern Europe | 99.2 /100 | #70 | Exceptional 2.3% |
| Asians | 99.2 /100 | #71 | Exceptional 2.3% |
| Eastern Europeans | 99.2 /100 | #72 | Exceptional 2.3% |