Immigrants from Cameroon vs Immigrants from Iraq Self-Care Disability
COMPARE
Immigrants from Cameroon
Immigrants from Iraq
Self-Care Disability
Self-Care Disability Comparison
Immigrants from Cameroon
Immigrants from Iraq
2.3%
SELF-CARE DISABILITY
99.6/ 100
METRIC RATING
58th/ 347
METRIC RANK
2.7%
SELF-CARE DISABILITY
0.0/ 100
METRIC RATING
281st/ 347
METRIC RANK
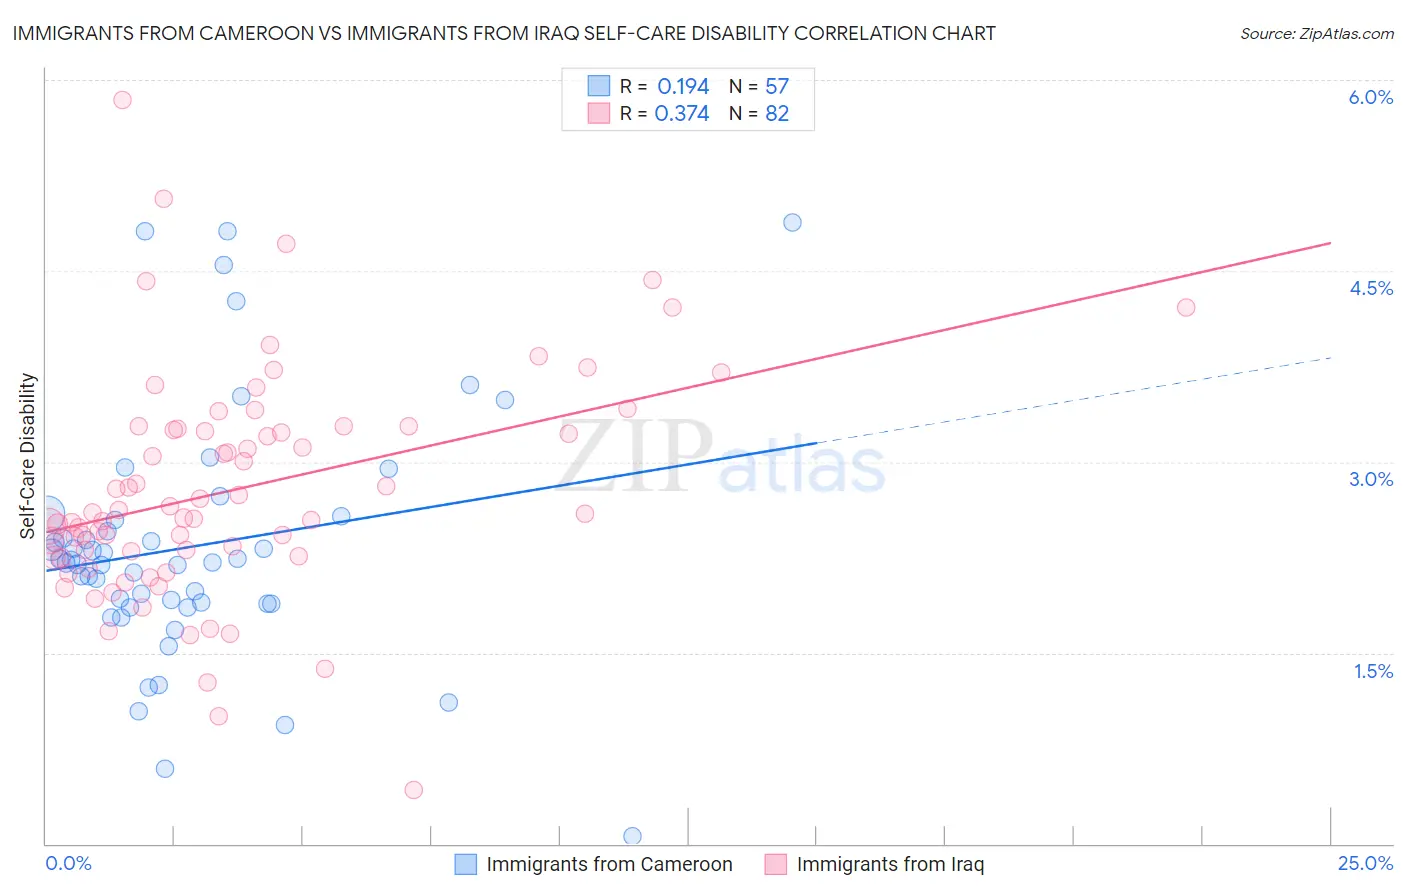
Immigrants from Cameroon vs Immigrants from Iraq Self-Care Disability Correlation Chart
The statistical analysis conducted on geographies consisting of 130,698,319 people shows a poor positive correlation between the proportion of Immigrants from Cameroon and percentage of population with self-care disability in the United States with a correlation coefficient (R) of 0.194 and weighted average of 2.3%. Similarly, the statistical analysis conducted on geographies consisting of 194,657,013 people shows a mild positive correlation between the proportion of Immigrants from Iraq and percentage of population with self-care disability in the United States with a correlation coefficient (R) of 0.374 and weighted average of 2.7%, a difference of 16.7%.
Self-Care Disability Correlation Summary
| Measurement | Immigrants from Cameroon | Immigrants from Iraq |
| Minimum | 0.061% | 0.43% |
| Maximum | 4.9% | 5.8% |
| Range | 4.8% | 5.4% |
| Mean | 2.3% | 2.8% |
| Median | 2.2% | 2.6% |
| Interquartile 25% (IQ1) | 1.9% | 2.3% |
| Interquartile 75% (IQ3) | 2.6% | 3.3% |
| Interquartile Range (IQR) | 0.67% | 1.0% |
| Standard Deviation (Sample) | 0.97% | 0.89% |
| Standard Deviation (Population) | 0.96% | 0.89% |
Similar Demographics by Self-Care Disability
Demographics Similar to Immigrants from Cameroon by Self-Care Disability
In terms of self-care disability, the demographic groups most similar to Immigrants from Cameroon are Immigrants from Belgium (2.3%, a difference of 0.070%), Immigrants from Eastern Asia (2.3%, a difference of 0.080%), New Zealander (2.3%, a difference of 0.11%), Immigrants from France (2.3%, a difference of 0.12%), and Argentinean (2.3%, a difference of 0.18%).
| Demographics | Rating | Rank | Self-Care Disability |
| Kenyans | 99.7 /100 | #51 | Exceptional 2.3% |
| Immigrants | Serbia | 99.6 /100 | #52 | Exceptional 2.3% |
| Australians | 99.6 /100 | #53 | Exceptional 2.3% |
| Argentineans | 99.6 /100 | #54 | Exceptional 2.3% |
| Immigrants | France | 99.6 /100 | #55 | Exceptional 2.3% |
| Immigrants | Eastern Asia | 99.6 /100 | #56 | Exceptional 2.3% |
| Immigrants | Belgium | 99.6 /100 | #57 | Exceptional 2.3% |
| Immigrants | Cameroon | 99.6 /100 | #58 | Exceptional 2.3% |
| New Zealanders | 99.5 /100 | #59 | Exceptional 2.3% |
| Immigrants | Japan | 99.5 /100 | #60 | Exceptional 2.3% |
| Palestinians | 99.4 /100 | #61 | Exceptional 2.3% |
| Egyptians | 99.4 /100 | #62 | Exceptional 2.3% |
| Mongolians | 99.3 /100 | #63 | Exceptional 2.3% |
| Swedes | 99.3 /100 | #64 | Exceptional 2.3% |
| Brazilians | 99.3 /100 | #65 | Exceptional 2.3% |
Demographics Similar to Immigrants from Iraq by Self-Care Disability
In terms of self-care disability, the demographic groups most similar to Immigrants from Iraq are Apache (2.7%, a difference of 0.020%), Delaware (2.7%, a difference of 0.090%), Fijian (2.7%, a difference of 0.13%), Hispanic or Latino (2.7%, a difference of 0.16%), and Jamaican (2.7%, a difference of 0.17%).
| Demographics | Rating | Rank | Self-Care Disability |
| Yakama | 0.1 /100 | #274 | Tragic 2.7% |
| Immigrants | Trinidad and Tobago | 0.1 /100 | #275 | Tragic 2.7% |
| Japanese | 0.1 /100 | #276 | Tragic 2.7% |
| Immigrants | Ukraine | 0.1 /100 | #277 | Tragic 2.7% |
| Ottawa | 0.1 /100 | #278 | Tragic 2.7% |
| Iroquois | 0.1 /100 | #279 | Tragic 2.7% |
| Hispanics or Latinos | 0.1 /100 | #280 | Tragic 2.7% |
| Immigrants | Iraq | 0.0 /100 | #281 | Tragic 2.7% |
| Apache | 0.0 /100 | #282 | Tragic 2.7% |
| Delaware | 0.0 /100 | #283 | Tragic 2.7% |
| Fijians | 0.0 /100 | #284 | Tragic 2.7% |
| Jamaicans | 0.0 /100 | #285 | Tragic 2.7% |
| French American Indians | 0.0 /100 | #286 | Tragic 2.7% |
| Immigrants | Jamaica | 0.0 /100 | #287 | Tragic 2.7% |
| Immigrants | Barbados | 0.0 /100 | #288 | Tragic 2.7% |