St Paul, AR Map & Demographics
St Paul Map
St Paul Overview
$25,211
PER CAPITA INCOME
$43,333
AVG FAMILY INCOME
$40,625
AVG HOUSEHOLD INCOME
0.42
INEQUALITY / GINI INDEX
123
TOTAL POPULATION
69
MALE POPULATION
54
FEMALE POPULATION
127.78
MALES / 100 FEMALES
78.26
FEMALES / 100 MALES
46.8
MEDIAN AGE
3.1
AVG FAMILY SIZE
2.5
AVG HOUSEHOLD SIZE
53
LABOR FORCE [ PEOPLE ]
48.6%
PERCENT IN LABOR FORCE
13.2%
UNEMPLOYMENT RATE
Income in St Paul
Income Overview in St Paul
Per Capita Income in St Paul is $25,211, while median incomes of families and households are $43,333 and $40,625 respectively.
| Characteristic | Number | Measure |
| Per Capita Income | 123 | $25,211 |
| Median Family Income | 34 | $43,333 |
| Mean Family Income | 34 | $68,876 |
| Median Household Income | 50 | $40,625 |
| Mean Household Income | 50 | $57,658 |
| Income Deficit | 34 | $0 |
| Wage / Income Gap (%) | 123 | 0.00% |
| Wage / Income Gap ($) | 123 | 100.00¢ per $1 |
| Gini / Inequality Index | 123 | 0.42 |
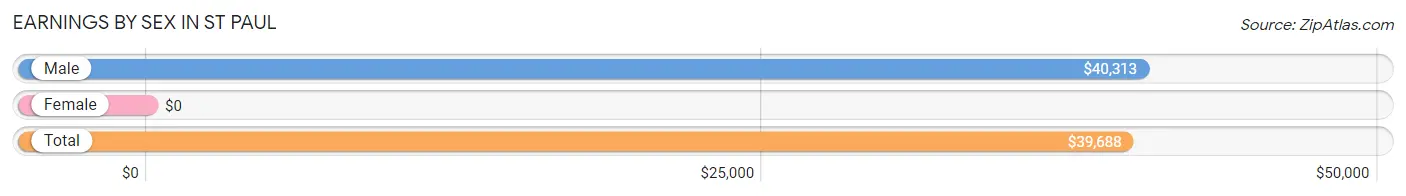
Earnings by Sex in St Paul
| Sex | Number | Average Earnings |
| Male | 31 (66.0%) | $40,313 |
| Female | 16 (34.0%) | $0 |
| Total | 47 (100.0%) | $39,688 |
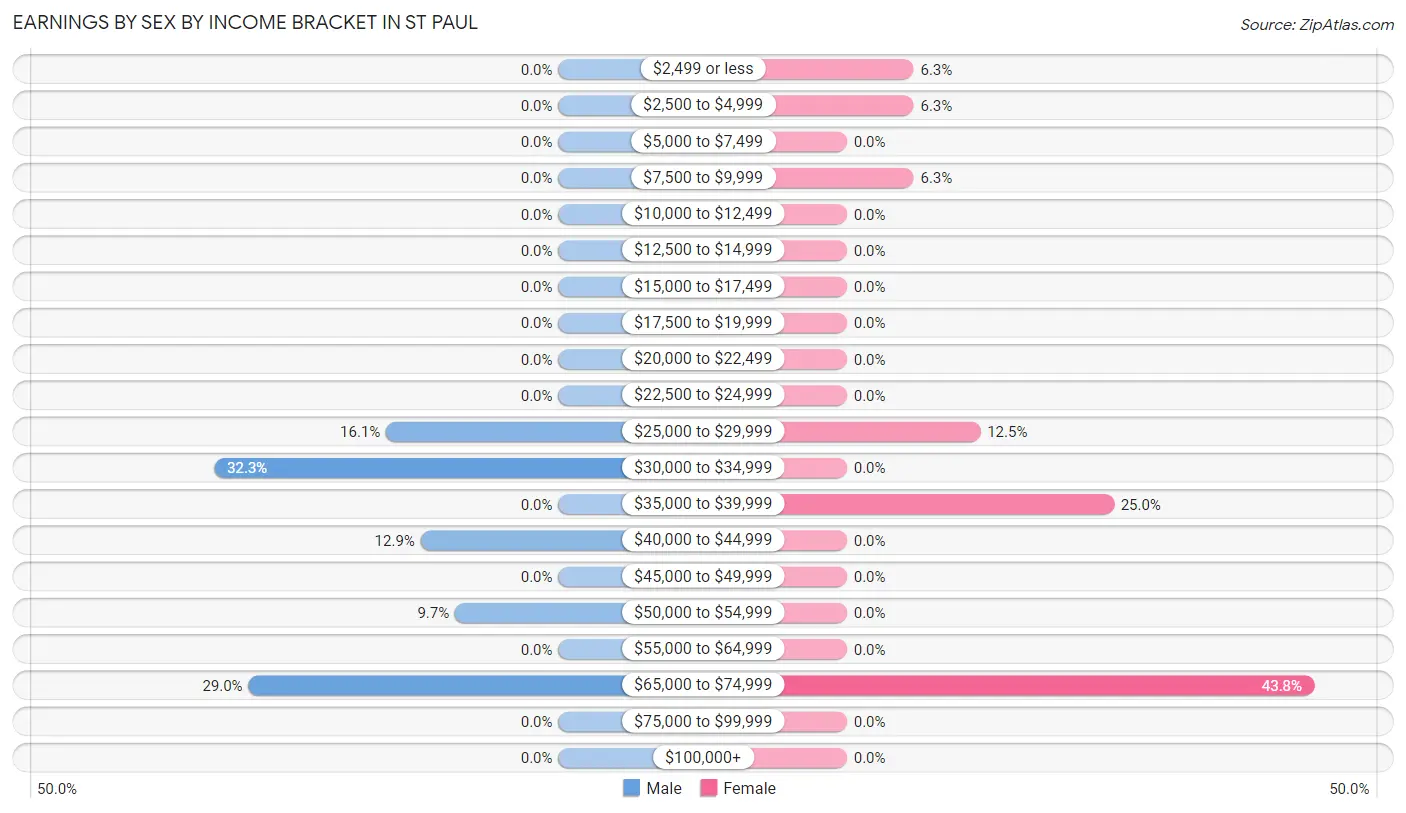
Earnings by Sex by Income Bracket in St Paul
The most common earnings brackets in St Paul are $30,000 to $34,999 for men (10 | 32.3%) and $65,000 to $74,999 for women (7 | 43.8%).
| Income | Male | Female |
| $2,499 or less | 0 (0.0%) | 1 (6.2%) |
| $2,500 to $4,999 | 0 (0.0%) | 1 (6.2%) |
| $5,000 to $7,499 | 0 (0.0%) | 0 (0.0%) |
| $7,500 to $9,999 | 0 (0.0%) | 1 (6.2%) |
| $10,000 to $12,499 | 0 (0.0%) | 0 (0.0%) |
| $12,500 to $14,999 | 0 (0.0%) | 0 (0.0%) |
| $15,000 to $17,499 | 0 (0.0%) | 0 (0.0%) |
| $17,500 to $19,999 | 0 (0.0%) | 0 (0.0%) |
| $20,000 to $22,499 | 0 (0.0%) | 0 (0.0%) |
| $22,500 to $24,999 | 0 (0.0%) | 0 (0.0%) |
| $25,000 to $29,999 | 5 (16.1%) | 2 (12.5%) |
| $30,000 to $34,999 | 10 (32.3%) | 0 (0.0%) |
| $35,000 to $39,999 | 0 (0.0%) | 4 (25.0%) |
| $40,000 to $44,999 | 4 (12.9%) | 0 (0.0%) |
| $45,000 to $49,999 | 0 (0.0%) | 0 (0.0%) |
| $50,000 to $54,999 | 3 (9.7%) | 0 (0.0%) |
| $55,000 to $64,999 | 0 (0.0%) | 0 (0.0%) |
| $65,000 to $74,999 | 9 (29.0%) | 7 (43.8%) |
| $75,000 to $99,999 | 0 (0.0%) | 0 (0.0%) |
| $100,000+ | 0 (0.0%) | 0 (0.0%) |
| Total | 31 (100.0%) | 16 (100.0%) |
Earnings by Sex by Educational Attainment in St Paul
| Educational Attainment | Male Income | Female Income |
| Less than High School | - | - |
| High School Diploma | - | - |
| College or Associate's Degree | - | - |
| Bachelor's Degree | - | - |
| Graduate Degree | - | - |
| Total | $67,778 | $0 |
Family Income in St Paul
Family Income Brackets in St Paul
According to the St Paul family income data, there are 13 families falling into the $35,000 to $49,999 income range, which is the most common income bracket and makes up 38.2% of all families.
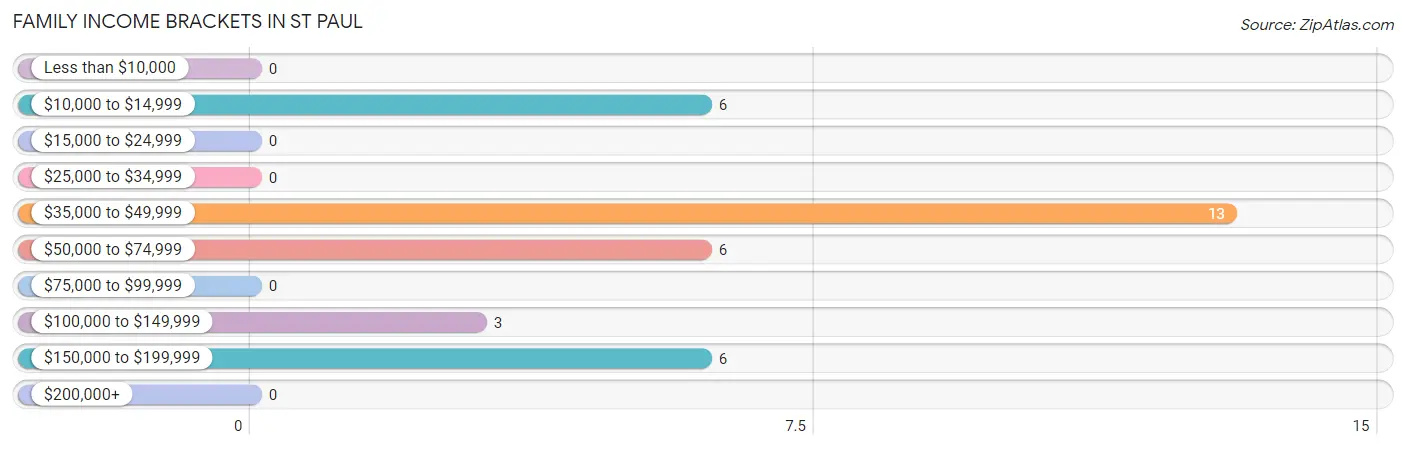
| Income Bracket | # Families | % Families |
| Less than $10,000 | 0 | 0.0% |
| $10,000 to $14,999 | 6 | 17.6% |
| $15,000 to $24,999 | 0 | 0.0% |
| $25,000 to $34,999 | 0 | 0.0% |
| $35,000 to $49,999 | 13 | 38.2% |
| $50,000 to $74,999 | 6 | 17.6% |
| $75,000 to $99,999 | 0 | 0.0% |
| $100,000 to $149,999 | 3 | 8.8% |
| $150,000 to $199,999 | 6 | 17.6% |
| $200,000+ | 0 | 0.0% |
Family Income by Famaliy Size in St Paul
2-person families (11 | 32.4%) account for the highest median family income in St Paul with $55,208 per family, while 2-person families (11 | 32.4%) have the highest median income of $27,604 per family member.
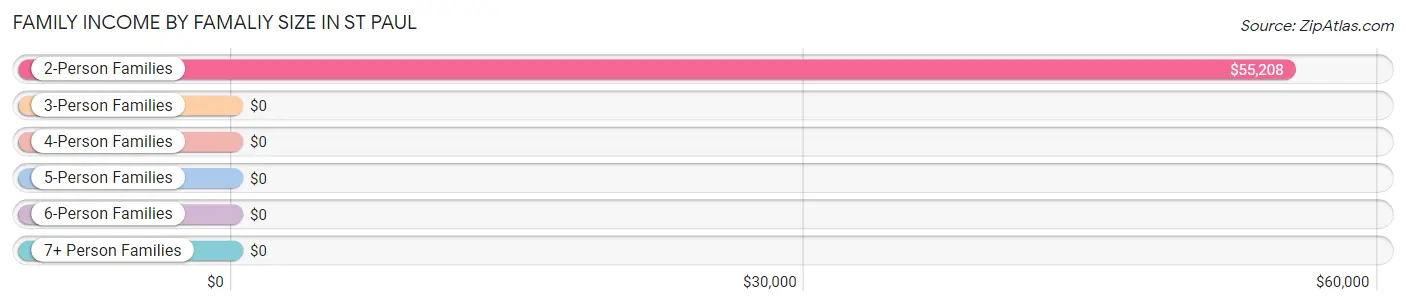
| Income Bracket | # Families | Median Income |
| 2-Person Families | 11 (32.4%) | $55,208 |
| 3-Person Families | 16 (47.1%) | $0 |
| 4-Person Families | 7 (20.6%) | $0 |
| 5-Person Families | 0 (0.0%) | $0 |
| 6-Person Families | 0 (0.0%) | $0 |
| 7+ Person Families | 0 (0.0%) | $0 |
| Total | 34 (100.0%) | $43,333 |
Family Income by Number of Earners in St Paul
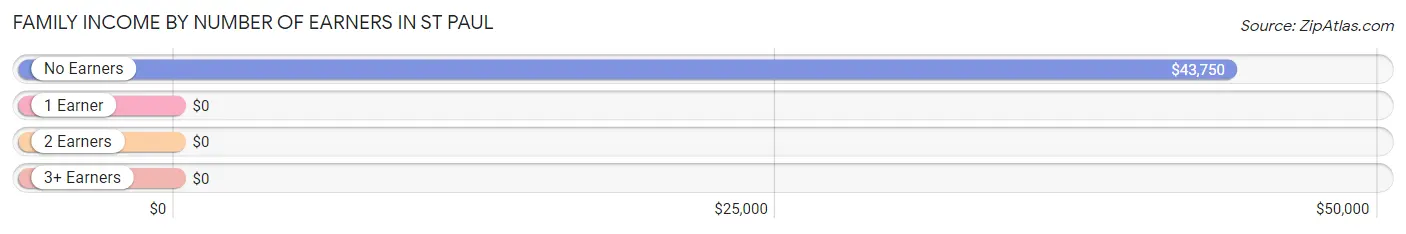
| Number of Earners | # Families | Median Income |
| No Earners | 15 (44.1%) | $43,750 |
| 1 Earner | 8 (23.5%) | $0 |
| 2 Earners | 2 (5.9%) | $0 |
| 3+ Earners | 9 (26.5%) | $0 |
| Total | 34 (100.0%) | $43,333 |
Household Income in St Paul
Household Income Brackets in St Paul
With 14 households falling in the category, the $35,000 to $49,999 income range is the most frequent in St Paul, accounting for 28.0% of all households.
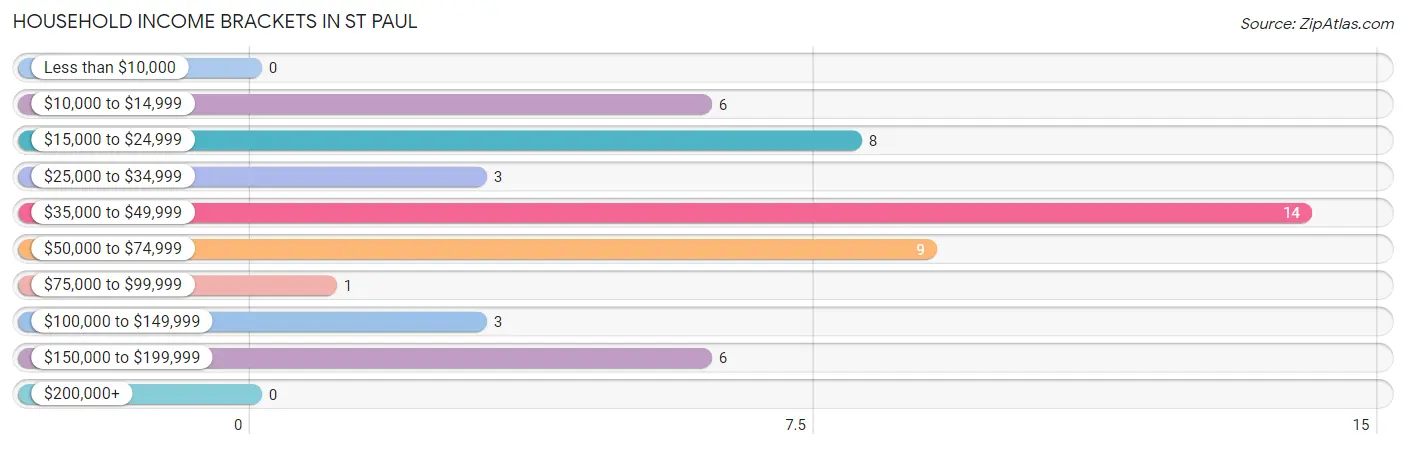
| Income Bracket | # Households | % Households |
| Less than $10,000 | 0 | 0.0% |
| $10,000 to $14,999 | 6 | 12.0% |
| $15,000 to $24,999 | 8 | 16.0% |
| $25,000 to $34,999 | 3 | 6.0% |
| $35,000 to $49,999 | 14 | 28.0% |
| $50,000 to $74,999 | 9 | 18.0% |
| $75,000 to $99,999 | 1 | 2.0% |
| $100,000 to $149,999 | 3 | 6.0% |
| $150,000 to $199,999 | 6 | 12.0% |
| $200,000+ | 0 | 0.0% |
Household Income by Householder Age in St Paul
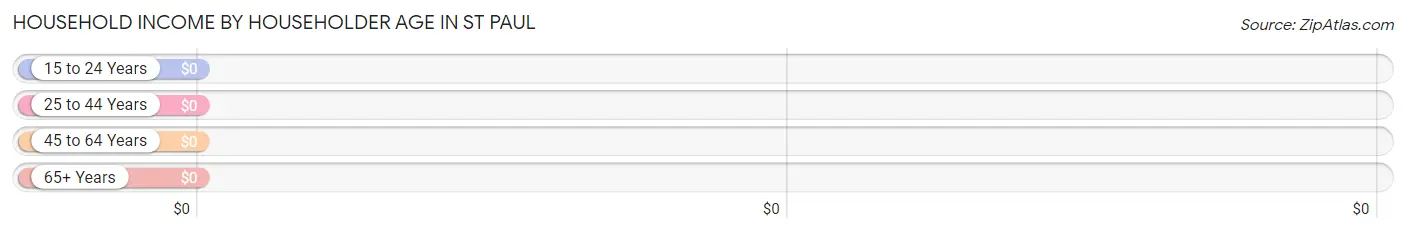
| Income Bracket | # Households | Median Income |
| 15 to 24 Years | 2 (4.0%) | $0 |
| 25 to 44 Years | 7 (14.0%) | $0 |
| 45 to 64 Years | 13 (26.0%) | $0 |
| 65+ Years | 28 (56.0%) | $0 |
| Total | 50 (100.0%) | $40,625 |
Poverty in St Paul
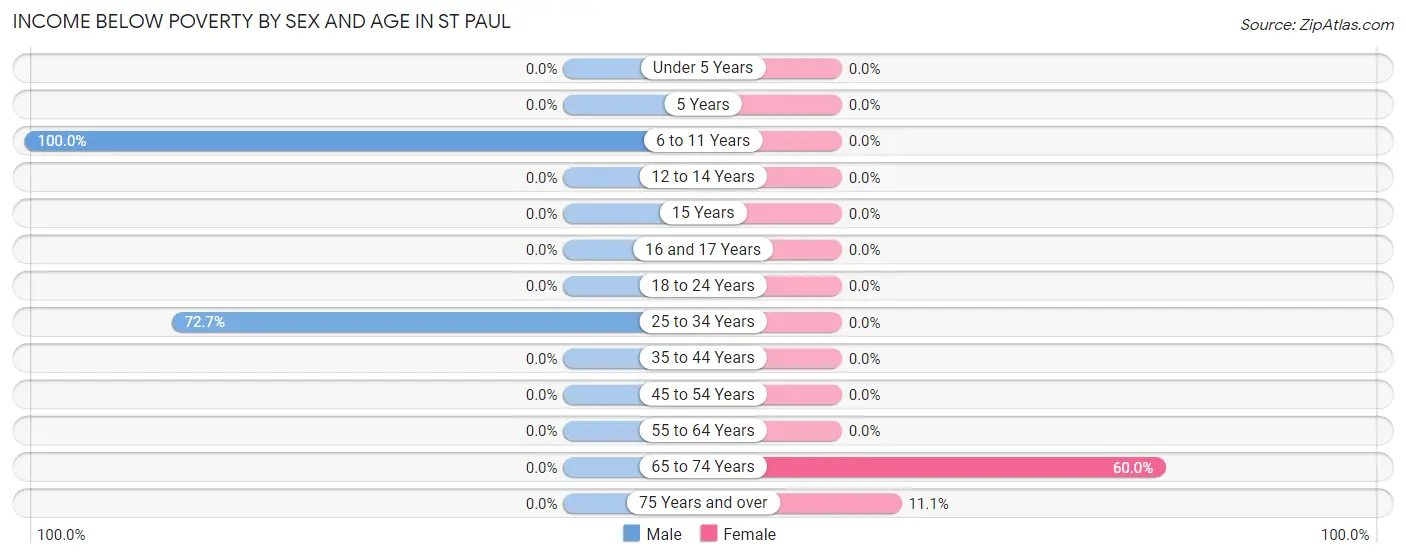
Income Below Poverty by Sex and Age in St Paul
With 17.4% poverty level for males and 13.0% for females among the residents of St Paul, 6 to 11 year old males and 65 to 74 year old females are the most vulnerable to poverty, with 4 males (100.0%) and 6 females (60.0%) in their respective age groups living below the poverty level.
| Age Bracket | Male | Female |
| Under 5 Years | 0 (0.0%) | 0 (0.0%) |
| 5 Years | 0 (0.0%) | 0 (0.0%) |
| 6 to 11 Years | 4 (100.0%) | 0 (0.0%) |
| 12 to 14 Years | 0 (0.0%) | 0 (0.0%) |
| 15 Years | 0 (0.0%) | 0 (0.0%) |
| 16 and 17 Years | 0 (0.0%) | 0 (0.0%) |
| 18 to 24 Years | 0 (0.0%) | 0 (0.0%) |
| 25 to 34 Years | 8 (72.7%) | 0 (0.0%) |
| 35 to 44 Years | 0 (0.0%) | 0 (0.0%) |
| 45 to 54 Years | 0 (0.0%) | 0 (0.0%) |
| 55 to 64 Years | 0 (0.0%) | 0 (0.0%) |
| 65 to 74 Years | 0 (0.0%) | 6 (60.0%) |
| 75 Years and over | 0 (0.0%) | 1 (11.1%) |
| Total | 12 (17.4%) | 7 (13.0%) |
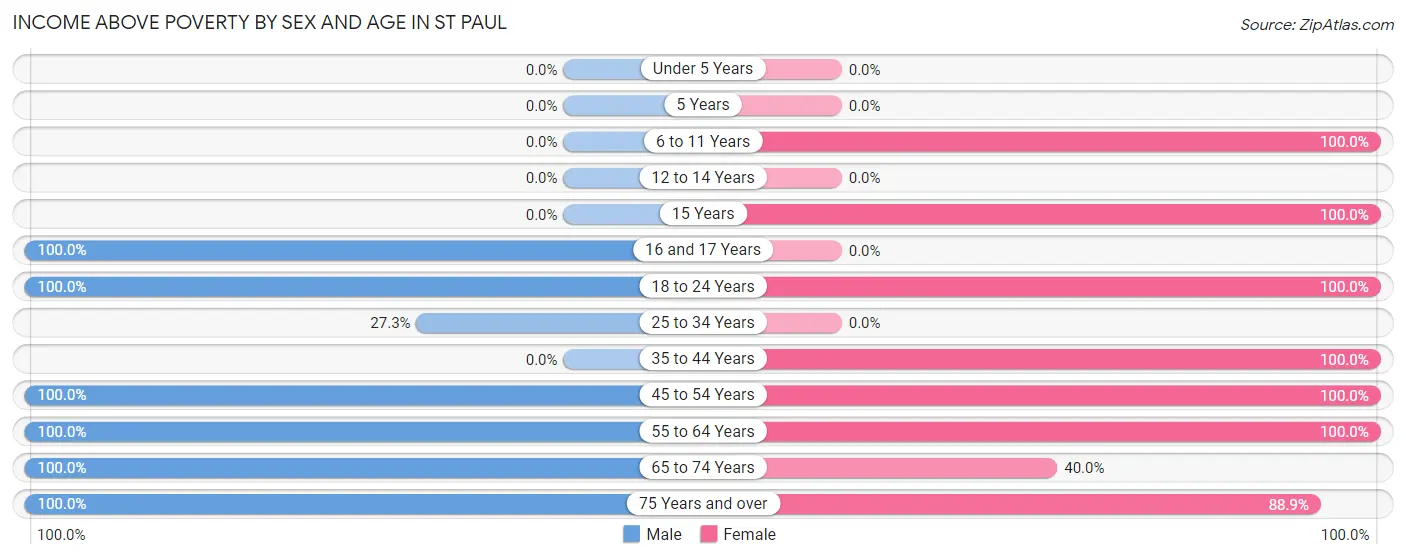
Income Above Poverty by Sex and Age in St Paul
According to the poverty statistics in St Paul, males aged 16 and 17 years and females aged 6 to 11 years are the age groups that are most secure financially, with 100.0% of males and 100.0% of females in these age groups living above the poverty line.
| Age Bracket | Male | Female |
| Under 5 Years | 0 (0.0%) | 0 (0.0%) |
| 5 Years | 0 (0.0%) | 0 (0.0%) |
| 6 to 11 Years | 0 (0.0%) | 6 (100.0%) |
| 12 to 14 Years | 0 (0.0%) | 0 (0.0%) |
| 15 Years | 0 (0.0%) | 4 (100.0%) |
| 16 and 17 Years | 6 (100.0%) | 0 (0.0%) |
| 18 to 24 Years | 15 (100.0%) | 2 (100.0%) |
| 25 to 34 Years | 3 (27.3%) | 0 (0.0%) |
| 35 to 44 Years | 0 (0.0%) | 4 (100.0%) |
| 45 to 54 Years | 7 (100.0%) | 18 (100.0%) |
| 55 to 64 Years | 6 (100.0%) | 1 (100.0%) |
| 65 to 74 Years | 10 (100.0%) | 4 (40.0%) |
| 75 Years and over | 10 (100.0%) | 8 (88.9%) |
| Total | 57 (82.6%) | 47 (87.0%) |
Income Below Poverty Among Married-Couple Families in St Paul
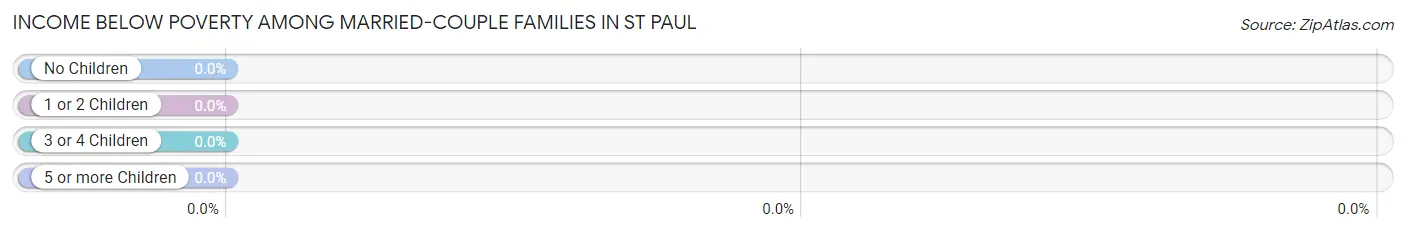
| Children | Above Poverty | Below Poverty |
| No Children | 18 (100.0%) | 0 (0.0%) |
| 1 or 2 Children | 4 (100.0%) | 0 (0.0%) |
| 3 or 4 Children | 0 (0.0%) | 0 (0.0%) |
| 5 or more Children | 0 (0.0%) | 0 (0.0%) |
| Total | 22 (100.0%) | 0 (0.0%) |
Income Below Poverty Among Single-Parent Households in St Paul
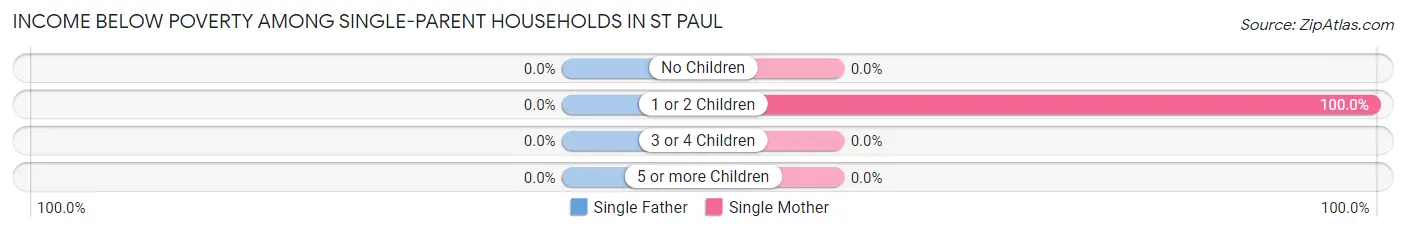
| Children | Single Father | Single Mother |
| No Children | 0 (0.0%) | 0 (0.0%) |
| 1 or 2 Children | 0 (0.0%) | 6 (100.0%) |
| 3 or 4 Children | 0 (0.0%) | 0 (0.0%) |
| 5 or more Children | 0 (0.0%) | 0 (0.0%) |
| Total | 0 (0.0%) | 6 (60.0%) |
Income Below Poverty Among Married-Couple vs Single-Parent Households in St Paul
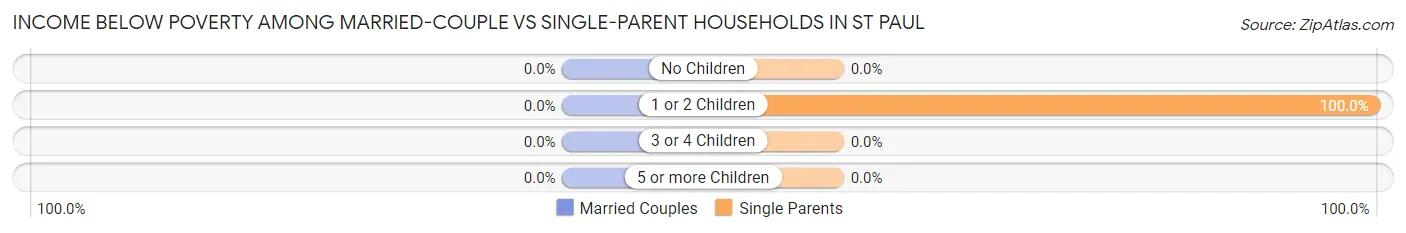
| Children | Married-Couple Families | Single-Parent Households |
| No Children | 0 (0.0%) | 0 (0.0%) |
| 1 or 2 Children | 0 (0.0%) | 6 (100.0%) |
| 3 or 4 Children | 0 (0.0%) | 0 (0.0%) |
| 5 or more Children | 0 (0.0%) | 0 (0.0%) |
| Total | 0 (0.0%) | 6 (50.0%) |
Race in St Paul
The most populous races in St Paul are White / Caucasian (105 | 85.4%), Two or more Races (18 | 14.6%), and Hispanic or Latino (12 | 9.8%).
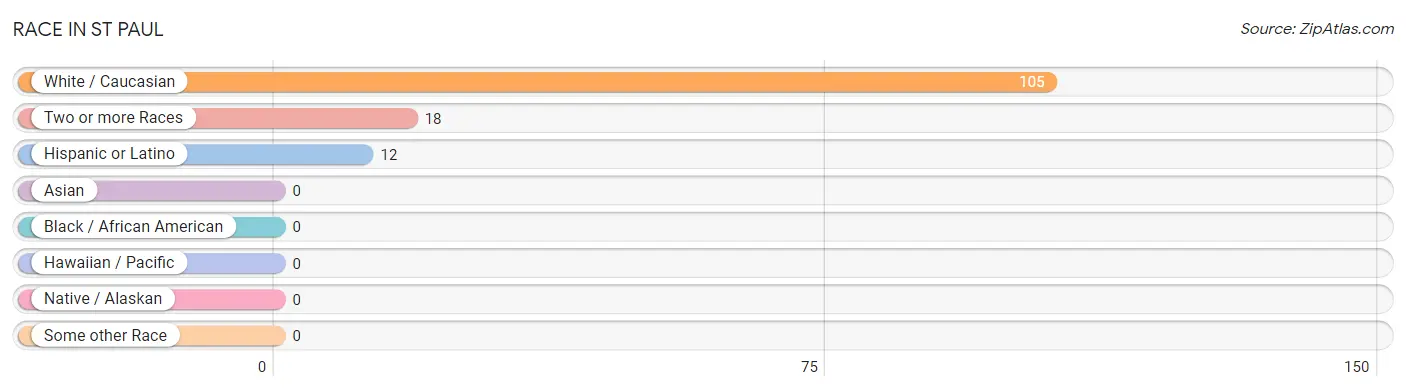
| Race | # Population | % Population |
| Asian | 0 | 0.0% |
| Black / African American | 0 | 0.0% |
| Hawaiian / Pacific | 0 | 0.0% |
| Hispanic or Latino | 12 | 9.8% |
| Native / Alaskan | 0 | 0.0% |
| White / Caucasian | 105 | 85.4% |
| Two or more Races | 18 | 14.6% |
| Some other Race | 0 | 0.0% |
| Total | 123 | 100.0% |
Ancestry in St Paul
The most populous ancestries reported in St Paul are Irish (23 | 18.7%), Mexican (12 | 9.8%), German (9 | 7.3%), American (8 | 6.5%), and Italian (7 | 5.7%), together accounting for 48.0% of all St Paul residents.
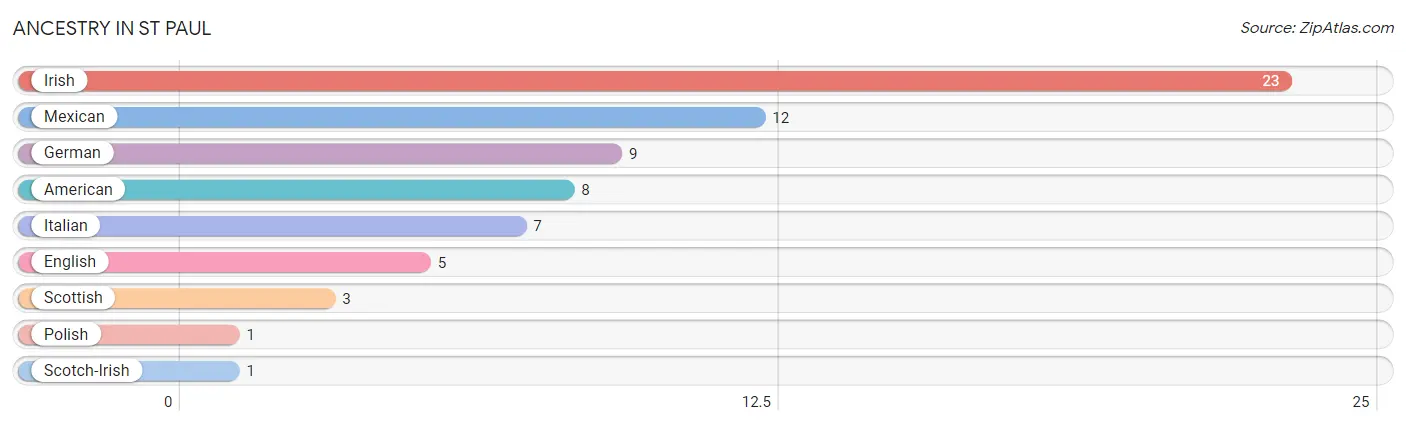
| Ancestry | # Population | % Population |
| American | 8 | 6.5% |
| English | 5 | 4.1% |
| German | 9 | 7.3% |
| Irish | 23 | 18.7% |
| Italian | 7 | 5.7% |
| Mexican | 12 | 9.8% |
| Polish | 1 | 0.8% |
| Scotch-Irish | 1 | 0.8% |
| Scottish | 3 | 2.4% | View All 9 Rows |
Immigrants in St Paul
The most numerous immigrant groups reported in St Paul came from Europe (5 | 4.1%), Germany (5 | 4.1%), and Western Europe (5 | 4.1%), together accounting for 12.2% of all St Paul residents.
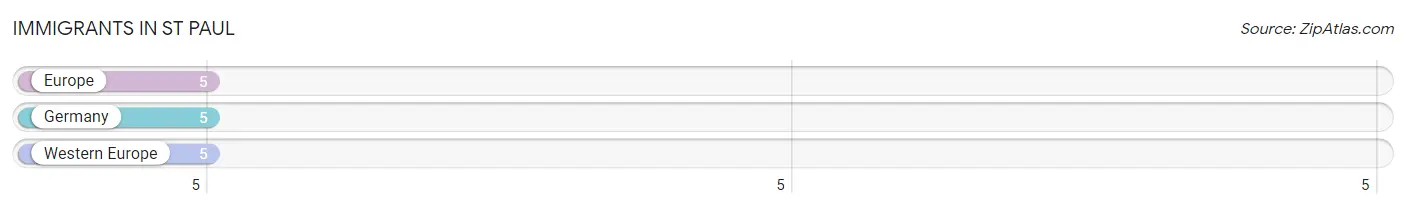
| Immigration Origin | # Population | % Population |
| Europe | 5 | 4.1% |
| Germany | 5 | 4.1% |
| Western Europe | 5 | 4.1% | View All 3 Rows |
Sex and Age in St Paul
Sex and Age in St Paul
The most populous age groups in St Paul are 15 to 19 Years (14 | 20.3%) for men and 45 to 49 Years (10 | 18.5%) for women.
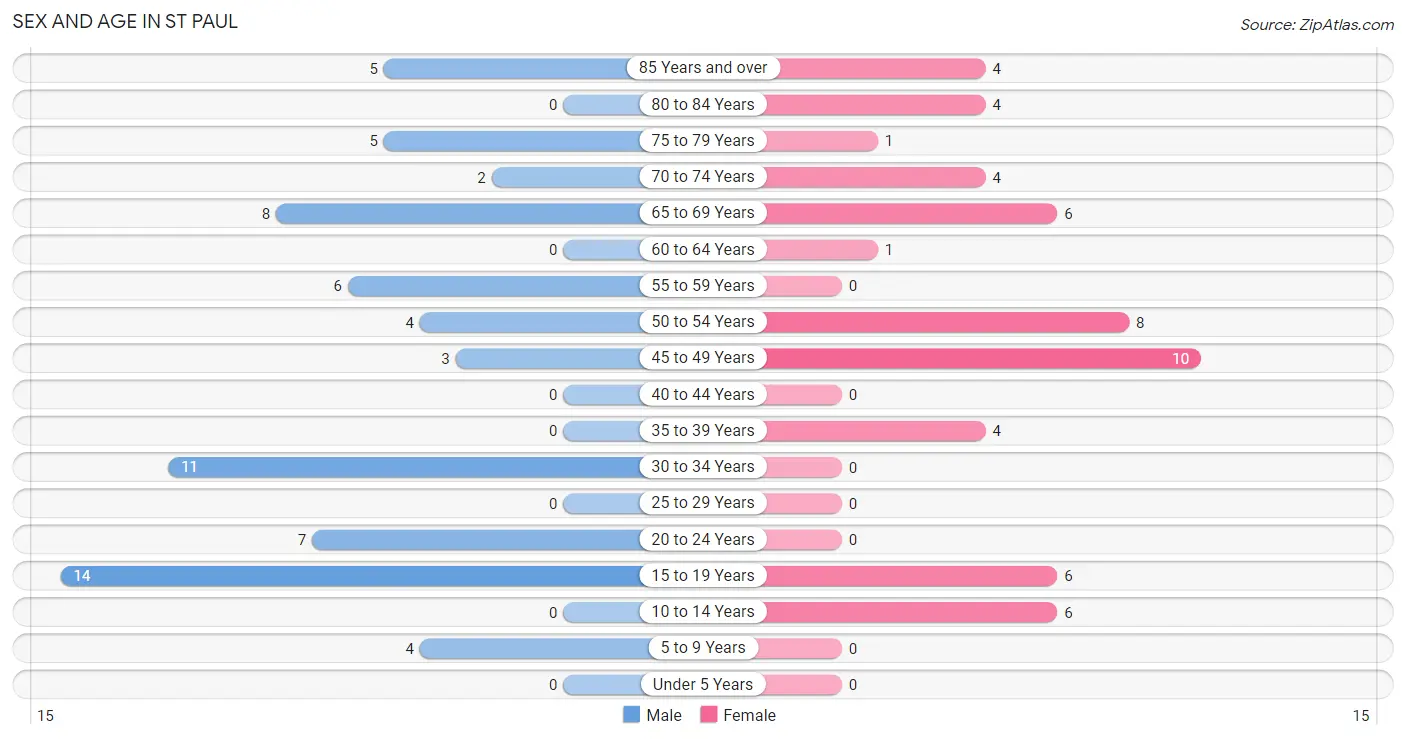
| Age Bracket | Male | Female |
| Under 5 Years | 0 (0.0%) | 0 (0.0%) |
| 5 to 9 Years | 4 (5.8%) | 0 (0.0%) |
| 10 to 14 Years | 0 (0.0%) | 6 (11.1%) |
| 15 to 19 Years | 14 (20.3%) | 6 (11.1%) |
| 20 to 24 Years | 7 (10.1%) | 0 (0.0%) |
| 25 to 29 Years | 0 (0.0%) | 0 (0.0%) |
| 30 to 34 Years | 11 (15.9%) | 0 (0.0%) |
| 35 to 39 Years | 0 (0.0%) | 4 (7.4%) |
| 40 to 44 Years | 0 (0.0%) | 0 (0.0%) |
| 45 to 49 Years | 3 (4.3%) | 10 (18.5%) |
| 50 to 54 Years | 4 (5.8%) | 8 (14.8%) |
| 55 to 59 Years | 6 (8.7%) | 0 (0.0%) |
| 60 to 64 Years | 0 (0.0%) | 1 (1.8%) |
| 65 to 69 Years | 8 (11.6%) | 6 (11.1%) |
| 70 to 74 Years | 2 (2.9%) | 4 (7.4%) |
| 75 to 79 Years | 5 (7.2%) | 1 (1.8%) |
| 80 to 84 Years | 0 (0.0%) | 4 (7.4%) |
| 85 Years and over | 5 (7.2%) | 4 (7.4%) |
| Total | 69 (100.0%) | 54 (100.0%) |
Families and Households in St Paul
Median Family Size in St Paul
The median family size in St Paul is 3.09 persons per family, with single female/mother families (10 | 29.4%) accounting for the largest median family size of 3.4 persons per family. On the other hand, single male/father families (2 | 5.9%) represent the smallest median family size with 1.50 persons per family.
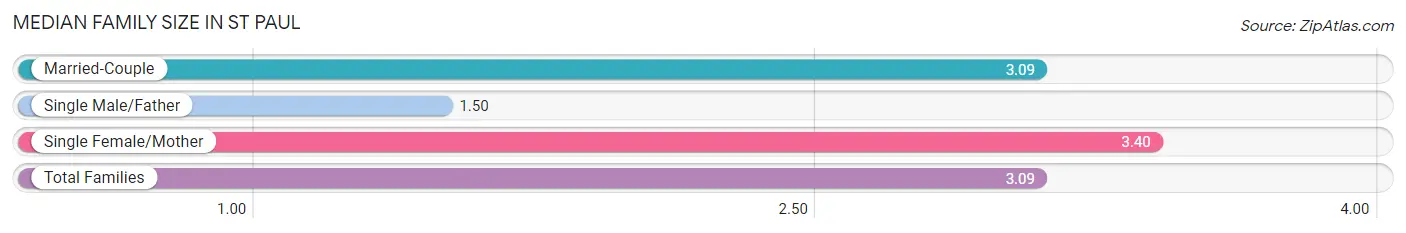
| Family Type | # Families | Family Size |
| Married-Couple | 22 (64.7%) | 3.09 |
| Single Male/Father | 2 (5.9%) | 1.50 |
| Single Female/Mother | 10 (29.4%) | 3.40 |
| Total Families | 34 (100.0%) | 3.09 |
Median Household Size in St Paul
The median household size in St Paul is 2.46 persons per household, with single female/mother households (10 | 20.0%) accounting for the largest median household size of 3.4 persons per household. non-family households (16 | 32.0%) represent the smallest median household size with 1.13 persons per household.
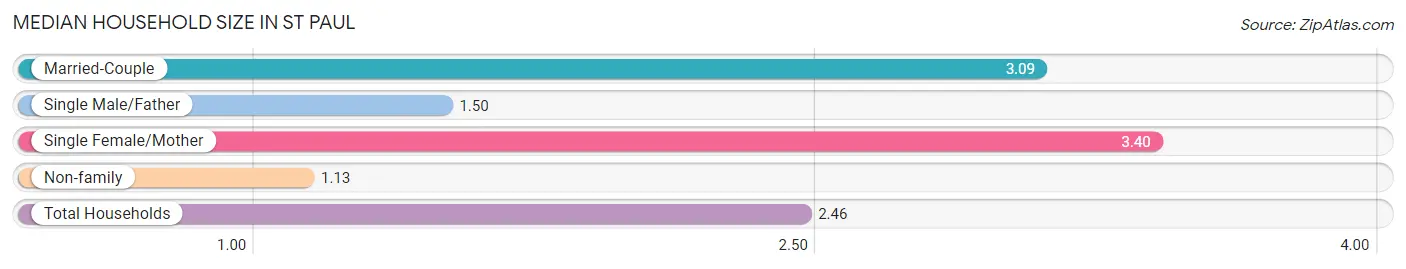
| Household Type | # Households | Household Size |
| Married-Couple | 22 (44.0%) | 3.09 |
| Single Male/Father | 2 (4.0%) | 1.50 |
| Single Female/Mother | 10 (20.0%) | 3.40 |
| Non-family | 16 (32.0%) | 1.13 |
| Total Households | 50 (100.0%) | 2.46 |
Household Size by Marriage Status in St Paul
Out of a total of 50 households in St Paul, 34 (68.0%) are family households, while 16 (32.0%) are nonfamily households. The most numerous type of family households are 3-person households, comprising 16, and the most common type of nonfamily households are 1-person households, comprising 14.
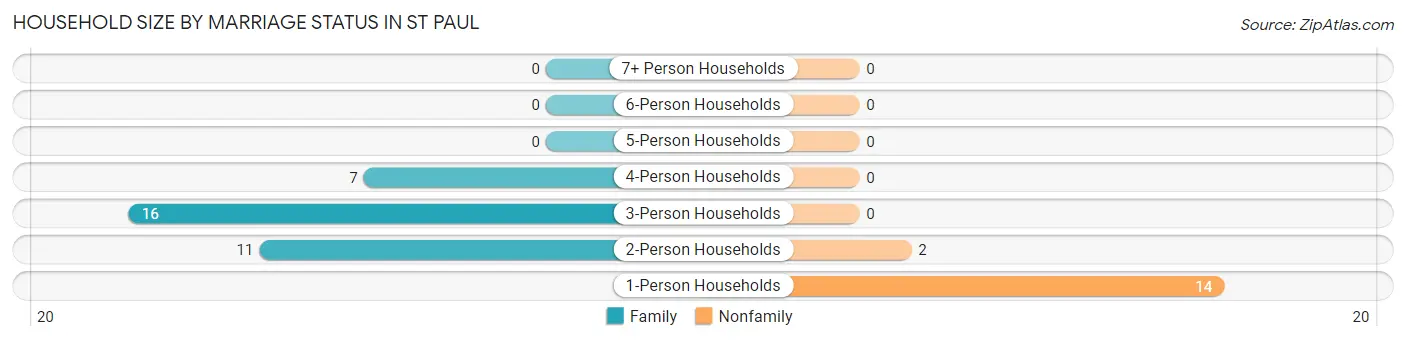
| Household Size | Family Households | Nonfamily Households |
| 1-Person Households | - | 14 (28.0%) |
| 2-Person Households | 11 (22.0%) | 2 (4.0%) |
| 3-Person Households | 16 (32.0%) | 0 (0.0%) |
| 4-Person Households | 7 (14.0%) | 0 (0.0%) |
| 5-Person Households | 0 (0.0%) | 0 (0.0%) |
| 6-Person Households | 0 (0.0%) | 0 (0.0%) |
| 7+ Person Households | 0 (0.0%) | 0 (0.0%) |
| Total | 34 (68.0%) | 16 (32.0%) |
Female Fertility in St Paul
Fertility by Age in St Paul
| Age Bracket | Women with Births | Births / 1,000 Women |
| 15 to 19 years | 0 (0.0%) | 0.0 |
| 20 to 34 years | 0 (0.0%) | 0.0 |
| 35 to 50 years | 0 (0.0%) | 0.0 |
| Total | 0 (0.0%) | 0.0 |
Fertility by Age by Marriage Status in St Paul
| Age Bracket | Married | Unmarried |
| 15 to 19 years | 0 (0.0%) | 0 (0.0%) |
| 20 to 34 years | 0 (0.0%) | 0 (0.0%) |
| 35 to 50 years | 0 (0.0%) | 0 (0.0%) |
| Total | 0 (0.0%) | 0 (0.0%) |
Fertility by Education in St Paul
| Educational Attainment | Women with Births | Births / 1,000 Women |
| Less than High School | 0 (0.0%) | 0.0 |
| High School Diploma | 0 (0.0%) | 0.0 |
| College or Associate's Degree | 0 (0.0%) | 0.0 |
| Bachelor's Degree | 0 (0.0%) | 0.0 |
| Graduate Degree | 0 (0.0%) | 0.0 |
| Total | 0 (0.0%) | 0.0 |
Fertility by Education by Marriage Status in St Paul
| Educational Attainment | Married | Unmarried |
| Less than High School | 0 (0.0%) | 0 (0.0%) |
| High School Diploma | 0 (0.0%) | 0 (0.0%) |
| College or Associate's Degree | 0 (0.0%) | 0 (0.0%) |
| Bachelor's Degree | 0 (0.0%) | 0 (0.0%) |
| Graduate Degree | 0 (0.0%) | 0 (0.0%) |
| Total | 0 (0.0%) | 0 (0.0%) |
Employment Characteristics in St Paul
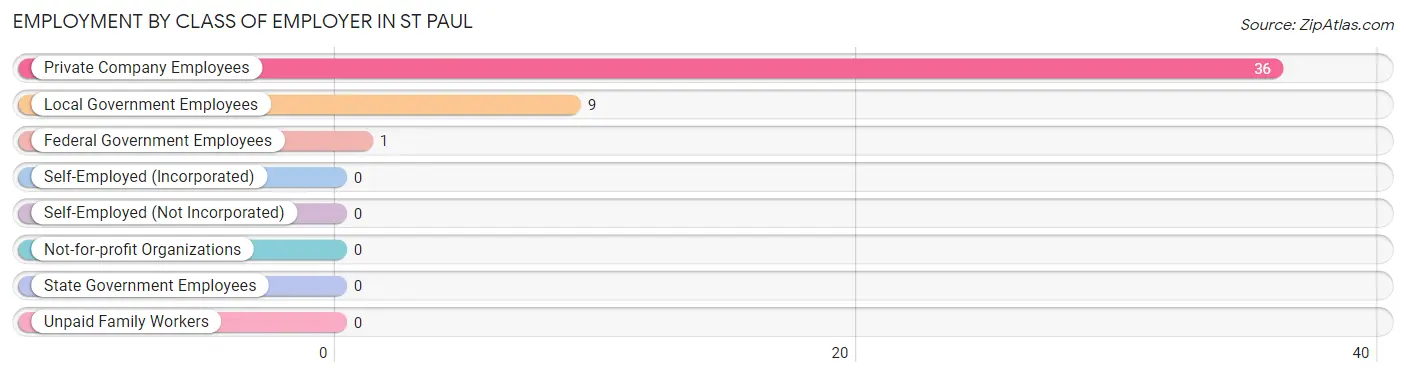
Employment by Class of Employer in St Paul
Among the 46 employed individuals in St Paul, private company employees (36 | 78.3%), local government employees (9 | 19.6%), and federal government employees (1 | 2.2%) make up the most common classes of employment.
| Employer Class | # Employees | % Employees |
| Private Company Employees | 36 | 78.3% |
| Self-Employed (Incorporated) | 0 | 0.0% |
| Self-Employed (Not Incorporated) | 0 | 0.0% |
| Not-for-profit Organizations | 0 | 0.0% |
| Local Government Employees | 9 | 19.6% |
| State Government Employees | 0 | 0.0% |
| Federal Government Employees | 1 | 2.2% |
| Unpaid Family Workers | 0 | 0.0% |
| Total | 46 | 100.0% |
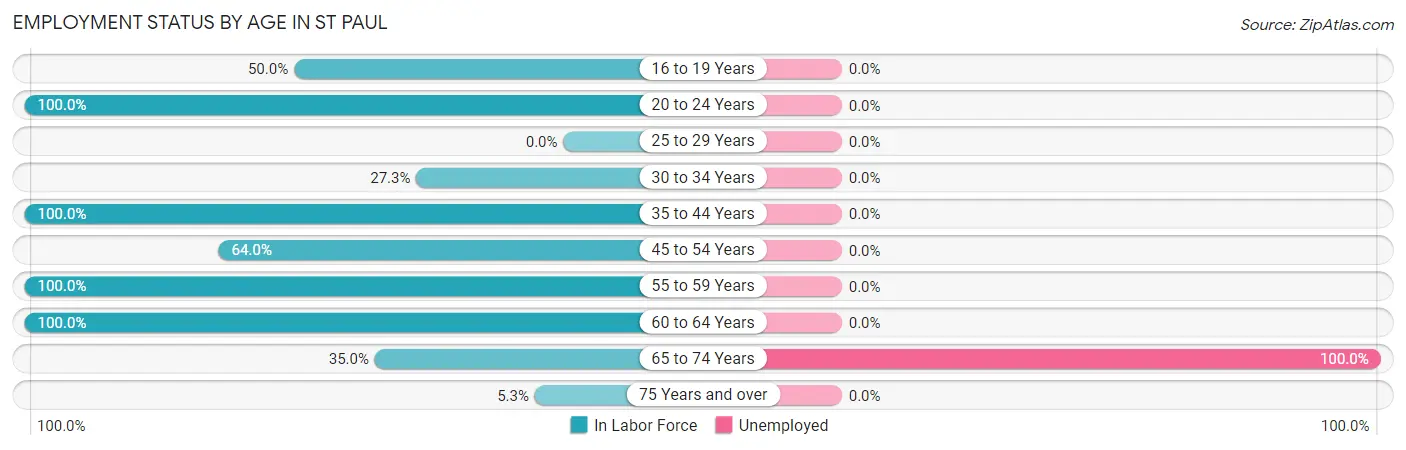
Employment Status by Age in St Paul
According to the labor force statistics for St Paul, out of the total population over 16 years of age (109), 48.6% or 53 individuals are in the labor force, with 13.2% or 7 of them unemployed. The age group with the highest labor force participation rate is 20 to 24 years, with 100.0% or 7 individuals in the labor force. Within the labor force, the 65 to 74 years age range has the highest percentage of unemployed individuals, with 100.0% or 7 of them being unemployed.
| Age Bracket | In Labor Force | Unemployed |
| 16 to 19 Years | 8 (50.0%) | 0 (0.0%) |
| 20 to 24 Years | 7 (100.0%) | 0 (0.0%) |
| 25 to 29 Years | 0 (0.0%) | 0 (0.0%) |
| 30 to 34 Years | 3 (27.3%) | 0 (0.0%) |
| 35 to 44 Years | 4 (100.0%) | 0 (0.0%) |
| 45 to 54 Years | 16 (64.0%) | 0 (0.0%) |
| 55 to 59 Years | 6 (100.0%) | 0 (0.0%) |
| 60 to 64 Years | 1 (100.0%) | 0 (0.0%) |
| 65 to 74 Years | 7 (35.0%) | 7 (100.0%) |
| 75 Years and over | 1 (5.3%) | 0 (0.0%) |
| Total | 53 (48.6%) | 7 (13.2%) |
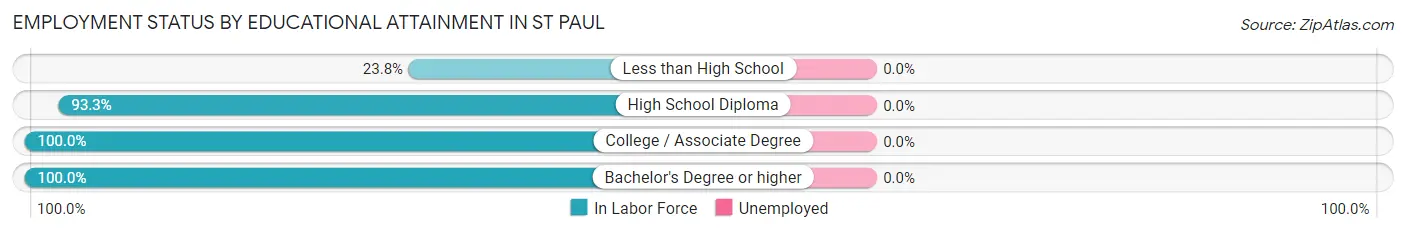
Employment Status by Educational Attainment in St Paul
| Educational Attainment | In Labor Force | Unemployed |
| Less than High School | 5 (23.8%) | 0 (0.0%) |
| High School Diploma | 14 (93.3%) | 0 (0.0%) |
| College / Associate Degree | 4 (100.0%) | 0 (0.0%) |
| Bachelor's Degree or higher | 7 (100.0%) | 0 (0.0%) |
| Total | 30 (63.8%) | 0 (0.0%) |
Employment Occupations by Sex in St Paul
Management, Business, Science and Arts Occupations
The most common Management, Business, Science and Arts occupations in St Paul are , and Management (2 | 4.3%).
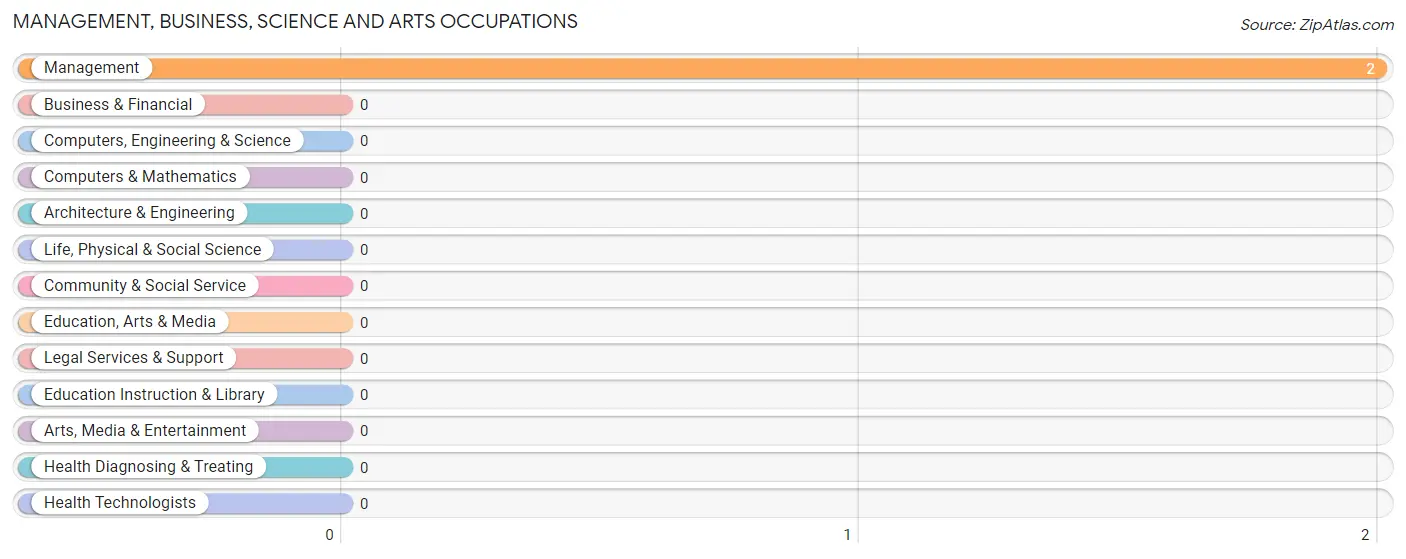
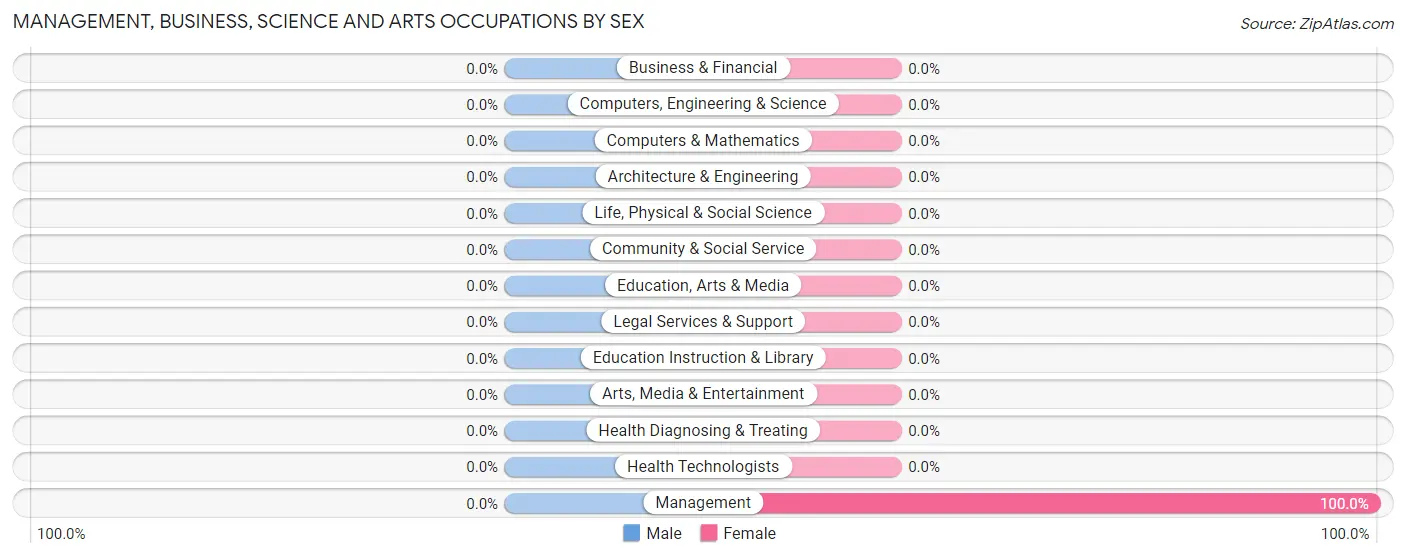
Management, Business, Science and Arts Occupations by Sex
| Occupation | Male | Female |
| Management | 0 (0.0%) | 2 (100.0%) |
| Business & Financial | 0 (0.0%) | 0 (0.0%) |
| Computers, Engineering & Science | 0 (0.0%) | 0 (0.0%) |
| Computers & Mathematics | 0 (0.0%) | 0 (0.0%) |
| Architecture & Engineering | 0 (0.0%) | 0 (0.0%) |
| Life, Physical & Social Science | 0 (0.0%) | 0 (0.0%) |
| Community & Social Service | 0 (0.0%) | 0 (0.0%) |
| Education, Arts & Media | 0 (0.0%) | 0 (0.0%) |
| Legal Services & Support | 0 (0.0%) | 0 (0.0%) |
| Education Instruction & Library | 0 (0.0%) | 0 (0.0%) |
| Arts, Media & Entertainment | 0 (0.0%) | 0 (0.0%) |
| Health Diagnosing & Treating | 0 (0.0%) | 0 (0.0%) |
| Health Technologists | 0 (0.0%) | 0 (0.0%) |
| Total (Category) | 0 (0.0%) | 2 (100.0%) |
| Total (Overall) | 31 (67.4%) | 15 (32.6%) |
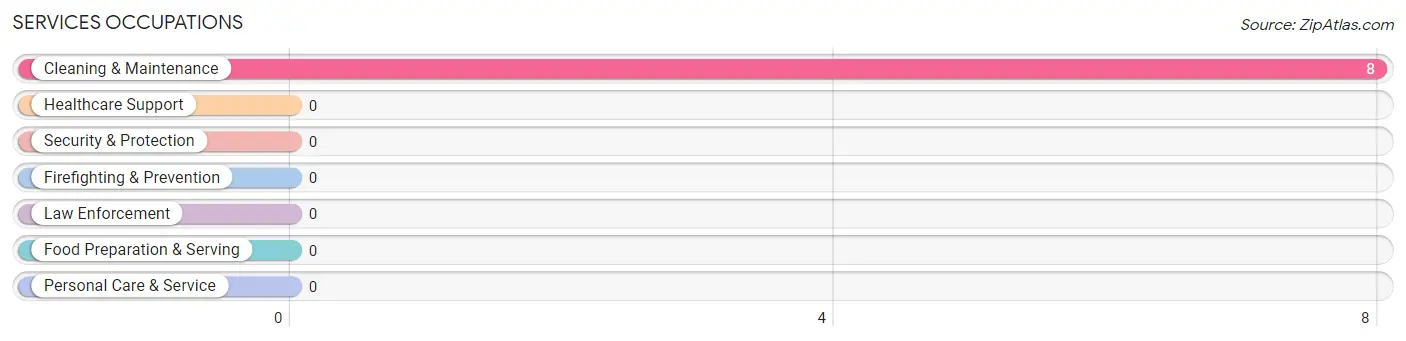
Services Occupations
The most common Services occupations in St Paul are , and Cleaning & Maintenance (8 | 17.4%).
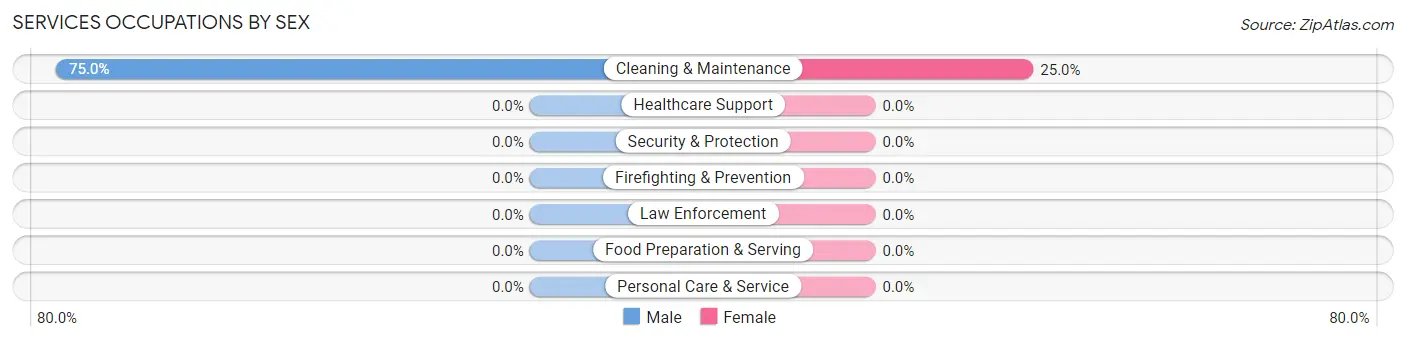
Services Occupations by Sex
| Occupation | Male | Female |
| Healthcare Support | 0 (0.0%) | 0 (0.0%) |
| Security & Protection | 0 (0.0%) | 0 (0.0%) |
| Firefighting & Prevention | 0 (0.0%) | 0 (0.0%) |
| Law Enforcement | 0 (0.0%) | 0 (0.0%) |
| Food Preparation & Serving | 0 (0.0%) | 0 (0.0%) |
| Cleaning & Maintenance | 6 (75.0%) | 2 (25.0%) |
| Personal Care & Service | 0 (0.0%) | 0 (0.0%) |
| Total (Category) | 6 (75.0%) | 2 (25.0%) |
| Total (Overall) | 31 (67.4%) | 15 (32.6%) |
Sales and Office Occupations
Sales and Office Occupations by Sex
| Occupation | Male | Female |
| Sales & Related | 0 (0.0%) | 0 (0.0%) |
| Office & Administration | 0 (0.0%) | 0 (0.0%) |
| Total (Category) | 0 (0.0%) | 0 (0.0%) |
| Total (Overall) | 31 (67.4%) | 15 (32.6%) |
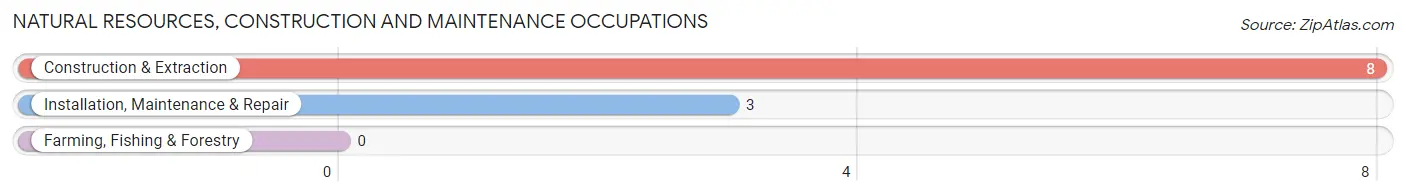
Natural Resources, Construction and Maintenance Occupations
The most common Natural Resources, Construction and Maintenance occupations in St Paul are Construction & Extraction (8 | 17.4%), and Installation, Maintenance & Repair (3 | 6.5%).
Natural Resources, Construction and Maintenance Occupations by Sex
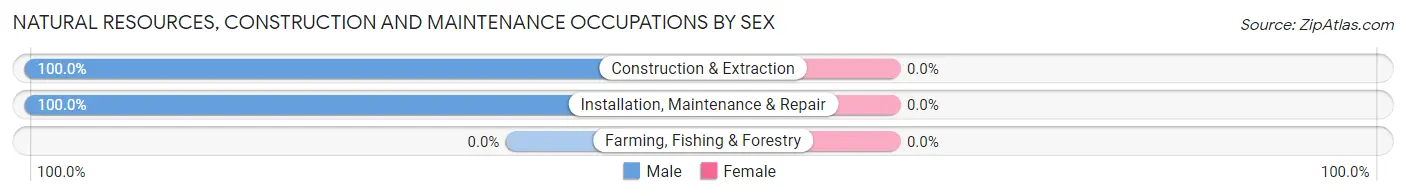
| Occupation | Male | Female |
| Farming, Fishing & Forestry | 0 (0.0%) | 0 (0.0%) |
| Construction & Extraction | 8 (100.0%) | 0 (0.0%) |
| Installation, Maintenance & Repair | 3 (100.0%) | 0 (0.0%) |
| Total (Category) | 11 (100.0%) | 0 (0.0%) |
| Total (Overall) | 31 (67.4%) | 15 (32.6%) |
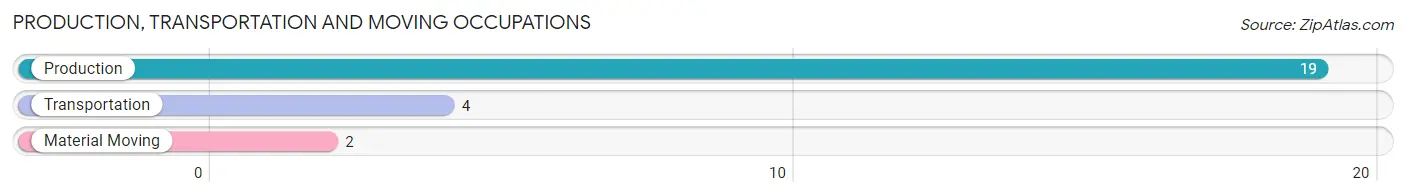
Production, Transportation and Moving Occupations
The most common Production, Transportation and Moving occupations in St Paul are Production (19 | 41.3%), Transportation (4 | 8.7%), and Material Moving (2 | 4.3%).
Production, Transportation and Moving Occupations by Sex
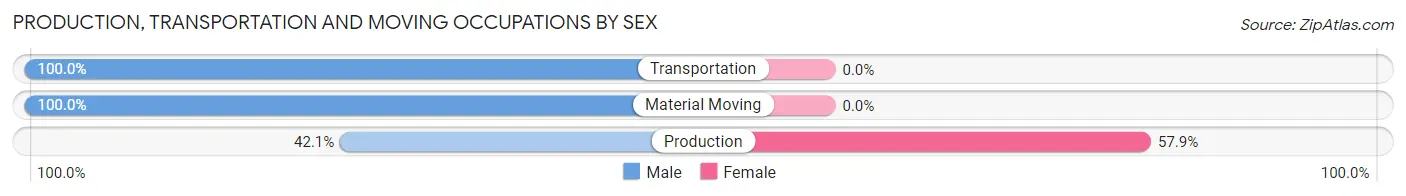
| Occupation | Male | Female |
| Production | 8 (42.1%) | 11 (57.9%) |
| Transportation | 4 (100.0%) | 0 (0.0%) |
| Material Moving | 2 (100.0%) | 0 (0.0%) |
| Total (Category) | 14 (56.0%) | 11 (44.0%) |
| Total (Overall) | 31 (67.4%) | 15 (32.6%) |
Employment Industries by Sex in St Paul
Employment Industries in St Paul
The major employment industries in St Paul include Manufacturing (19 | 41.3%), Utilities (8 | 17.4%), Administrative & Support (6 | 13.0%), Accommodation & Food Services (4 | 8.7%), and Construction (3 | 6.5%).

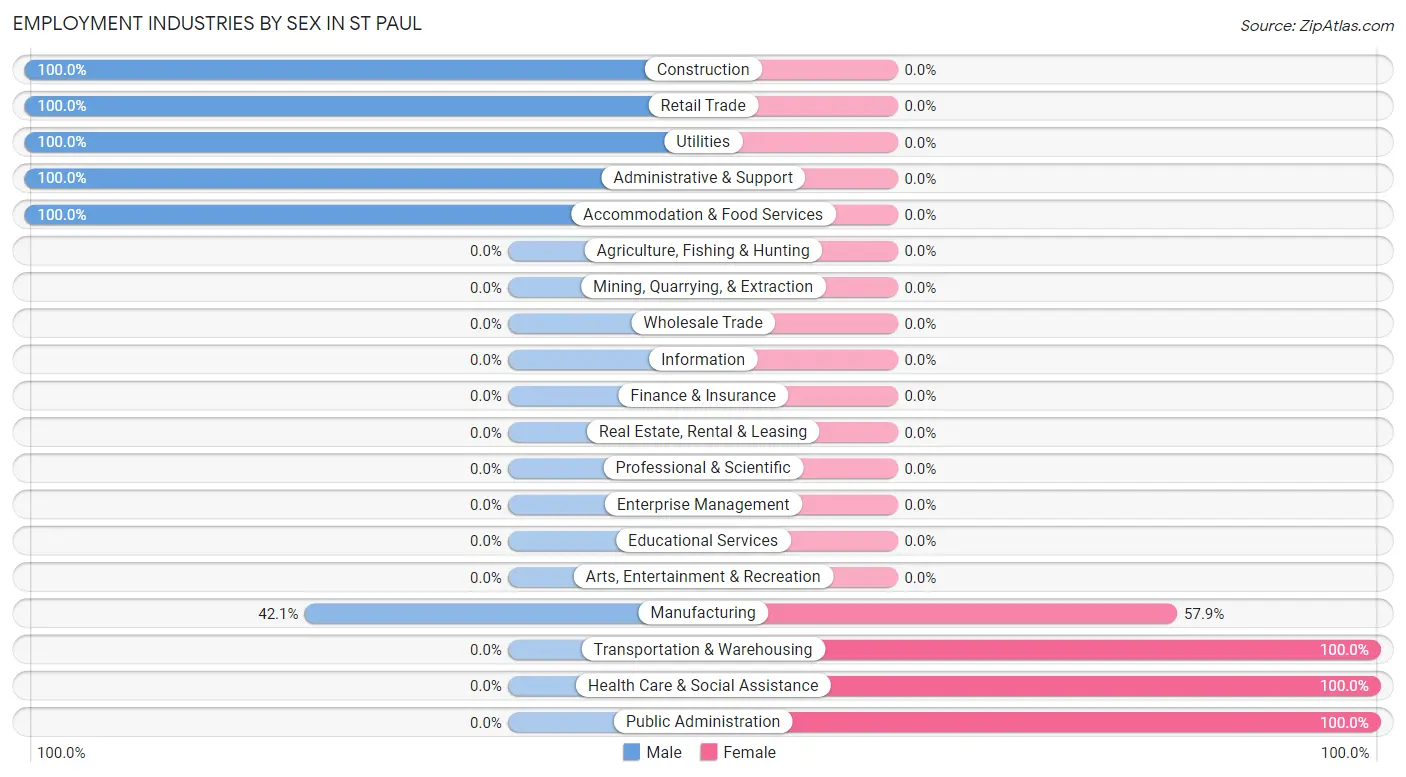
Employment Industries by Sex in St Paul
The St Paul industries that see more men than women are Construction (100.0%), Retail Trade (100.0%), and Utilities (100.0%), whereas the industries that tend to have a higher number of women are Transportation & Warehousing (100.0%), Health Care & Social Assistance (100.0%), and Public Administration (100.0%).
| Industry | Male | Female |
| Agriculture, Fishing & Hunting | 0 (0.0%) | 0 (0.0%) |
| Mining, Quarrying, & Extraction | 0 (0.0%) | 0 (0.0%) |
| Construction | 3 (100.0%) | 0 (0.0%) |
| Manufacturing | 8 (42.1%) | 11 (57.9%) |
| Wholesale Trade | 0 (0.0%) | 0 (0.0%) |
| Retail Trade | 2 (100.0%) | 0 (0.0%) |
| Transportation & Warehousing | 0 (0.0%) | 1 (100.0%) |
| Utilities | 8 (100.0%) | 0 (0.0%) |
| Information | 0 (0.0%) | 0 (0.0%) |
| Finance & Insurance | 0 (0.0%) | 0 (0.0%) |
| Real Estate, Rental & Leasing | 0 (0.0%) | 0 (0.0%) |
| Professional & Scientific | 0 (0.0%) | 0 (0.0%) |
| Enterprise Management | 0 (0.0%) | 0 (0.0%) |
| Administrative & Support | 6 (100.0%) | 0 (0.0%) |
| Educational Services | 0 (0.0%) | 0 (0.0%) |
| Health Care & Social Assistance | 0 (0.0%) | 2 (100.0%) |
| Arts, Entertainment & Recreation | 0 (0.0%) | 0 (0.0%) |
| Accommodation & Food Services | 4 (100.0%) | 0 (0.0%) |
| Public Administration | 0 (0.0%) | 1 (100.0%) |
| Total | 31 (67.4%) | 15 (32.6%) |
Education in St Paul
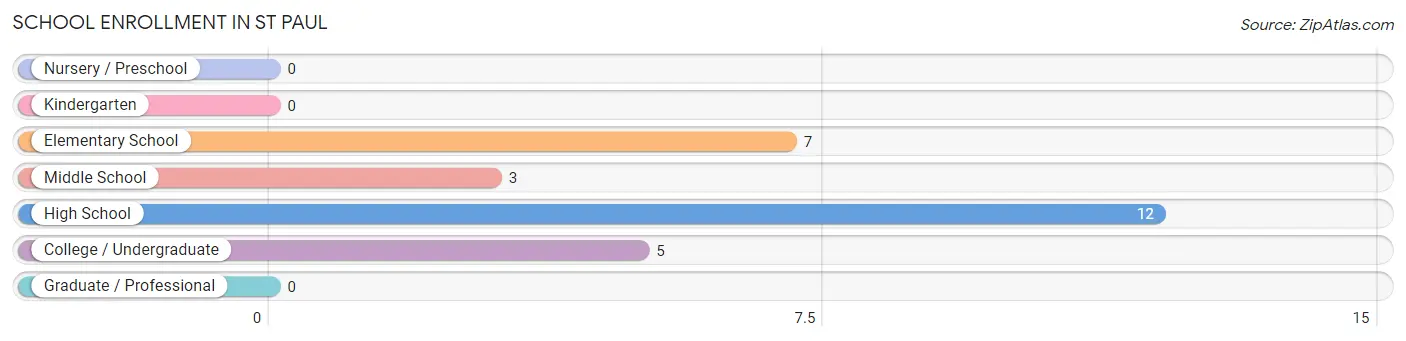
School Enrollment in St Paul
The most common levels of schooling among the 27 students in St Paul are high school (12 | 44.4%), elementary school (7 | 25.9%), and college / undergraduate (5 | 18.5%).
| School Level | # Students | % Students |
| Nursery / Preschool | 0 | 0.0% |
| Kindergarten | 0 | 0.0% |
| Elementary School | 7 | 25.9% |
| Middle School | 3 | 11.1% |
| High School | 12 | 44.4% |
| College / Undergraduate | 5 | 18.5% |
| Graduate / Professional | 0 | 0.0% |
| Total | 27 | 100.0% |
School Enrollment by Age by Funding Source in St Paul
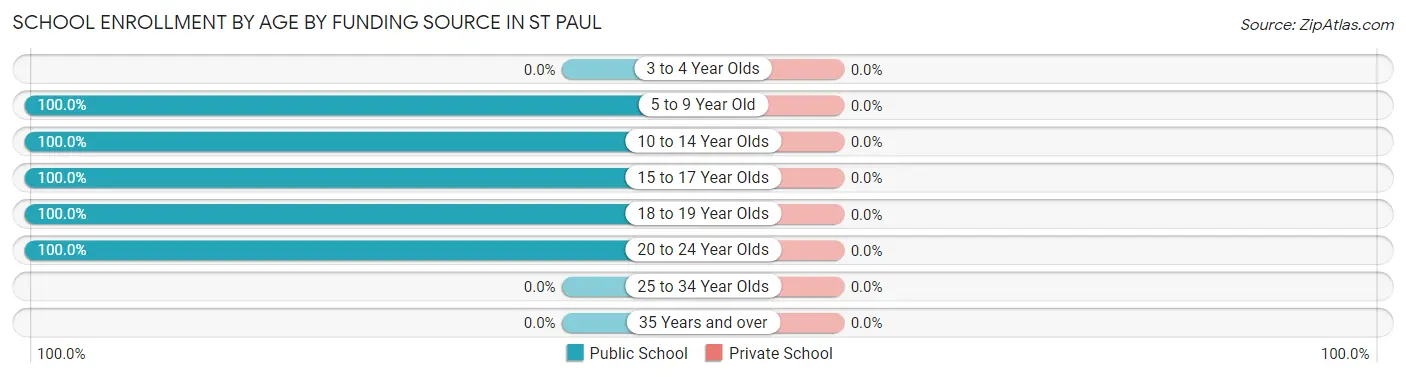
| Age Bracket | Public School | Private School |
| 3 to 4 Year Olds | 0 (0.0%) | 0 (0.0%) |
| 5 to 9 Year Old | 4 (100.0%) | 0 (0.0%) |
| 10 to 14 Year Olds | 6 (100.0%) | 0 (0.0%) |
| 15 to 17 Year Olds | 10 (100.0%) | 0 (0.0%) |
| 18 to 19 Year Olds | 2 (100.0%) | 0 (0.0%) |
| 20 to 24 Year Olds | 5 (100.0%) | 0 (0.0%) |
| 25 to 34 Year Olds | 0 (0.0%) | 0 (0.0%) |
| 35 Years and over | 0 (0.0%) | 0 (0.0%) |
| Total | 27 (100.0%) | 0 (0.0%) |
Educational Attainment by Field of Study in St Paul
Arts & humanities (11 | 84.6%), science & technology (1 | 7.7%), and education (1 | 7.7%) are the most common fields of study among 13 individuals in St Paul who have obtained a bachelor's degree or higher.
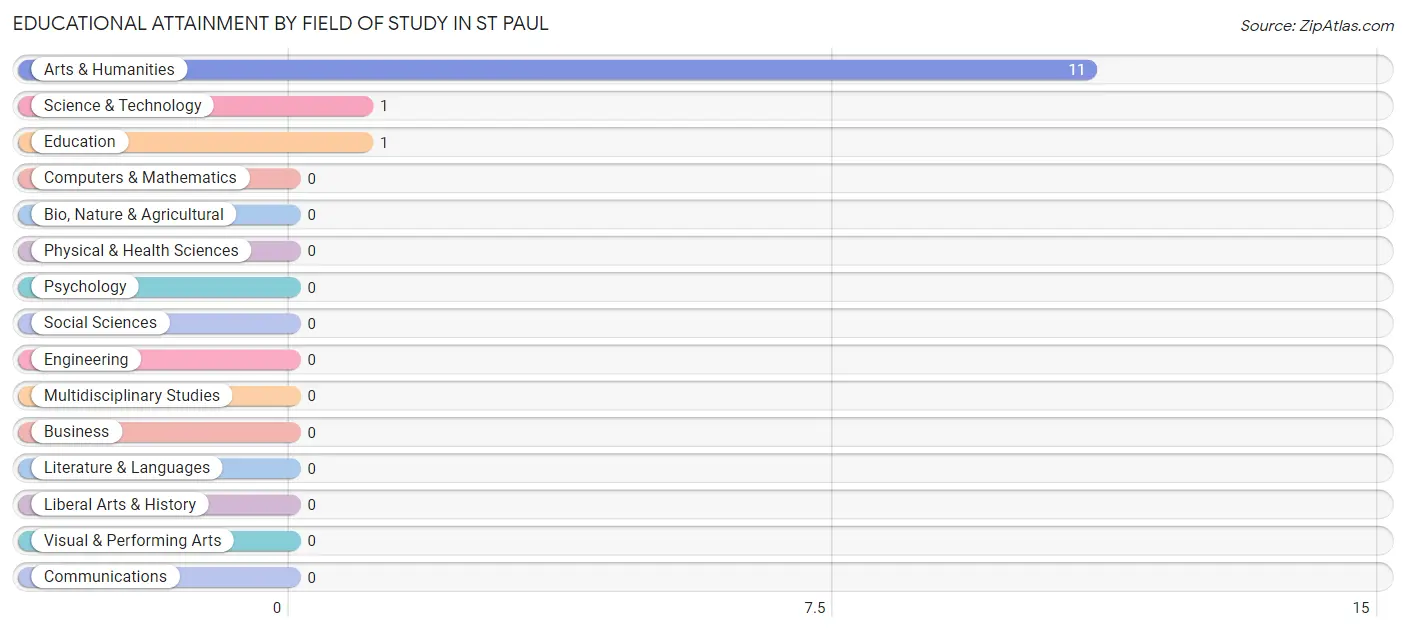
| Field of Study | # Graduates | % Graduates |
| Computers & Mathematics | 0 | 0.0% |
| Bio, Nature & Agricultural | 0 | 0.0% |
| Physical & Health Sciences | 0 | 0.0% |
| Psychology | 0 | 0.0% |
| Social Sciences | 0 | 0.0% |
| Engineering | 0 | 0.0% |
| Multidisciplinary Studies | 0 | 0.0% |
| Science & Technology | 1 | 7.7% |
| Business | 0 | 0.0% |
| Education | 1 | 7.7% |
| Literature & Languages | 0 | 0.0% |
| Liberal Arts & History | 0 | 0.0% |
| Visual & Performing Arts | 0 | 0.0% |
| Communications | 0 | 0.0% |
| Arts & Humanities | 11 | 84.6% |
| Total | 13 | 100.0% |
Transportation & Commute in St Paul
Vehicle Availability by Sex in St Paul
The most prevalent vehicle ownership categories in St Paul are males with 3 vehicles (14, accounting for 45.2%) and females with 3 vehicles (7, making up 93.3%).
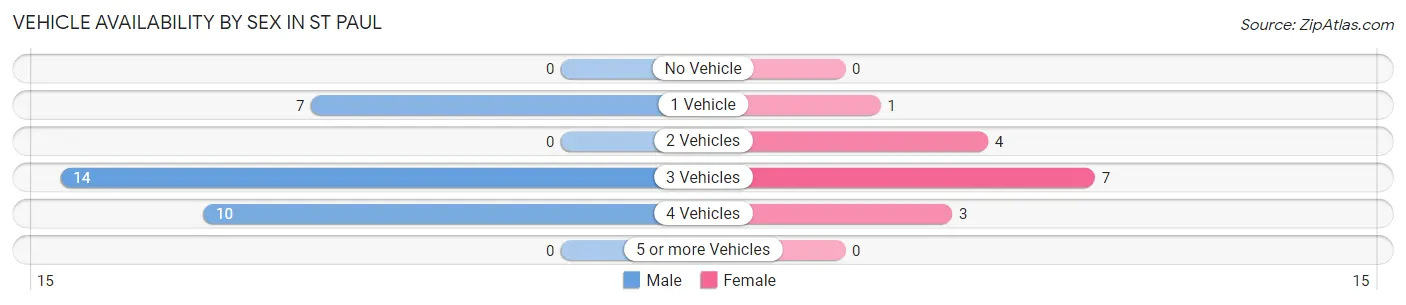
| Vehicles Available | Male | Female |
| No Vehicle | 0 (0.0%) | 0 (0.0%) |
| 1 Vehicle | 7 (22.6%) | 1 (6.7%) |
| 2 Vehicles | 0 (0.0%) | 4 (26.7%) |
| 3 Vehicles | 14 (45.2%) | 7 (46.7%) |
| 4 Vehicles | 10 (32.3%) | 3 (20.0%) |
| 5 or more Vehicles | 0 (0.0%) | 0 (0.0%) |
| Total | 31 (100.0%) | 15 (100.0%) |
Commute Time in St Paul
The most frequently occuring commute durations in St Paul are 60 to 89 minutes (23 commuters, 50.0%), 30 to 34 minutes (11 commuters, 23.9%), and 45 to 59 minutes (8 commuters, 17.4%).
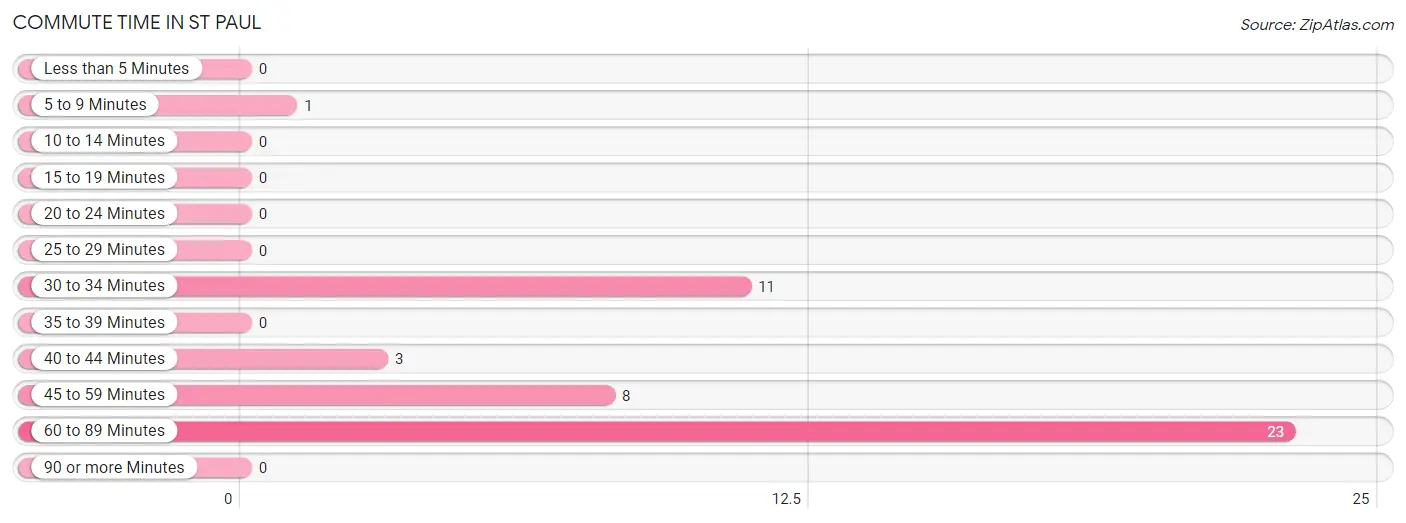
| Commute Time | # Commuters | % Commuters |
| Less than 5 Minutes | 0 | 0.0% |
| 5 to 9 Minutes | 1 | 2.2% |
| 10 to 14 Minutes | 0 | 0.0% |
| 15 to 19 Minutes | 0 | 0.0% |
| 20 to 24 Minutes | 0 | 0.0% |
| 25 to 29 Minutes | 0 | 0.0% |
| 30 to 34 Minutes | 11 | 23.9% |
| 35 to 39 Minutes | 0 | 0.0% |
| 40 to 44 Minutes | 3 | 6.5% |
| 45 to 59 Minutes | 8 | 17.4% |
| 60 to 89 Minutes | 23 | 50.0% |
| 90 or more Minutes | 0 | 0.0% |
Commute Time by Sex in St Paul
The most common commute times in St Paul are 60 to 89 minutes (20 commuters, 64.5%) for males and 30 to 34 minutes (11 commuters, 73.3%) for females.
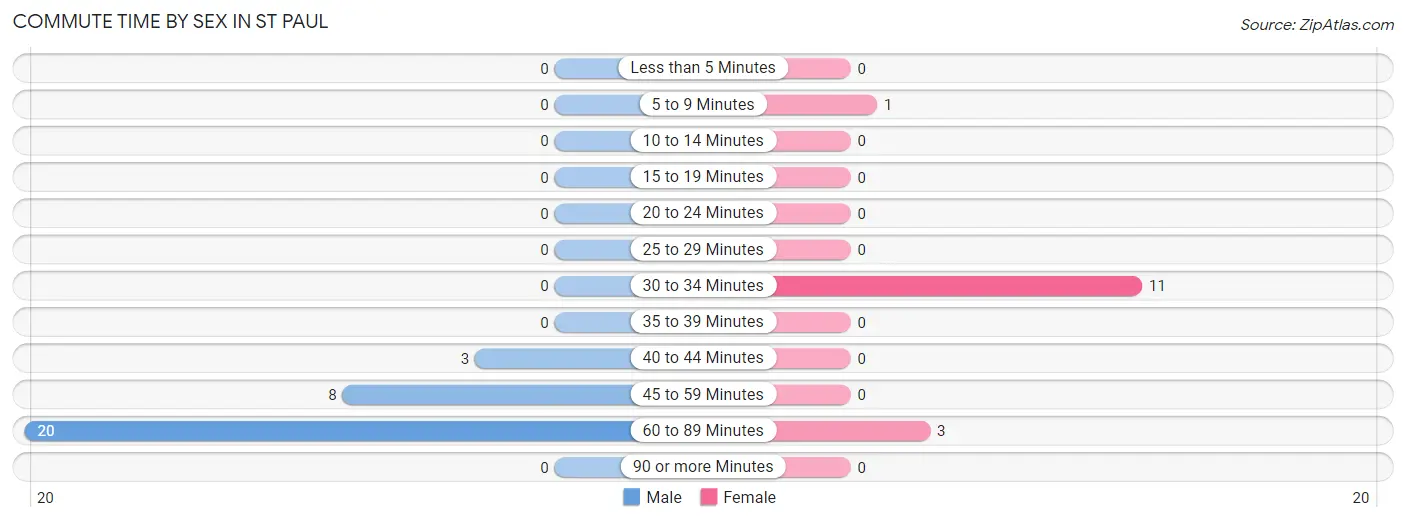
| Commute Time | Male | Female |
| Less than 5 Minutes | 0 (0.0%) | 0 (0.0%) |
| 5 to 9 Minutes | 0 (0.0%) | 1 (6.7%) |
| 10 to 14 Minutes | 0 (0.0%) | 0 (0.0%) |
| 15 to 19 Minutes | 0 (0.0%) | 0 (0.0%) |
| 20 to 24 Minutes | 0 (0.0%) | 0 (0.0%) |
| 25 to 29 Minutes | 0 (0.0%) | 0 (0.0%) |
| 30 to 34 Minutes | 0 (0.0%) | 11 (73.3%) |
| 35 to 39 Minutes | 0 (0.0%) | 0 (0.0%) |
| 40 to 44 Minutes | 3 (9.7%) | 0 (0.0%) |
| 45 to 59 Minutes | 8 (25.8%) | 0 (0.0%) |
| 60 to 89 Minutes | 20 (64.5%) | 3 (20.0%) |
| 90 or more Minutes | 0 (0.0%) | 0 (0.0%) |
Time of Departure to Work by Sex in St Paul
The most frequent times of departure to work in St Paul are 6:00 AM to 6:29 AM (22, 71.0%) for males and 12:00 AM to 4:59 AM (7, 46.7%) for females.
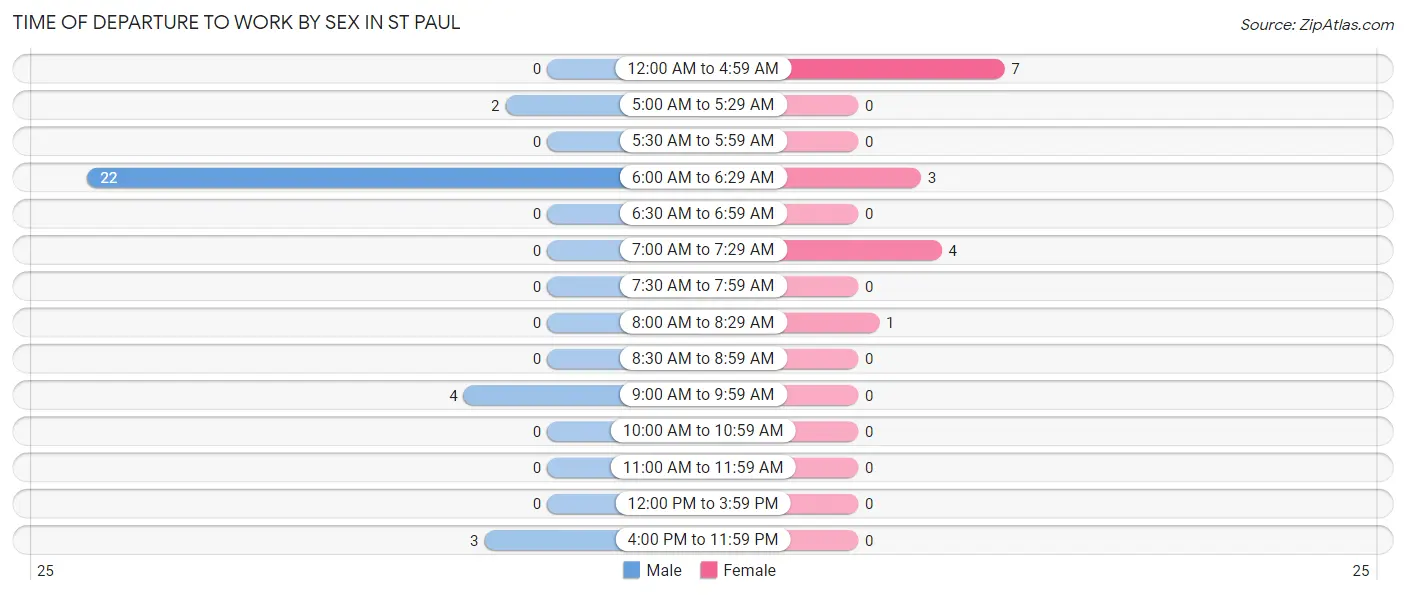
| Time of Departure | Male | Female |
| 12:00 AM to 4:59 AM | 0 (0.0%) | 7 (46.7%) |
| 5:00 AM to 5:29 AM | 2 (6.5%) | 0 (0.0%) |
| 5:30 AM to 5:59 AM | 0 (0.0%) | 0 (0.0%) |
| 6:00 AM to 6:29 AM | 22 (71.0%) | 3 (20.0%) |
| 6:30 AM to 6:59 AM | 0 (0.0%) | 0 (0.0%) |
| 7:00 AM to 7:29 AM | 0 (0.0%) | 4 (26.7%) |
| 7:30 AM to 7:59 AM | 0 (0.0%) | 0 (0.0%) |
| 8:00 AM to 8:29 AM | 0 (0.0%) | 1 (6.7%) |
| 8:30 AM to 8:59 AM | 0 (0.0%) | 0 (0.0%) |
| 9:00 AM to 9:59 AM | 4 (12.9%) | 0 (0.0%) |
| 10:00 AM to 10:59 AM | 0 (0.0%) | 0 (0.0%) |
| 11:00 AM to 11:59 AM | 0 (0.0%) | 0 (0.0%) |
| 12:00 PM to 3:59 PM | 0 (0.0%) | 0 (0.0%) |
| 4:00 PM to 11:59 PM | 3 (9.7%) | 0 (0.0%) |
| Total | 31 (100.0%) | 15 (100.0%) |
Housing Occupancy in St Paul
Occupancy by Ownership in St Paul
Of the total 50 dwellings in St Paul, owner-occupied units account for 46 (92.0%), while renter-occupied units make up 4 (8.0%).
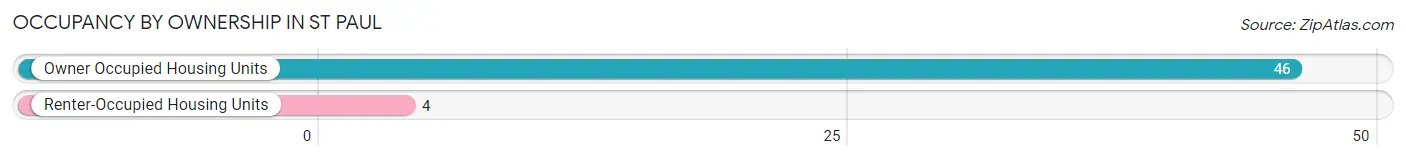
| Occupancy | # Housing Units | % Housing Units |
| Owner Occupied Housing Units | 46 | 92.0% |
| Renter-Occupied Housing Units | 4 | 8.0% |
| Total Occupied Housing Units | 50 | 100.0% |
Occupancy by Household Size in St Paul
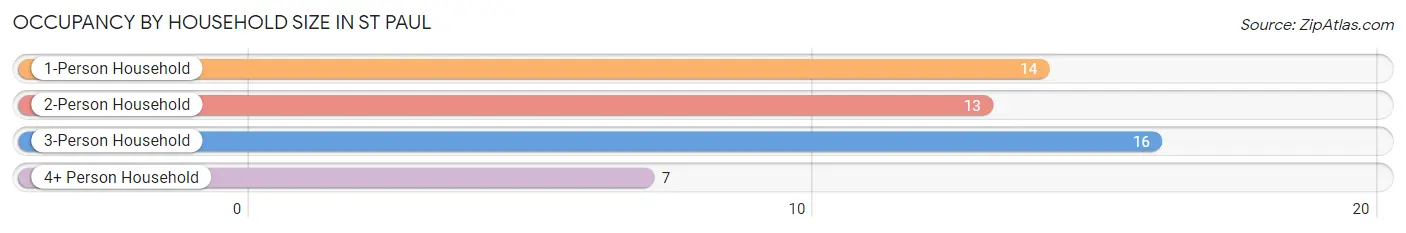
| Household Size | # Housing Units | % Housing Units |
| 1-Person Household | 14 | 28.0% |
| 2-Person Household | 13 | 26.0% |
| 3-Person Household | 16 | 32.0% |
| 4+ Person Household | 7 | 14.0% |
| Total Housing Units | 50 | 100.0% |
Occupancy by Ownership by Household Size in St Paul
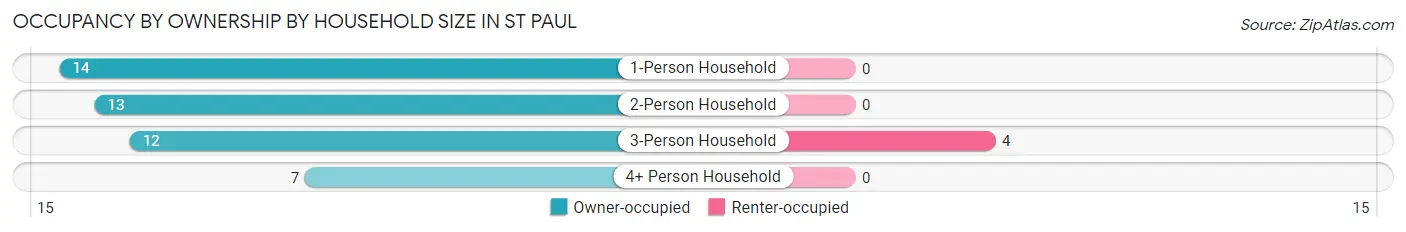
| Household Size | Owner-occupied | Renter-occupied |
| 1-Person Household | 14 (100.0%) | 0 (0.0%) |
| 2-Person Household | 13 (100.0%) | 0 (0.0%) |
| 3-Person Household | 12 (75.0%) | 4 (25.0%) |
| 4+ Person Household | 7 (100.0%) | 0 (0.0%) |
| Total Housing Units | 46 (92.0%) | 4 (8.0%) |
Occupancy by Educational Attainment in St Paul
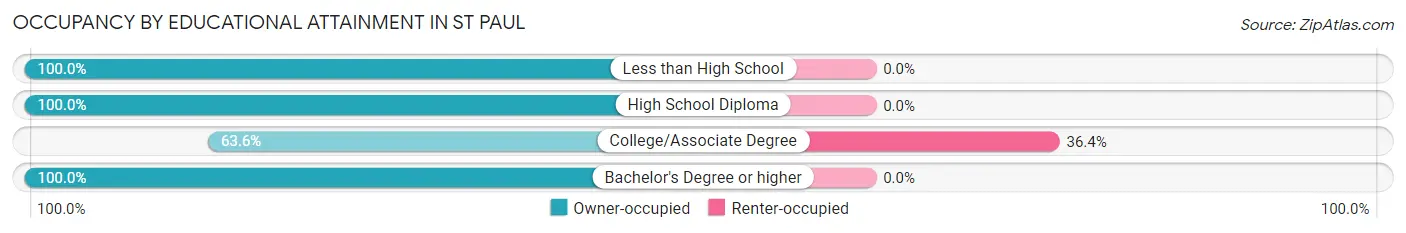
| Household Size | Owner-occupied | Renter-occupied |
| Less than High School | 4 (100.0%) | 0 (0.0%) |
| High School Diploma | 30 (100.0%) | 0 (0.0%) |
| College/Associate Degree | 7 (63.6%) | 4 (36.4%) |
| Bachelor's Degree or higher | 5 (100.0%) | 0 (0.0%) |
Occupancy by Age of Householder in St Paul
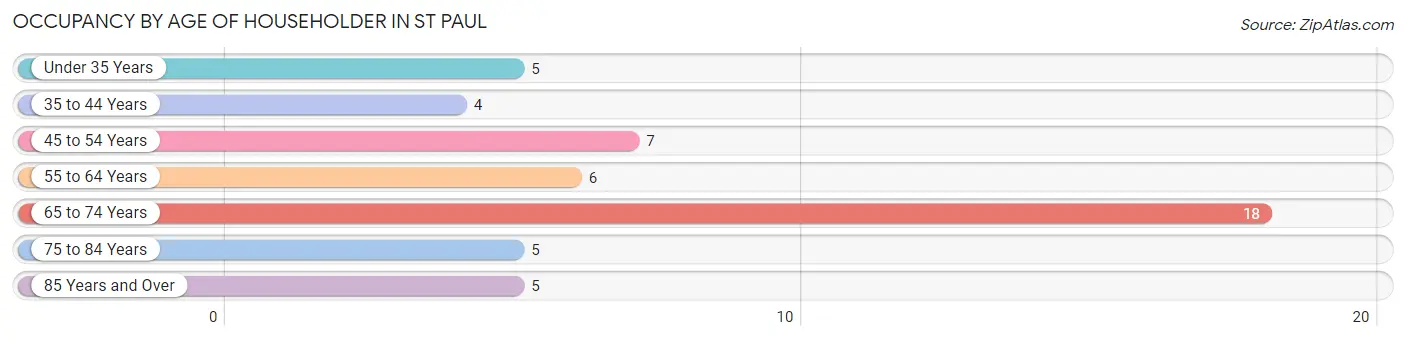
| Age Bracket | # Households | % Households |
| Under 35 Years | 5 | 10.0% |
| 35 to 44 Years | 4 | 8.0% |
| 45 to 54 Years | 7 | 14.0% |
| 55 to 64 Years | 6 | 12.0% |
| 65 to 74 Years | 18 | 36.0% |
| 75 to 84 Years | 5 | 10.0% |
| 85 Years and Over | 5 | 10.0% |
| Total | 50 | 100.0% |
Housing Finances in St Paul
Median Income by Occupancy in St Paul
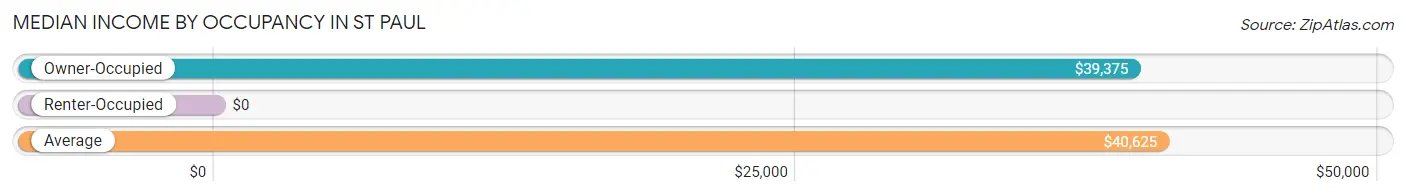
| Occupancy Type | # Households | Median Income |
| Owner-Occupied | 46 (92.0%) | $39,375 |
| Renter-Occupied | 4 (8.0%) | $0 |
| Average | 50 (100.0%) | $40,625 |
Occupancy by Householder Income Bracket in St Paul
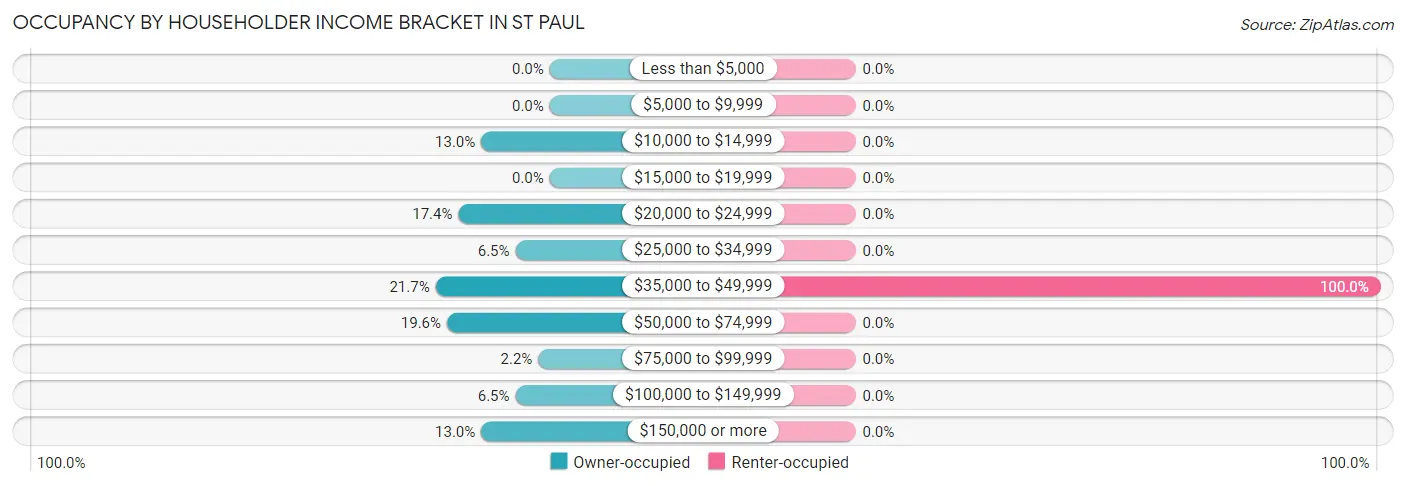
| Income Bracket | Owner-occupied | Renter-occupied |
| Less than $5,000 | 0 (0.0%) | 0 (0.0%) |
| $5,000 to $9,999 | 0 (0.0%) | 0 (0.0%) |
| $10,000 to $14,999 | 6 (13.0%) | 0 (0.0%) |
| $15,000 to $19,999 | 0 (0.0%) | 0 (0.0%) |
| $20,000 to $24,999 | 8 (17.4%) | 0 (0.0%) |
| $25,000 to $34,999 | 3 (6.5%) | 0 (0.0%) |
| $35,000 to $49,999 | 10 (21.7%) | 4 (100.0%) |
| $50,000 to $74,999 | 9 (19.6%) | 0 (0.0%) |
| $75,000 to $99,999 | 1 (2.2%) | 0 (0.0%) |
| $100,000 to $149,999 | 3 (6.5%) | 0 (0.0%) |
| $150,000 or more | 6 (13.0%) | 0 (0.0%) |
| Total | 46 (100.0%) | 4 (100.0%) |
Monthly Housing Cost Tiers in St Paul
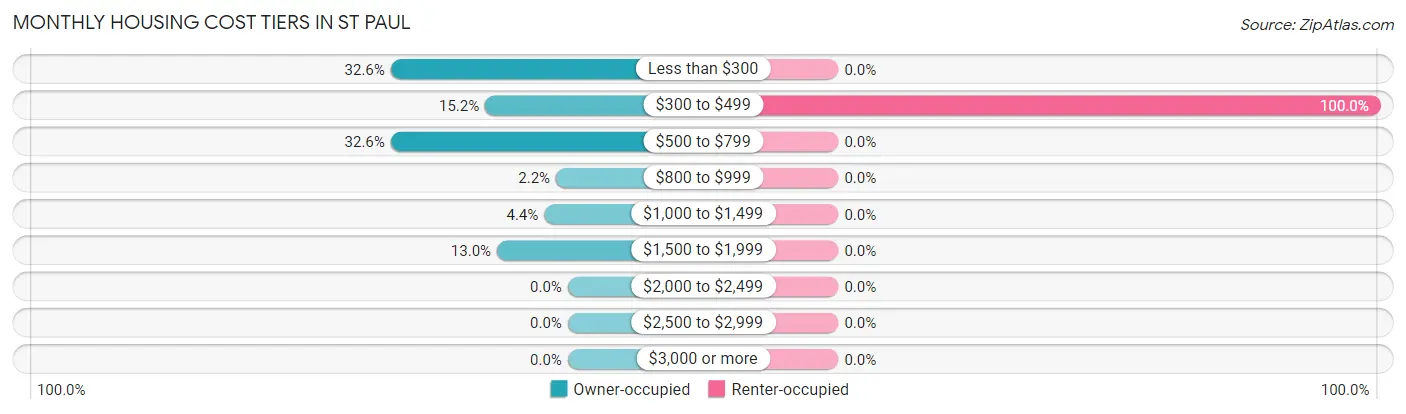
| Monthly Cost | Owner-occupied | Renter-occupied |
| Less than $300 | 15 (32.6%) | 0 (0.0%) |
| $300 to $499 | 7 (15.2%) | 4 (100.0%) |
| $500 to $799 | 15 (32.6%) | 0 (0.0%) |
| $800 to $999 | 1 (2.2%) | 0 (0.0%) |
| $1,000 to $1,499 | 2 (4.3%) | 0 (0.0%) |
| $1,500 to $1,999 | 6 (13.0%) | 0 (0.0%) |
| $2,000 to $2,499 | 0 (0.0%) | 0 (0.0%) |
| $2,500 to $2,999 | 0 (0.0%) | 0 (0.0%) |
| $3,000 or more | 0 (0.0%) | 0 (0.0%) |
| Total | 46 (100.0%) | 4 (100.0%) |
Physical Housing Characteristics in St Paul
Housing Structures in St Paul
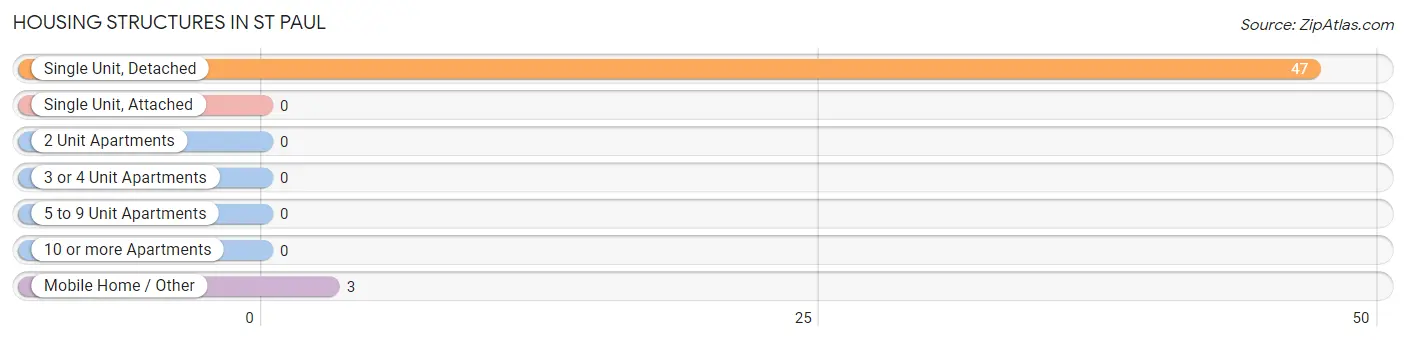
| Structure Type | # Housing Units | % Housing Units |
| Single Unit, Detached | 47 | 94.0% |
| Single Unit, Attached | 0 | 0.0% |
| 2 Unit Apartments | 0 | 0.0% |
| 3 or 4 Unit Apartments | 0 | 0.0% |
| 5 to 9 Unit Apartments | 0 | 0.0% |
| 10 or more Apartments | 0 | 0.0% |
| Mobile Home / Other | 3 | 6.0% |
| Total | 50 | 100.0% |
Housing Structures by Occupancy in St Paul
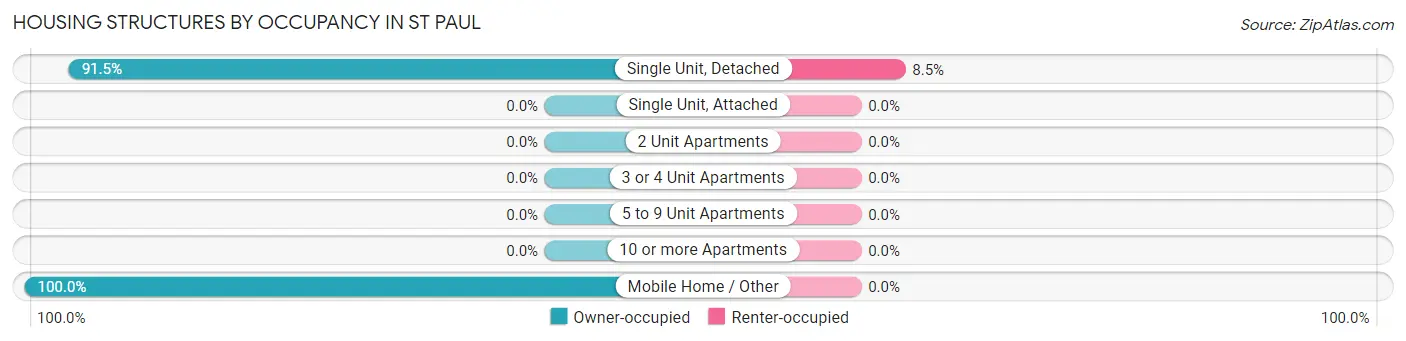
| Structure Type | Owner-occupied | Renter-occupied |
| Single Unit, Detached | 43 (91.5%) | 4 (8.5%) |
| Single Unit, Attached | 0 (0.0%) | 0 (0.0%) |
| 2 Unit Apartments | 0 (0.0%) | 0 (0.0%) |
| 3 or 4 Unit Apartments | 0 (0.0%) | 0 (0.0%) |
| 5 to 9 Unit Apartments | 0 (0.0%) | 0 (0.0%) |
| 10 or more Apartments | 0 (0.0%) | 0 (0.0%) |
| Mobile Home / Other | 3 (100.0%) | 0 (0.0%) |
| Total | 46 (92.0%) | 4 (8.0%) |
Housing Structures by Number of Rooms in St Paul
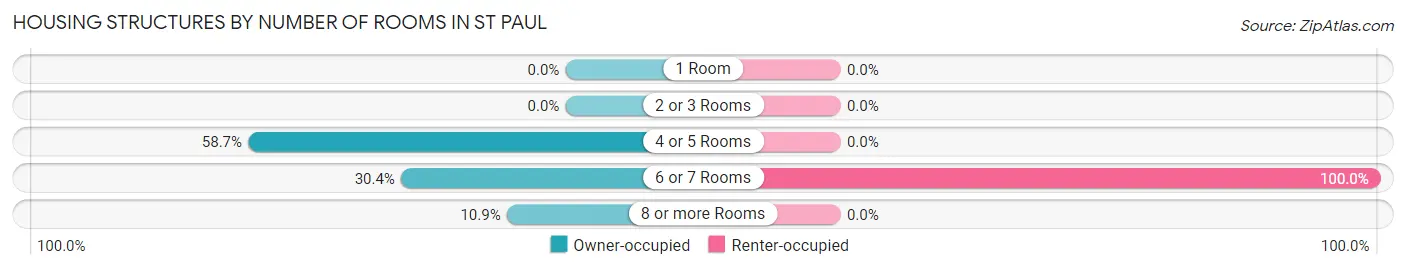
| Number of Rooms | Owner-occupied | Renter-occupied |
| 1 Room | 0 (0.0%) | 0 (0.0%) |
| 2 or 3 Rooms | 0 (0.0%) | 0 (0.0%) |
| 4 or 5 Rooms | 27 (58.7%) | 0 (0.0%) |
| 6 or 7 Rooms | 14 (30.4%) | 4 (100.0%) |
| 8 or more Rooms | 5 (10.9%) | 0 (0.0%) |
| Total | 46 (100.0%) | 4 (100.0%) |
Housing Structure by Heating Type in St Paul
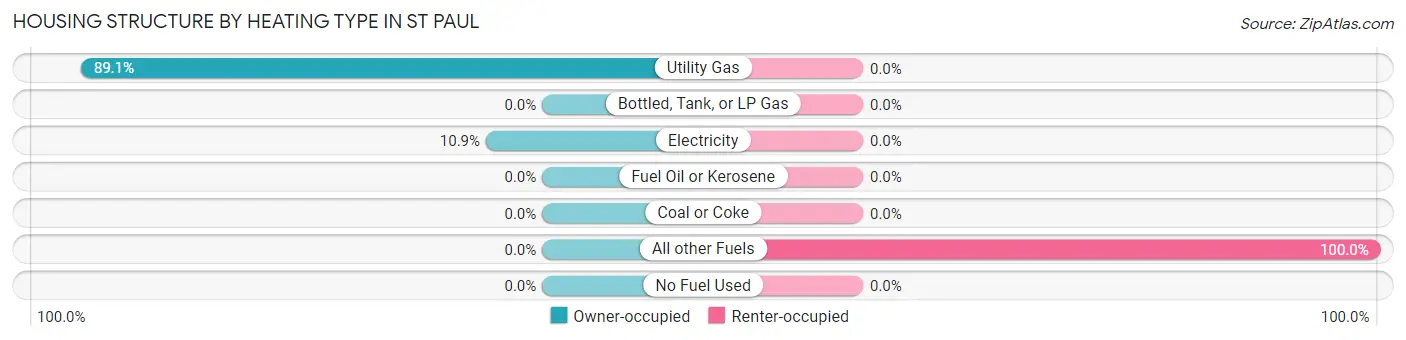
| Heating Type | Owner-occupied | Renter-occupied |
| Utility Gas | 41 (89.1%) | 0 (0.0%) |
| Bottled, Tank, or LP Gas | 0 (0.0%) | 0 (0.0%) |
| Electricity | 5 (10.9%) | 0 (0.0%) |
| Fuel Oil or Kerosene | 0 (0.0%) | 0 (0.0%) |
| Coal or Coke | 0 (0.0%) | 0 (0.0%) |
| All other Fuels | 0 (0.0%) | 4 (100.0%) |
| No Fuel Used | 0 (0.0%) | 0 (0.0%) |
| Total | 46 (100.0%) | 4 (100.0%) |
Household Vehicle Usage in St Paul
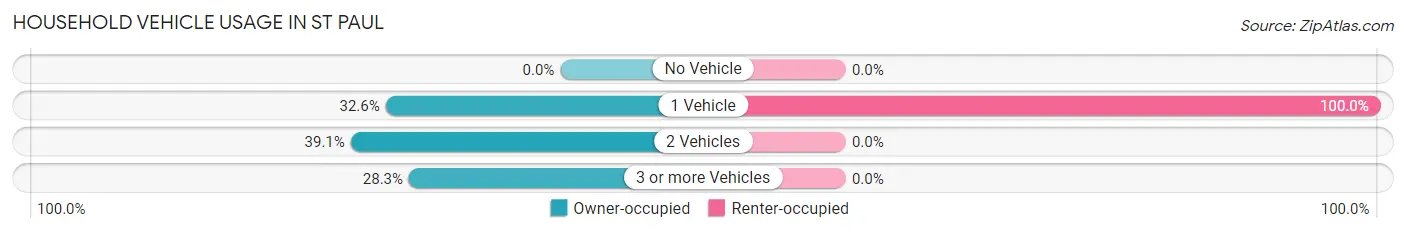
| Vehicles per Household | Owner-occupied | Renter-occupied |
| No Vehicle | 0 (0.0%) | 0 (0.0%) |
| 1 Vehicle | 15 (32.6%) | 4 (100.0%) |
| 2 Vehicles | 18 (39.1%) | 0 (0.0%) |
| 3 or more Vehicles | 13 (28.3%) | 0 (0.0%) |
| Total | 46 (100.0%) | 4 (100.0%) |
Real Estate & Mortgages in St Paul
Real Estate and Mortgage Overview in St Paul
| Characteristic | Without Mortgage | With Mortgage |
| Housing Units | 22 | 24 |
| Median Property Value | $47,300 | $0 |
| Median Household Income | $38,125 | $6 |
| Monthly Housing Costs | $260 | $0 |
| Real Estate Taxes | $392 | $1 |
Property Value by Mortgage Status in St Paul
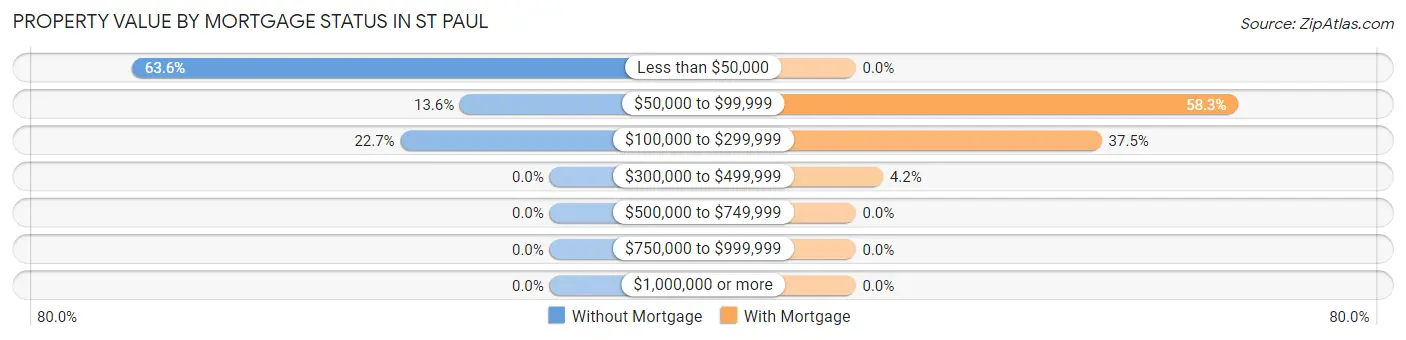
| Property Value | Without Mortgage | With Mortgage |
| Less than $50,000 | 14 (63.6%) | 0 (0.0%) |
| $50,000 to $99,999 | 3 (13.6%) | 14 (58.3%) |
| $100,000 to $299,999 | 5 (22.7%) | 9 (37.5%) |
| $300,000 to $499,999 | 0 (0.0%) | 1 (4.2%) |
| $500,000 to $749,999 | 0 (0.0%) | 0 (0.0%) |
| $750,000 to $999,999 | 0 (0.0%) | 0 (0.0%) |
| $1,000,000 or more | 0 (0.0%) | 0 (0.0%) |
| Total | 22 (100.0%) | 24 (100.0%) |
Household Income by Mortgage Status in St Paul
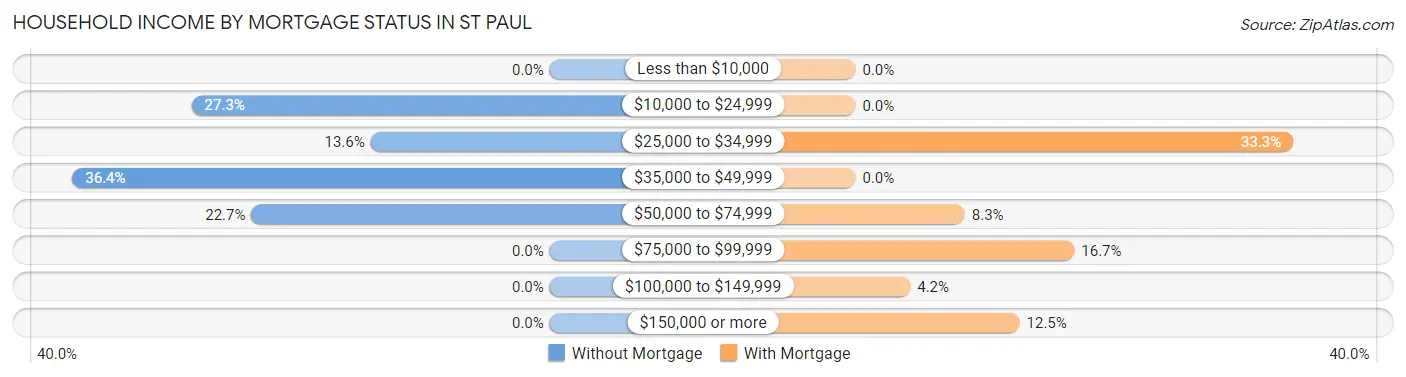
| Household Income | Without Mortgage | With Mortgage |
| Less than $10,000 | 0 (0.0%) | 0 (0.0%) |
| $10,000 to $24,999 | 6 (27.3%) | 0 (0.0%) |
| $25,000 to $34,999 | 3 (13.6%) | 8 (33.3%) |
| $35,000 to $49,999 | 8 (36.4%) | 0 (0.0%) |
| $50,000 to $74,999 | 5 (22.7%) | 2 (8.3%) |
| $75,000 to $99,999 | 0 (0.0%) | 4 (16.7%) |
| $100,000 to $149,999 | 0 (0.0%) | 1 (4.2%) |
| $150,000 or more | 0 (0.0%) | 3 (12.5%) |
| Total | 22 (100.0%) | 24 (100.0%) |
Property Value to Household Income Ratio in St Paul
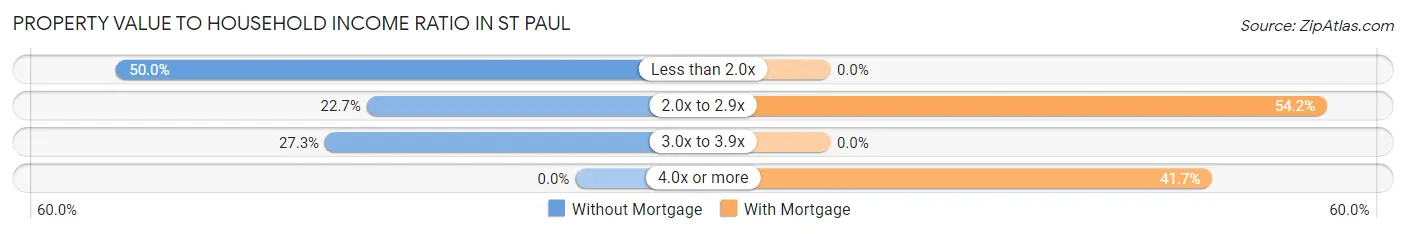
| Value-to-Income Ratio | Without Mortgage | With Mortgage |
| Less than 2.0x | 11 (50.0%) | 0 (0.0%) |
| 2.0x to 2.9x | 5 (22.7%) | 13 (54.2%) |
| 3.0x to 3.9x | 6 (27.3%) | 0 (0.0%) |
| 4.0x or more | 0 (0.0%) | 10 (41.7%) |
| Total | 22 (100.0%) | 24 (100.0%) |
Real Estate Taxes by Mortgage Status in St Paul
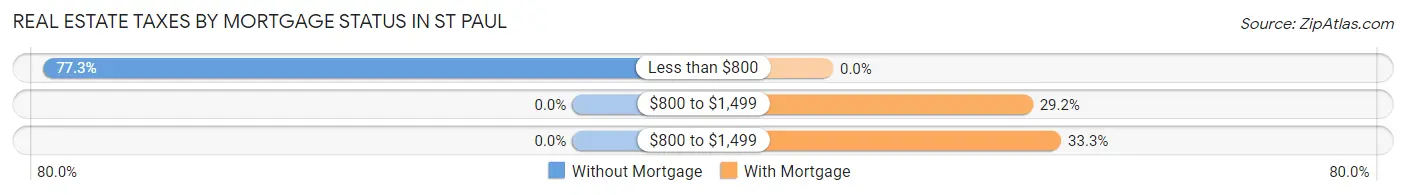
| Property Taxes | Without Mortgage | With Mortgage |
| Less than $800 | 17 (77.3%) | 0 (0.0%) |
| $800 to $1,499 | 0 (0.0%) | 7 (29.2%) |
| $800 to $1,499 | 0 (0.0%) | 8 (33.3%) |
| Total | 22 (100.0%) | 24 (100.0%) |
Health & Disability in St Paul
Health Insurance Coverage by Age in St Paul
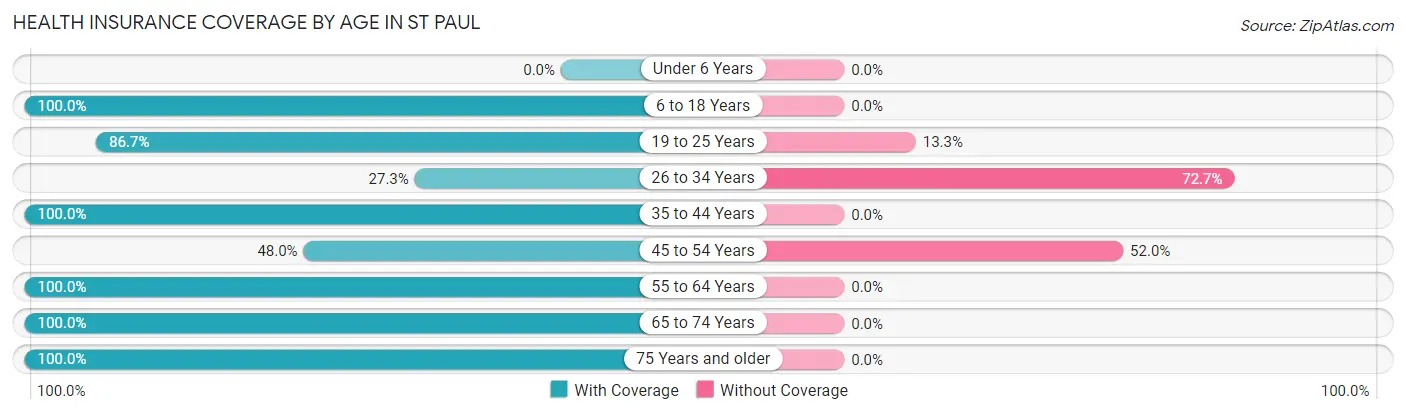
| Age Bracket | With Coverage | Without Coverage |
| Under 6 Years | 0 (0.0%) | 0 (0.0%) |
| 6 to 18 Years | 22 (100.0%) | 0 (0.0%) |
| 19 to 25 Years | 13 (86.7%) | 2 (13.3%) |
| 26 to 34 Years | 3 (27.3%) | 8 (72.7%) |
| 35 to 44 Years | 4 (100.0%) | 0 (0.0%) |
| 45 to 54 Years | 12 (48.0%) | 13 (52.0%) |
| 55 to 64 Years | 7 (100.0%) | 0 (0.0%) |
| 65 to 74 Years | 20 (100.0%) | 0 (0.0%) |
| 75 Years and older | 19 (100.0%) | 0 (0.0%) |
| Total | 100 (81.3%) | 23 (18.7%) |
Health Insurance Coverage by Citizenship Status in St Paul
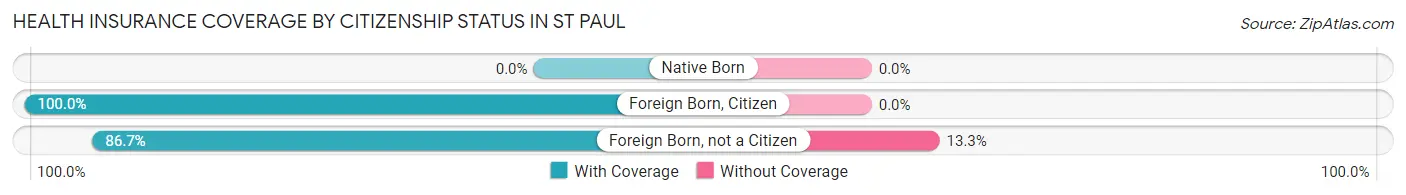
| Citizenship Status | With Coverage | Without Coverage |
| Native Born | 0 (0.0%) | 0 (0.0%) |
| Foreign Born, Citizen | 22 (100.0%) | 0 (0.0%) |
| Foreign Born, not a Citizen | 13 (86.7%) | 2 (13.3%) |
Health Insurance Coverage by Household Income in St Paul
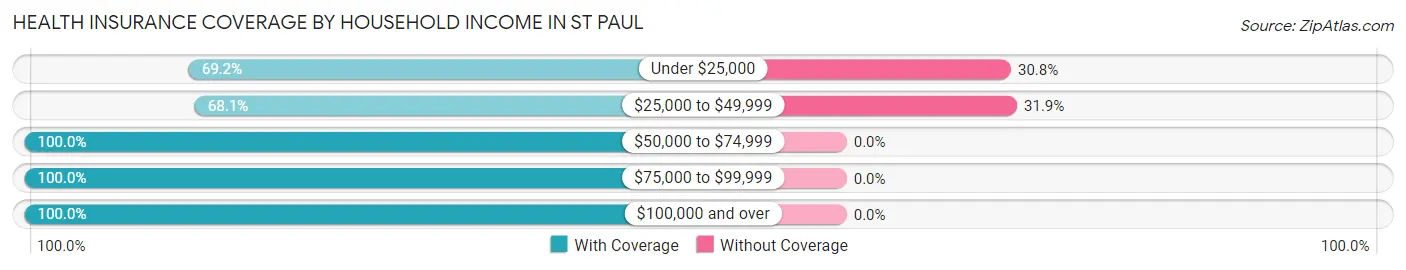
| Household Income | With Coverage | Without Coverage |
| Under $25,000 | 18 (69.2%) | 8 (30.8%) |
| $25,000 to $49,999 | 32 (68.1%) | 15 (31.9%) |
| $50,000 to $74,999 | 15 (100.0%) | 0 (0.0%) |
| $75,000 to $99,999 | 2 (100.0%) | 0 (0.0%) |
| $100,000 and over | 33 (100.0%) | 0 (0.0%) |
Public vs Private Health Insurance Coverage by Age in St Paul
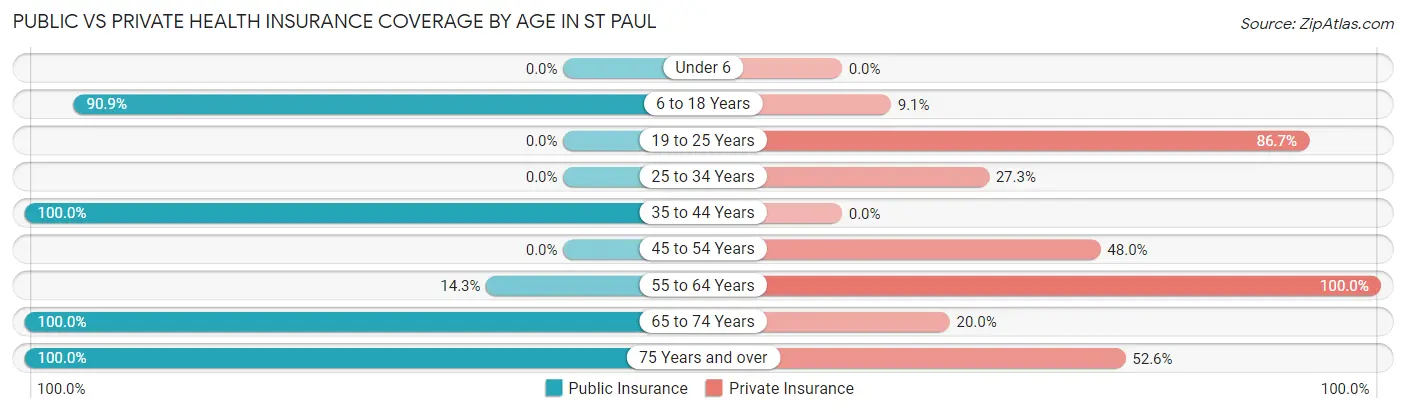
| Age Bracket | Public Insurance | Private Insurance |
| Under 6 | 0 (0.0%) | 0 (0.0%) |
| 6 to 18 Years | 20 (90.9%) | 2 (9.1%) |
| 19 to 25 Years | 0 (0.0%) | 13 (86.7%) |
| 25 to 34 Years | 0 (0.0%) | 3 (27.3%) |
| 35 to 44 Years | 4 (100.0%) | 0 (0.0%) |
| 45 to 54 Years | 0 (0.0%) | 12 (48.0%) |
| 55 to 64 Years | 1 (14.3%) | 7 (100.0%) |
| 65 to 74 Years | 20 (100.0%) | 4 (20.0%) |
| 75 Years and over | 19 (100.0%) | 10 (52.6%) |
| Total | 64 (52.0%) | 51 (41.5%) |
Disability Status by Sex by Age in St Paul
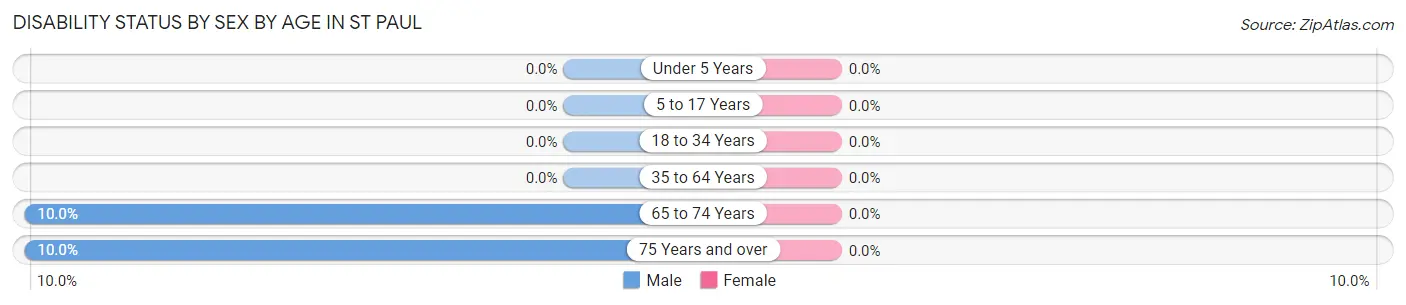
| Age Bracket | Male | Female |
| Under 5 Years | 0 (0.0%) | 0 (0.0%) |
| 5 to 17 Years | 0 (0.0%) | 0 (0.0%) |
| 18 to 34 Years | 0 (0.0%) | 0 (0.0%) |
| 35 to 64 Years | 0 (0.0%) | 0 (0.0%) |
| 65 to 74 Years | 1 (10.0%) | 0 (0.0%) |
| 75 Years and over | 1 (10.0%) | 0 (0.0%) |
Disability Class by Sex by Age in St Paul
Disability Class: Hearing Difficulty

| Age Bracket | Male | Female |
| Under 5 Years | 0 (0.0%) | 0 (0.0%) |
| 5 to 17 Years | 0 (0.0%) | 0 (0.0%) |
| 18 to 34 Years | 0 (0.0%) | 0 (0.0%) |
| 35 to 64 Years | 0 (0.0%) | 0 (0.0%) |
| 65 to 74 Years | 1 (10.0%) | 0 (0.0%) |
| 75 Years and over | 1 (10.0%) | 0 (0.0%) |
Disability Class: Vision Difficulty
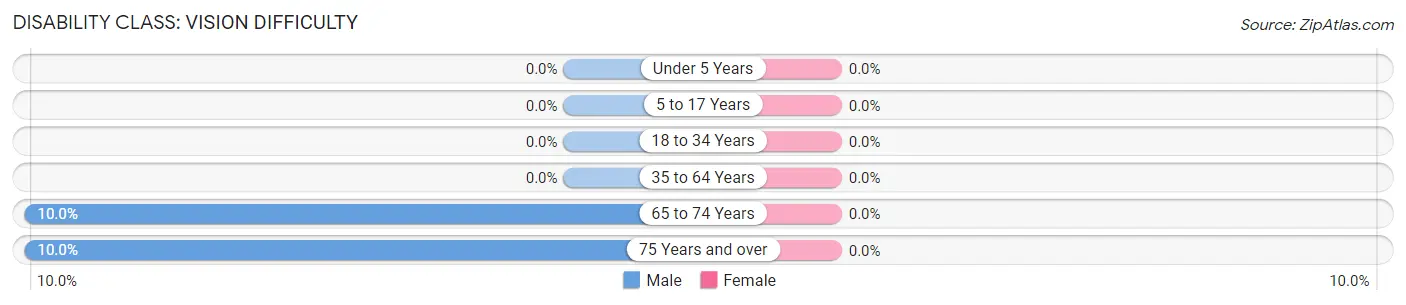
| Age Bracket | Male | Female |
| Under 5 Years | 0 (0.0%) | 0 (0.0%) |
| 5 to 17 Years | 0 (0.0%) | 0 (0.0%) |
| 18 to 34 Years | 0 (0.0%) | 0 (0.0%) |
| 35 to 64 Years | 0 (0.0%) | 0 (0.0%) |
| 65 to 74 Years | 1 (10.0%) | 0 (0.0%) |
| 75 Years and over | 1 (10.0%) | 0 (0.0%) |
Disability Class: Cognitive Difficulty
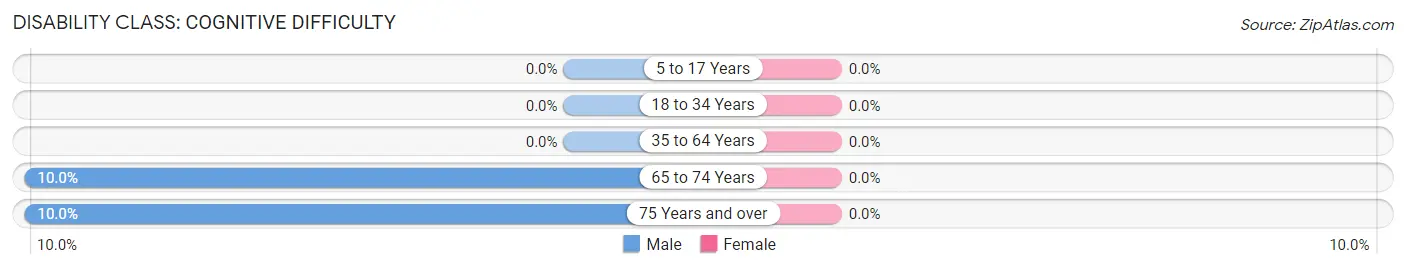
| Age Bracket | Male | Female |
| 5 to 17 Years | 0 (0.0%) | 0 (0.0%) |
| 18 to 34 Years | 0 (0.0%) | 0 (0.0%) |
| 35 to 64 Years | 0 (0.0%) | 0 (0.0%) |
| 65 to 74 Years | 1 (10.0%) | 0 (0.0%) |
| 75 Years and over | 1 (10.0%) | 0 (0.0%) |
Disability Class: Ambulatory Difficulty
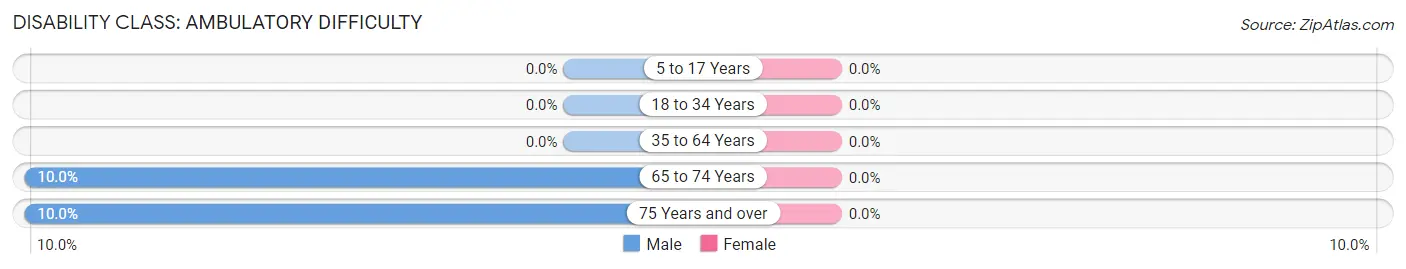
| Age Bracket | Male | Female |
| 5 to 17 Years | 0 (0.0%) | 0 (0.0%) |
| 18 to 34 Years | 0 (0.0%) | 0 (0.0%) |
| 35 to 64 Years | 0 (0.0%) | 0 (0.0%) |
| 65 to 74 Years | 1 (10.0%) | 0 (0.0%) |
| 75 Years and over | 1 (10.0%) | 0 (0.0%) |
Disability Class: Self-Care Difficulty
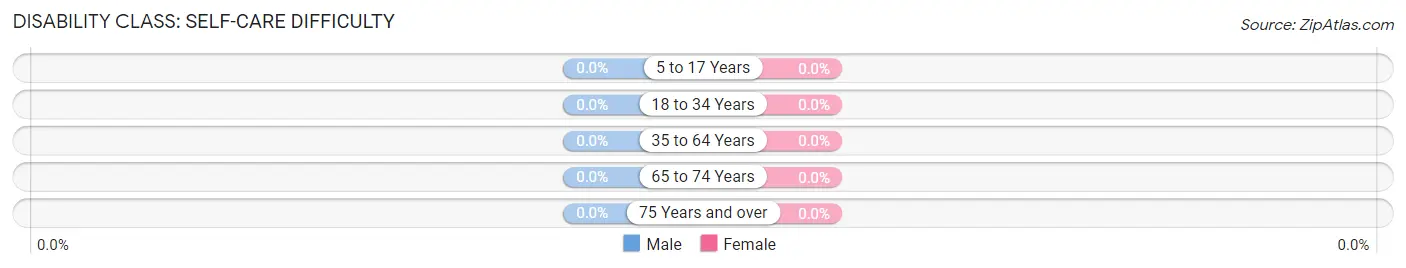
| Age Bracket | Male | Female |
| 5 to 17 Years | 0 (0.0%) | 0 (0.0%) |
| 18 to 34 Years | 0 (0.0%) | 0 (0.0%) |
| 35 to 64 Years | 0 (0.0%) | 0 (0.0%) |
| 65 to 74 Years | 0 (0.0%) | 0 (0.0%) |
| 75 Years and over | 0 (0.0%) | 0 (0.0%) |
Technology Access in St Paul
Computing Device Access in St Paul
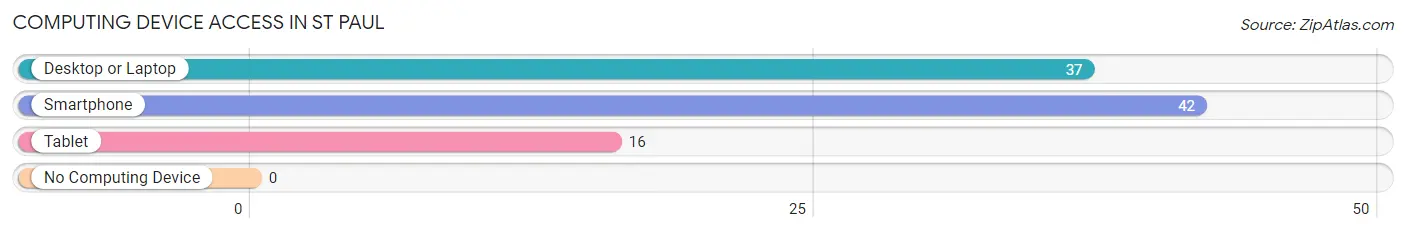
| Device Type | # Households | % Households |
| Desktop or Laptop | 37 | 74.0% |
| Smartphone | 42 | 84.0% |
| Tablet | 16 | 32.0% |
| No Computing Device | 0 | 0.0% |
| Total | 50 | 100.0% |
Internet Access in St Paul
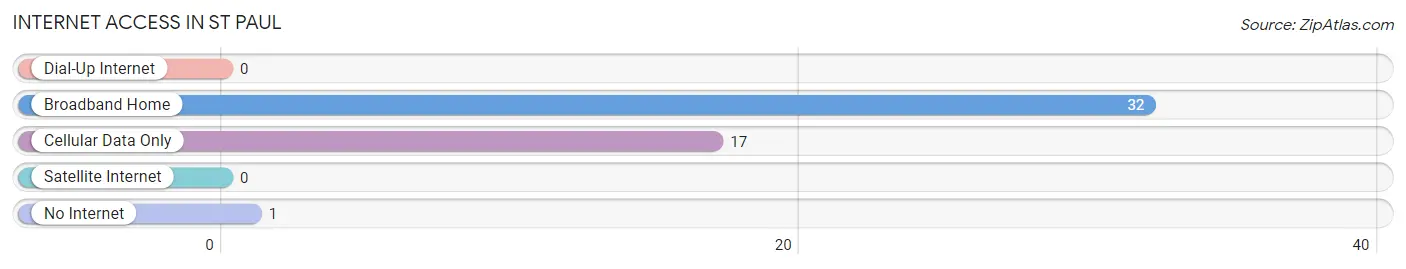
| Internet Type | # Households | % Households |
| Dial-Up Internet | 0 | 0.0% |
| Broadband Home | 32 | 64.0% |
| Cellular Data Only | 17 | 34.0% |
| Satellite Internet | 0 | 0.0% |
| No Internet | 1 | 2.0% |
| Total | 50 | 100.0% |
St Paul Summary
St. Paul is a city located in Arkansas, United States. It is the county seat of Randolph County and is located in the northeast corner of the state. The population of St. Paul was 1,072 at the 2010 census.
History
St. Paul was founded in 1848 by a group of settlers from Kentucky and Tennessee. The town was named after St. Paul, Minnesota, which was the first city in the United States to be named after a saint. The town was incorporated in 1851 and was the first town in Randolph County.
The town was a major stop on the St. Louis, Iron Mountain and Southern Railway, which ran from St. Louis to Little Rock. The railroad was a major factor in the growth of the town, as it allowed for the transportation of goods and people.
Geography
St. Paul is located at 36°25'25" North, 91°2'25" West (36.423, -91.040). According to the United States Census Bureau, the city has a total area of 1.2 square miles (3.1 km2), all land.
Economy
St. Paul is a small rural town with a limited economy. The main industries in the area are agriculture and timber. The town is home to several small businesses, including a grocery store, a hardware store, and a few restaurants.
Demographics
As of the census of 2000, there were 1,072 people, 441 households, and 294 families residing in the city. The population density was 890.2 people per square mile (344.3/km2). There were 486 housing units at an average density of 403.2 per square mile (155.7/km2). The racial makeup of the city was 97.45% White, 0.09% African American, 0.09% Native American, 0.09% Asian, 0.09% Pacific Islander, 0.93% from other races, and 1.25% from two or more races. Hispanic or Latino of any race were 1.25% of the population.
There were 441 households, out of which 28.2% had children under the age of 18 living with them, 51.6% were married couples living together, 11.3% had a female householder with no husband present, and 33.7% were non-families. 30.2% of all households were made up of individuals, and 16.3% had someone living alone who was 65 years of age or older. The average household size was 2.41 and the average family size was 2.99.
In the city, the population was spread out, with 24.3% under the age of 18, 8.2% from 18 to 24, 25.2% from 25 to 44, 22.7% from 45 to 64, and 19.6% who were 65 years of age or older. The median age was 39 years. For every 100 females, there were 87.2 males. For every 100 females age 18 and over, there were 81.3 males.
The median income for a household in the city was $25,000, and the median income for a family was $31,250. Males had a median income of $25,000 versus $17,500 for females. The per capita income for the city was $13,945. About 14.3% of families and 17.2% of the population were below the poverty line, including 22.2% of those under age 18 and 16.7% of those age 65 or over.
Common Questions
What is Per Capita Income in St Paul?
Per Capita income in St Paul is $25,211.
What is the Median Family Income in St Paul?
Median Family Income in St Paul is $43,333.
What is the Median Household income in St Paul?
Median Household Income in St Paul is $40,625.
What is Inequality or Gini Index in St Paul?
Inequality or Gini Index in St Paul is 0.42.
What is the Total Population of St Paul?
Total Population of St Paul is 123.
What is the Total Male Population of St Paul?
Total Male Population of St Paul is 69.
What is the Total Female Population of St Paul?
Total Female Population of St Paul is 54.
What is the Ratio of Males per 100 Females in St Paul?
There are 127.78 Males per 100 Females in St Paul.
What is the Ratio of Females per 100 Males in St Paul?
There are 78.26 Females per 100 Males in St Paul.
What is the Median Population Age in St Paul?
Median Population Age in St Paul is 46.8 Years.
What is the Average Family Size in St Paul
Average Family Size in St Paul is 3.1 People.
What is the Average Household Size in St Paul
Average Household Size in St Paul is 2.5 People.
How Large is the Labor Force in St Paul?
There are 53 People in the Labor Forcein in St Paul.
What is the Percentage of People in the Labor Force in St Paul?
48.6% of People are in the Labor Force in St Paul.
What is the Unemployment Rate in St Paul?
Unemployment Rate in St Paul is 13.2%.