McNeil, AR Map & Demographics
McNeil Map
McNeil Overview
$19,049
PER CAPITA INCOME
$55,417
AVG FAMILY INCOME
$34,625
AVG HOUSEHOLD INCOME
36.0%
WAGE / INCOME GAP [ % ]
64.0¢/ $1
WAGE / INCOME GAP [ $ ]
0.44
INEQUALITY / GINI INDEX
489
TOTAL POPULATION
229
MALE POPULATION
260
FEMALE POPULATION
88.08
MALES / 100 FEMALES
113.54
FEMALES / 100 MALES
35.5
MEDIAN AGE
3.3
AVG FAMILY SIZE
2.3
AVG HOUSEHOLD SIZE
252
LABOR FORCE [ PEOPLE ]
67.2%
PERCENT IN LABOR FORCE
Income in McNeil
Income Overview in McNeil
Per Capita Income in McNeil is $19,049, while median incomes of families and households are $55,417 and $34,625 respectively.
| Characteristic | Number | Measure |
| Per Capita Income | 489 | $19,049 |
| Median Family Income | 119 | $55,417 |
| Mean Family Income | 119 | $58,061 |
| Median Household Income | 210 | $34,625 |
| Mean Household Income | 210 | $43,473 |
| Income Deficit | 119 | $0 |
| Wage / Income Gap (%) | 489 | 35.99% |
| Wage / Income Gap ($) | 489 | 64.01¢ per $1 |
| Gini / Inequality Index | 489 | 0.44 |
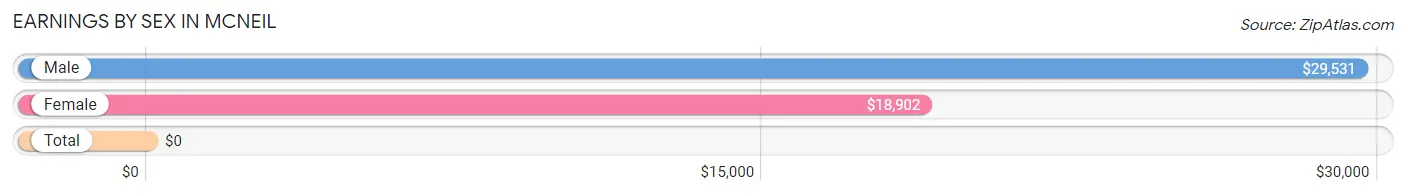
Earnings by Sex in McNeil
| Sex | Number | Average Earnings |
| Male | 124 (40.7%) | $29,531 |
| Female | 181 (59.3%) | $18,902 |
| Total | 305 (100.0%) | $0 |
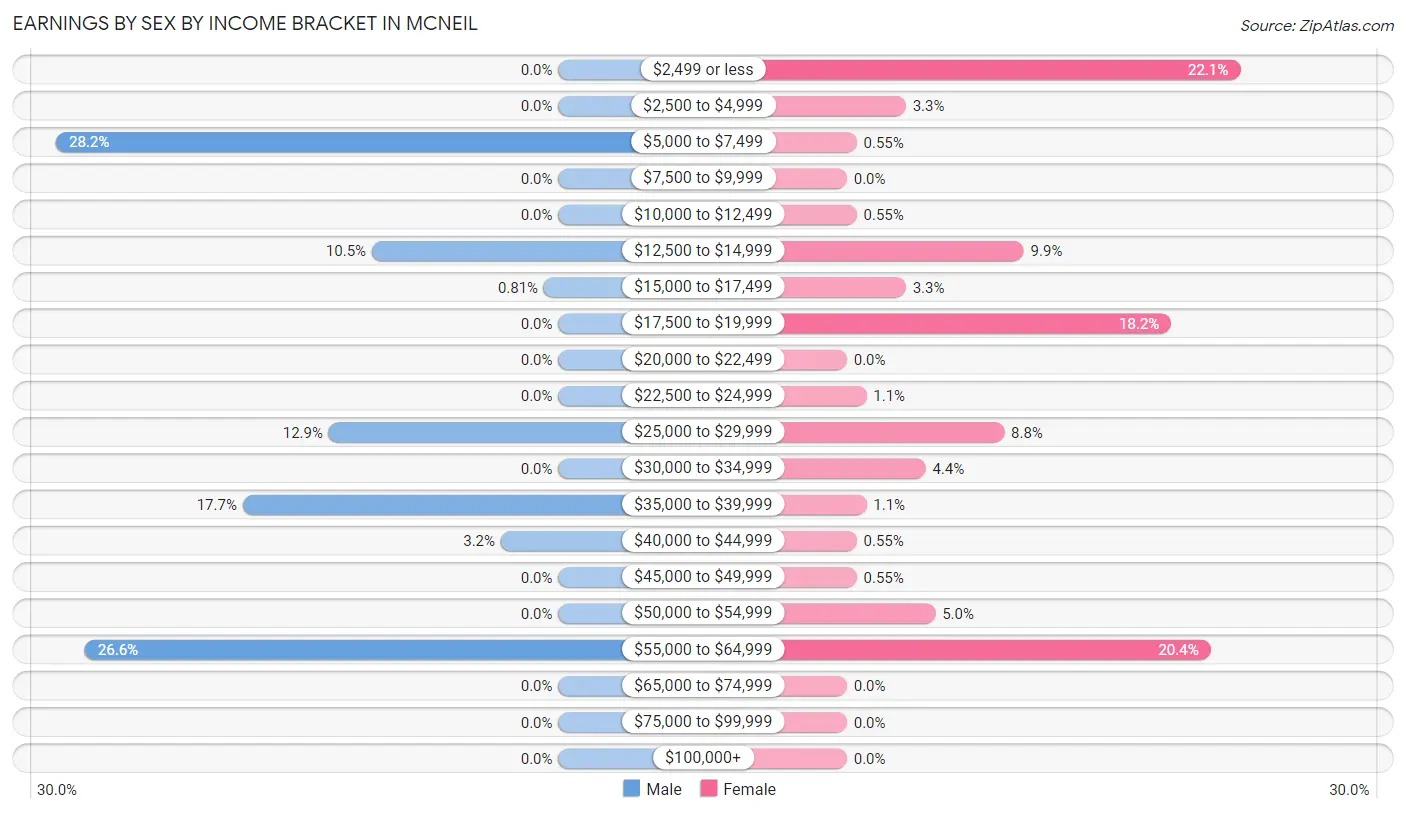
Earnings by Sex by Income Bracket in McNeil
The most common earnings brackets in McNeil are $5,000 to $7,499 for men (35 | 28.2%) and $2,499 or less for women (40 | 22.1%).
| Income | Male | Female |
| $2,499 or less | 0 (0.0%) | 40 (22.1%) |
| $2,500 to $4,999 | 0 (0.0%) | 6 (3.3%) |
| $5,000 to $7,499 | 35 (28.2%) | 1 (0.5%) |
| $7,500 to $9,999 | 0 (0.0%) | 0 (0.0%) |
| $10,000 to $12,499 | 0 (0.0%) | 1 (0.5%) |
| $12,500 to $14,999 | 13 (10.5%) | 18 (9.9%) |
| $15,000 to $17,499 | 1 (0.8%) | 6 (3.3%) |
| $17,500 to $19,999 | 0 (0.0%) | 33 (18.2%) |
| $20,000 to $22,499 | 0 (0.0%) | 0 (0.0%) |
| $22,500 to $24,999 | 0 (0.0%) | 2 (1.1%) |
| $25,000 to $29,999 | 16 (12.9%) | 16 (8.8%) |
| $30,000 to $34,999 | 0 (0.0%) | 8 (4.4%) |
| $35,000 to $39,999 | 22 (17.7%) | 2 (1.1%) |
| $40,000 to $44,999 | 4 (3.2%) | 1 (0.5%) |
| $45,000 to $49,999 | 0 (0.0%) | 1 (0.5%) |
| $50,000 to $54,999 | 0 (0.0%) | 9 (5.0%) |
| $55,000 to $64,999 | 33 (26.6%) | 37 (20.4%) |
| $65,000 to $74,999 | 0 (0.0%) | 0 (0.0%) |
| $75,000 to $99,999 | 0 (0.0%) | 0 (0.0%) |
| $100,000+ | 0 (0.0%) | 0 (0.0%) |
| Total | 124 (100.0%) | 181 (100.0%) |
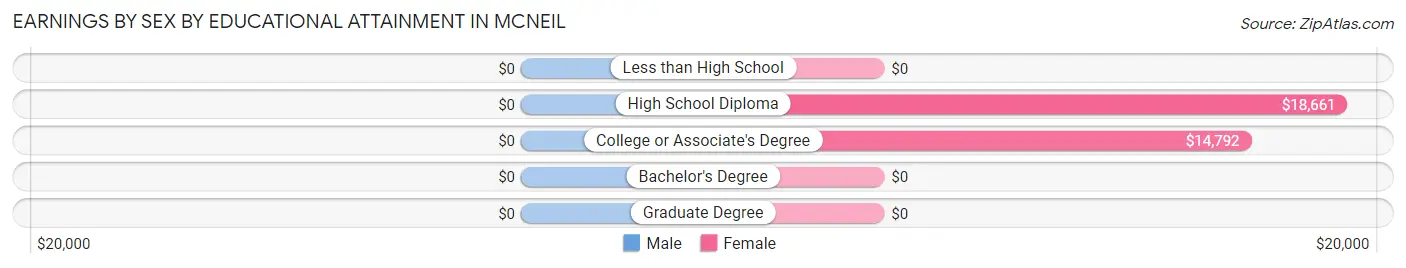
Earnings by Sex by Educational Attainment in McNeil
| Educational Attainment | Male Income | Female Income |
| Less than High School | - | - |
| High School Diploma | - | - |
| College or Associate's Degree | - | - |
| Bachelor's Degree | - | - |
| Graduate Degree | - | - |
| Total | $29,531 | $19,053 |
Family Income in McNeil
Family Income Brackets in McNeil
According to the McNeil family income data, there are 33 families falling into the $100,000 to $149,999 income range, which is the most common income bracket and makes up 27.7% of all families.
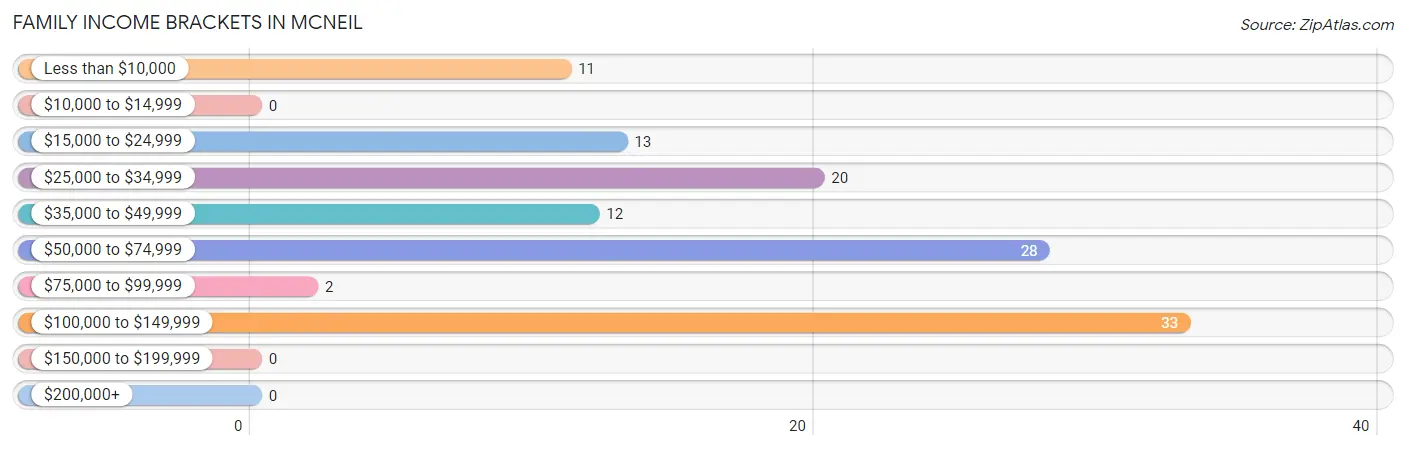
| Income Bracket | # Families | % Families |
| Less than $10,000 | 11 | 9.2% |
| $10,000 to $14,999 | 0 | 0.0% |
| $15,000 to $24,999 | 13 | 10.9% |
| $25,000 to $34,999 | 20 | 16.8% |
| $35,000 to $49,999 | 12 | 10.1% |
| $50,000 to $74,999 | 28 | 23.5% |
| $75,000 to $99,999 | 2 | 1.7% |
| $100,000 to $149,999 | 33 | 27.7% |
| $150,000 to $199,999 | 0 | 0.0% |
| $200,000+ | 0 | 0.0% |
Family Income by Famaliy Size in McNeil
2-person families (55 | 46.2%) account for the highest median family income in McNeil with $112,930 per family, while 2-person families (55 | 46.2%) have the highest median income of $56,465 per family member.
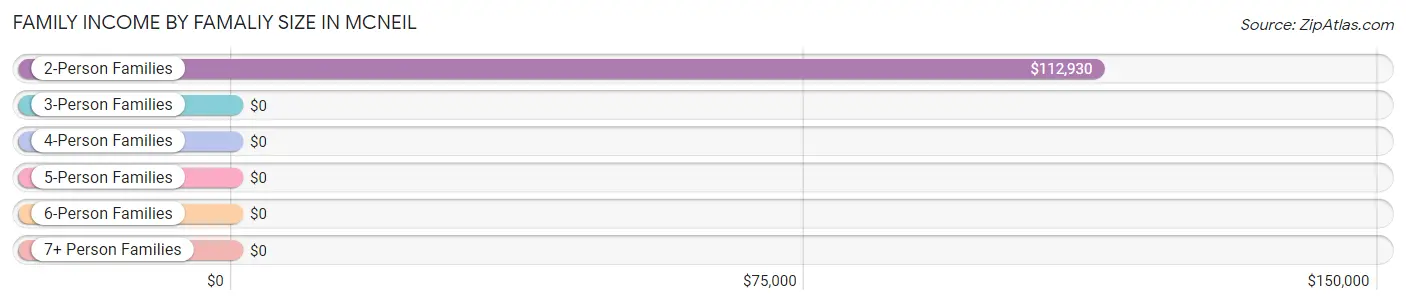
| Income Bracket | # Families | Median Income |
| 2-Person Families | 55 (46.2%) | $112,930 |
| 3-Person Families | 20 (16.8%) | $0 |
| 4-Person Families | 30 (25.2%) | $0 |
| 5-Person Families | 14 (11.8%) | $0 |
| 6-Person Families | 0 (0.0%) | $0 |
| 7+ Person Families | 0 (0.0%) | $0 |
| Total | 119 (100.0%) | $55,417 |
Family Income by Number of Earners in McNeil
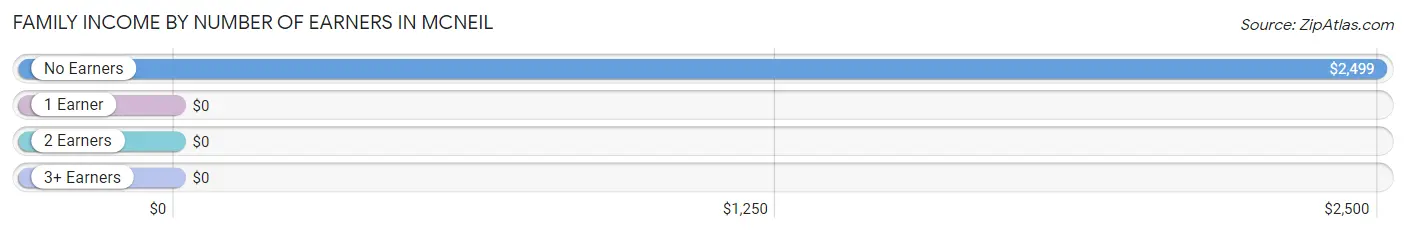
| Number of Earners | # Families | Median Income |
| No Earners | 15 (12.6%) | $2,499 |
| 1 Earner | 20 (16.8%) | $0 |
| 2 Earners | 79 (66.4%) | $0 |
| 3+ Earners | 5 (4.2%) | $0 |
| Total | 119 (100.0%) | $55,417 |
Household Income in McNeil
Household Income Brackets in McNeil
With 36 households falling in the category, the $50,000 to $74,999 income range is the most frequent in McNeil, accounting for 17.1% of all households.
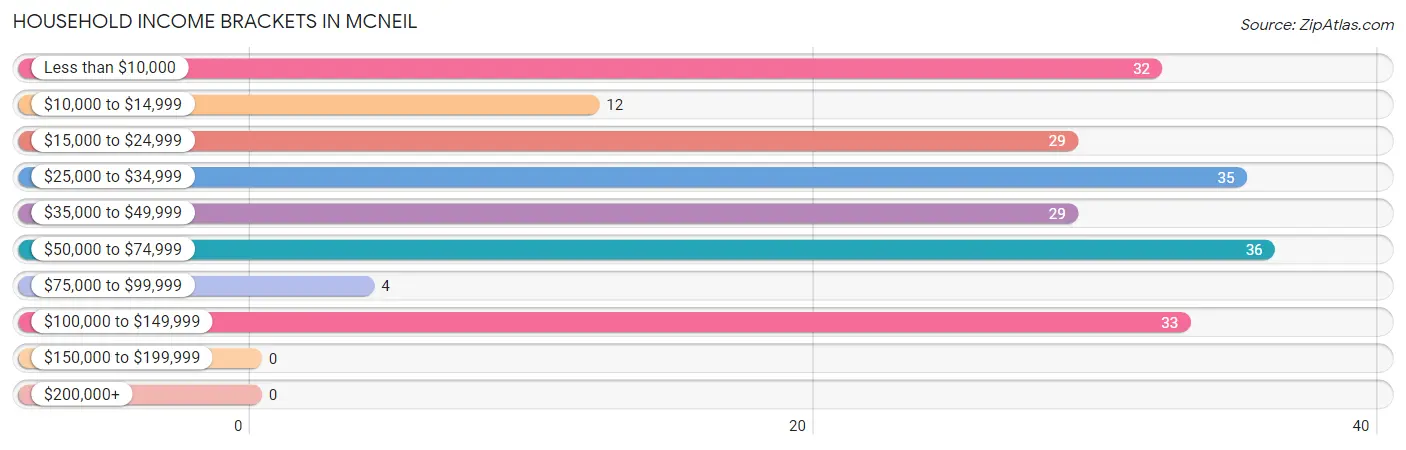
| Income Bracket | # Households | % Households |
| Less than $10,000 | 32 | 15.2% |
| $10,000 to $14,999 | 12 | 5.7% |
| $15,000 to $24,999 | 29 | 13.8% |
| $25,000 to $34,999 | 35 | 16.7% |
| $35,000 to $49,999 | 29 | 13.8% |
| $50,000 to $74,999 | 36 | 17.1% |
| $75,000 to $99,999 | 4 | 1.9% |
| $100,000 to $149,999 | 33 | 15.7% |
| $150,000 to $199,999 | 0 | 0.0% |
| $200,000+ | 0 | 0.0% |
Household Income by Householder Age in McNeil
The median household income in McNeil is $34,625, with the highest median household income of $33,571 found in the 25 to 44 years age bracket for the primary householder. A total of 88 households (41.9%) fall into this category. Meanwhile, the 15 to 24 years age bracket for the primary householder has the lowest median household income of $0, with 11 households (5.2%) in this group.
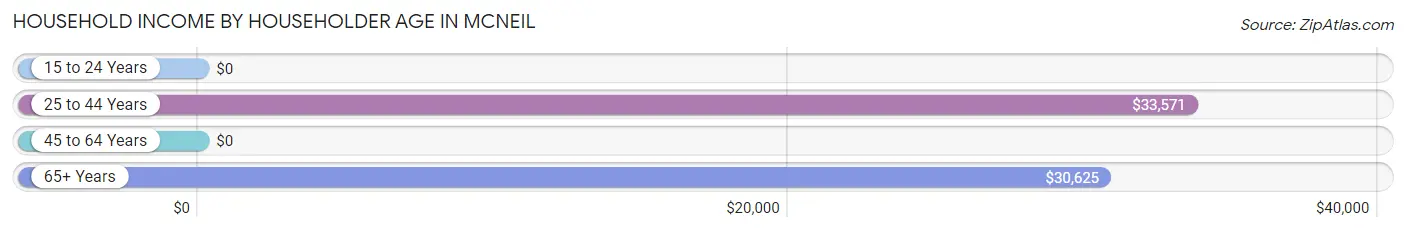
| Income Bracket | # Households | Median Income |
| 15 to 24 Years | 11 (5.2%) | $0 |
| 25 to 44 Years | 88 (41.9%) | $33,571 |
| 45 to 64 Years | 70 (33.3%) | $0 |
| 65+ Years | 41 (19.5%) | $30,625 |
| Total | 210 (100.0%) | $34,625 |
Poverty in McNeil
Income Below Poverty by Sex and Age in McNeil
With 38.4% poverty level for males and 34.2% for females among the residents of McNeil, under 5 year old males and under 5 year old females are the most vulnerable to poverty, with 21 males (100.0%) and 17 females (100.0%) in their respective age groups living below the poverty level.
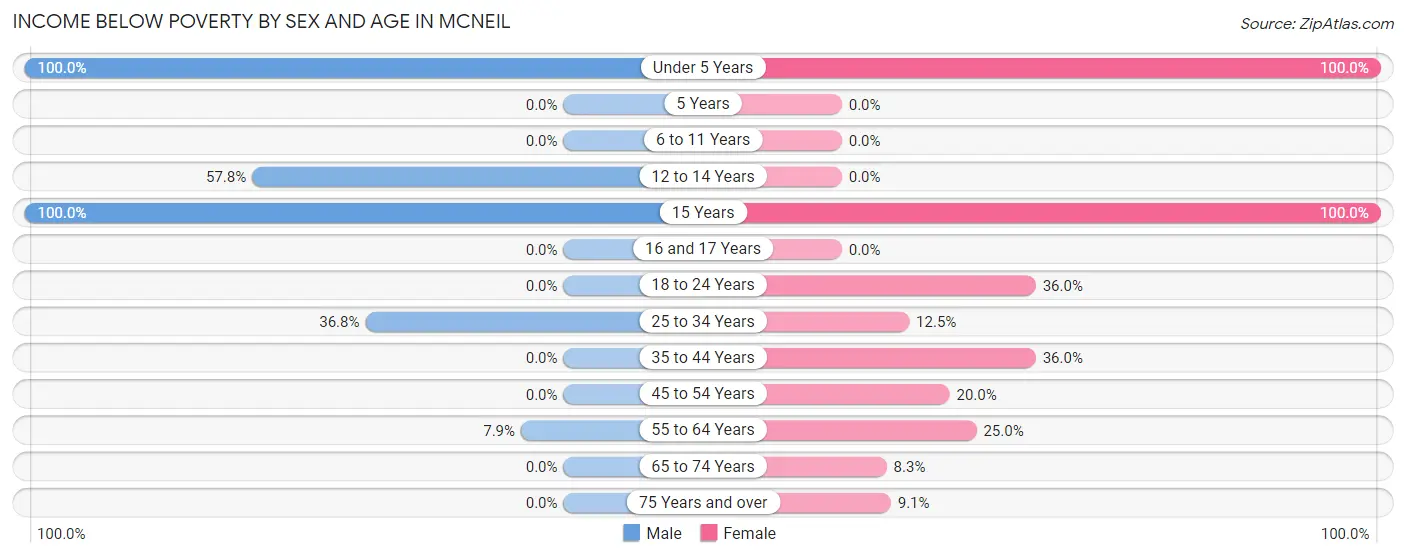
| Age Bracket | Male | Female |
| Under 5 Years | 21 (100.0%) | 17 (100.0%) |
| 5 Years | 0 (0.0%) | 0 (0.0%) |
| 6 to 11 Years | 0 (0.0%) | 0 (0.0%) |
| 12 to 14 Years | 26 (57.8%) | 0 (0.0%) |
| 15 Years | 13 (100.0%) | 13 (100.0%) |
| 16 and 17 Years | 0 (0.0%) | 0 (0.0%) |
| 18 to 24 Years | 0 (0.0%) | 9 (36.0%) |
| 25 to 34 Years | 25 (36.8%) | 2 (12.5%) |
| 35 to 44 Years | 0 (0.0%) | 27 (36.0%) |
| 45 to 54 Years | 0 (0.0%) | 2 (20.0%) |
| 55 to 64 Years | 3 (7.9%) | 16 (25.0%) |
| 65 to 74 Years | 0 (0.0%) | 2 (8.3%) |
| 75 Years and over | 0 (0.0%) | 1 (9.1%) |
| Total | 88 (38.4%) | 89 (34.2%) |
Income Above Poverty by Sex and Age in McNeil
According to the poverty statistics in McNeil, males aged 16 and 17 years and females aged 12 to 14 years are the age groups that are most secure financially, with 100.0% of males and 100.0% of females in these age groups living above the poverty line.
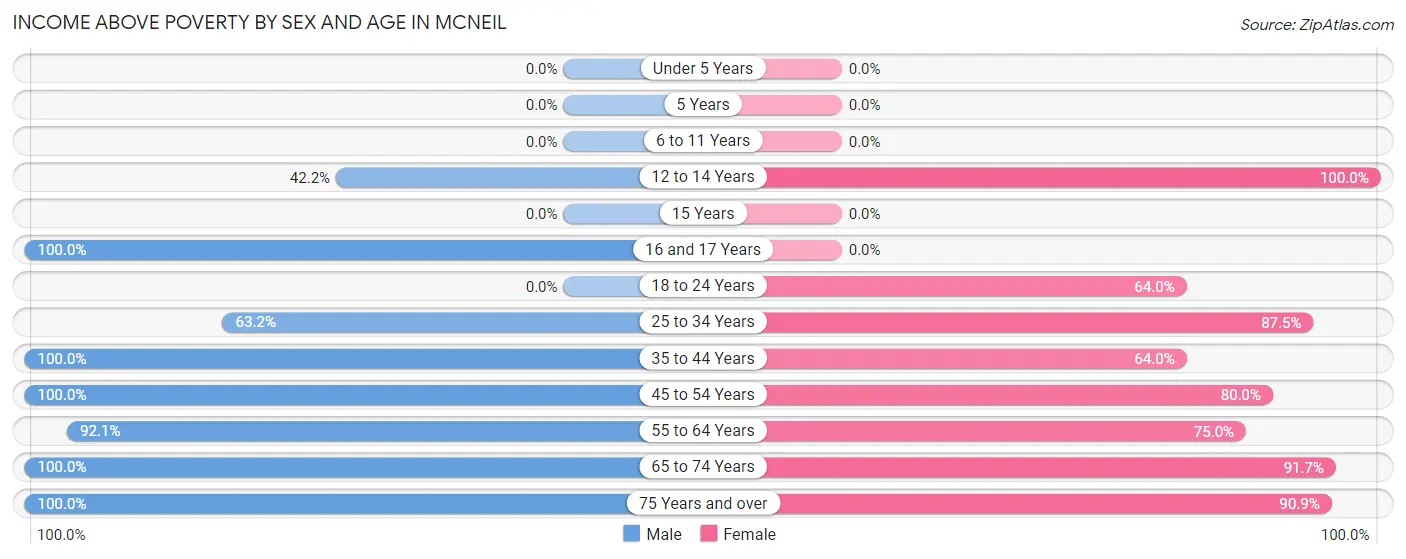
| Age Bracket | Male | Female |
| Under 5 Years | 0 (0.0%) | 0 (0.0%) |
| 5 Years | 0 (0.0%) | 0 (0.0%) |
| 6 to 11 Years | 0 (0.0%) | 0 (0.0%) |
| 12 to 14 Years | 19 (42.2%) | 5 (100.0%) |
| 15 Years | 0 (0.0%) | 0 (0.0%) |
| 16 and 17 Years | 15 (100.0%) | 0 (0.0%) |
| 18 to 24 Years | 0 (0.0%) | 16 (64.0%) |
| 25 to 34 Years | 43 (63.2%) | 14 (87.5%) |
| 35 to 44 Years | 16 (100.0%) | 48 (64.0%) |
| 45 to 54 Years | 3 (100.0%) | 8 (80.0%) |
| 55 to 64 Years | 35 (92.1%) | 48 (75.0%) |
| 65 to 74 Years | 5 (100.0%) | 22 (91.7%) |
| 75 Years and over | 5 (100.0%) | 10 (90.9%) |
| Total | 141 (61.6%) | 171 (65.8%) |
Income Below Poverty Among Married-Couple Families in McNeil
The poverty statistics for married-couple families in McNeil show that 19.2% or 14 of the total 73 families live below the poverty line. Families with 3 or 4 children have the highest poverty rate of 100.0%, comprising of 14 families. On the other hand, families with no children have the lowest poverty rate of 0.0%, which includes 0 families.
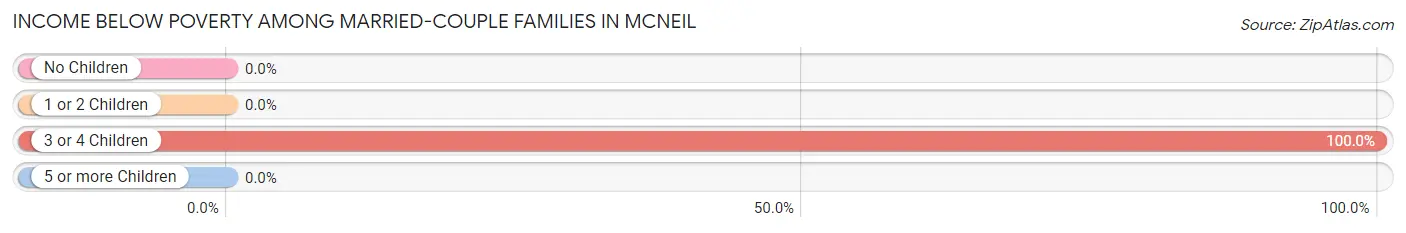
| Children | Above Poverty | Below Poverty |
| No Children | 43 (100.0%) | 0 (0.0%) |
| 1 or 2 Children | 16 (100.0%) | 0 (0.0%) |
| 3 or 4 Children | 0 (0.0%) | 14 (100.0%) |
| 5 or more Children | 0 (0.0%) | 0 (0.0%) |
| Total | 59 (80.8%) | 14 (19.2%) |
Income Below Poverty Among Single-Parent Households in McNeil
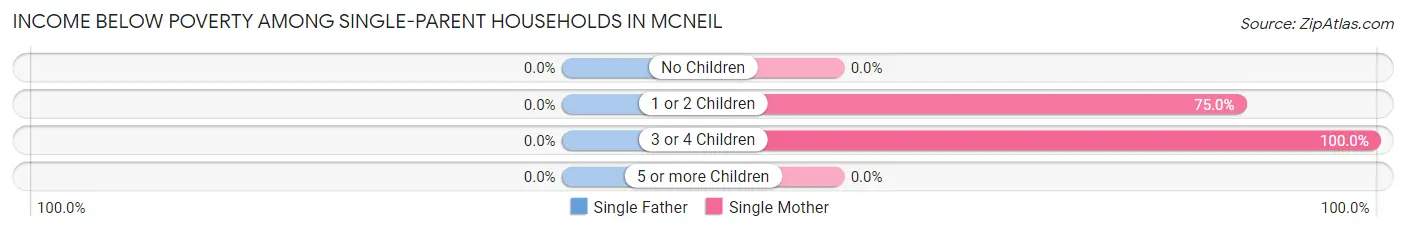
| Children | Single Father | Single Mother |
| No Children | 0 (0.0%) | 0 (0.0%) |
| 1 or 2 Children | 0 (0.0%) | 15 (75.0%) |
| 3 or 4 Children | 0 (0.0%) | 9 (100.0%) |
| 5 or more Children | 0 (0.0%) | 0 (0.0%) |
| Total | 0 (0.0%) | 24 (57.1%) |
Income Below Poverty Among Married-Couple vs Single-Parent Households in McNeil
The poverty data for McNeil shows that 14 of the married-couple family households (19.2%) and 24 of the single-parent households (52.2%) are living below the poverty level. Within the married-couple family households, those with 3 or 4 children have the highest poverty rate, with 14 households (100.0%) falling below the poverty line. Among the single-parent households, those with 3 or 4 children have the highest poverty rate, with 9 household (100.0%) living below poverty.
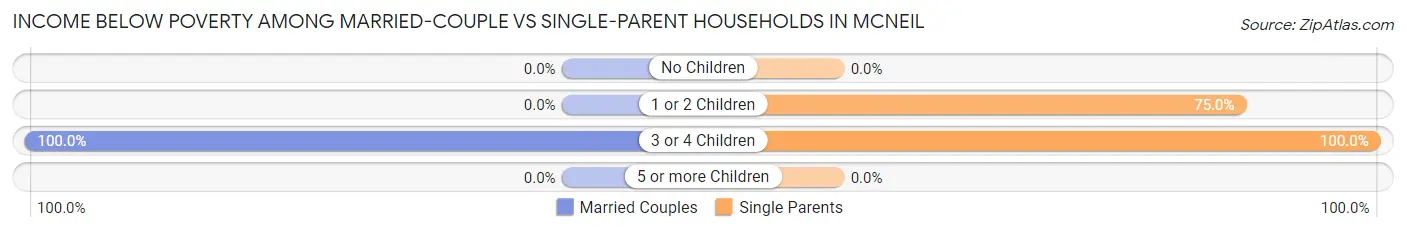
| Children | Married-Couple Families | Single-Parent Households |
| No Children | 0 (0.0%) | 0 (0.0%) |
| 1 or 2 Children | 0 (0.0%) | 15 (75.0%) |
| 3 or 4 Children | 14 (100.0%) | 9 (100.0%) |
| 5 or more Children | 0 (0.0%) | 0 (0.0%) |
| Total | 14 (19.2%) | 24 (52.2%) |
Race in McNeil
The most populous races in McNeil are Black / African American (252 | 51.5%), White / Caucasian (213 | 43.6%), and Two or more Races (24 | 4.9%).
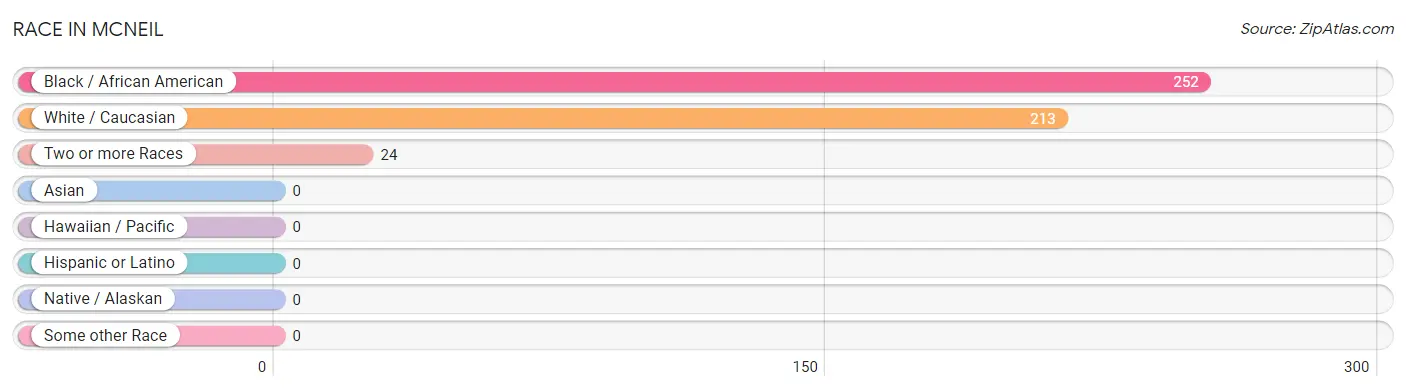
| Race | # Population | % Population |
| Asian | 0 | 0.0% |
| Black / African American | 252 | 51.5% |
| Hawaiian / Pacific | 0 | 0.0% |
| Hispanic or Latino | 0 | 0.0% |
| Native / Alaskan | 0 | 0.0% |
| White / Caucasian | 213 | 43.6% |
| Two or more Races | 24 | 4.9% |
| Some other Race | 0 | 0.0% |
| Total | 489 | 100.0% |
Ancestry in McNeil
The most populous ancestries reported in McNeil are American (112 | 22.9%), English (75 | 15.3%), French (74 | 15.1%), German (41 | 8.4%), and Irish (9 | 1.8%), together accounting for 63.6% of all McNeil residents.
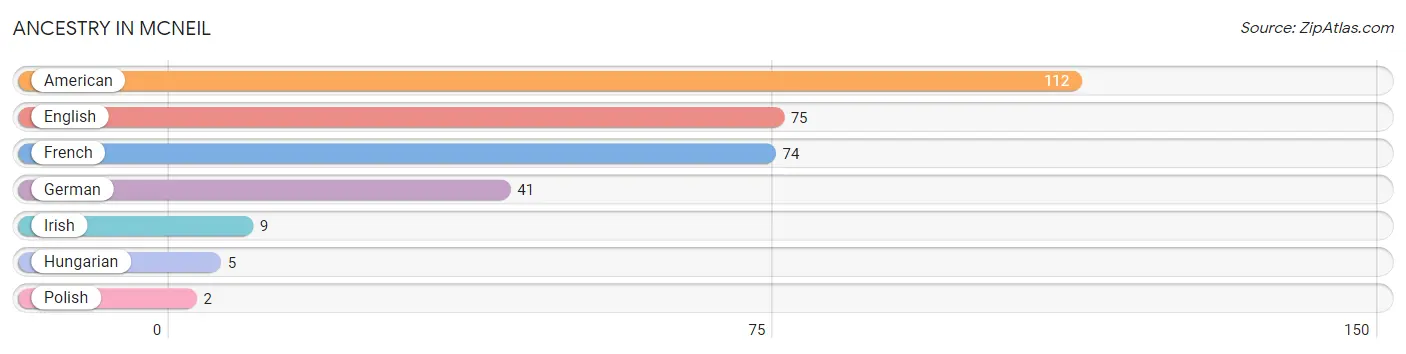
| Ancestry | # Population | % Population |
| American | 112 | 22.9% |
| English | 75 | 15.3% |
| French | 74 | 15.1% |
| German | 41 | 8.4% |
| Hungarian | 5 | 1.0% |
| Irish | 9 | 1.8% |
| Polish | 2 | 0.4% | View All 7 Rows |
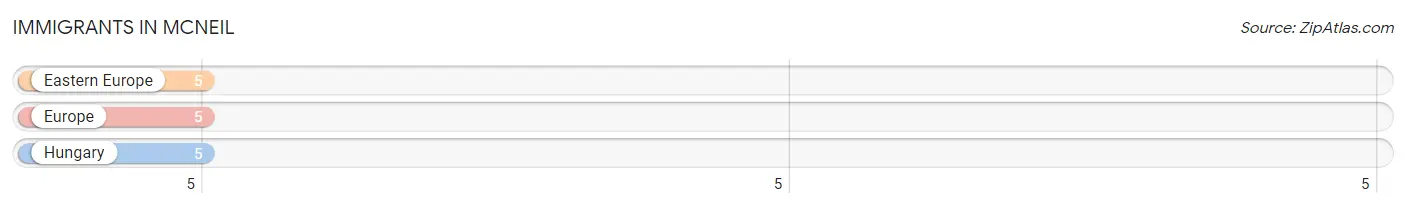
Immigrants in McNeil
The most numerous immigrant groups reported in McNeil came from Eastern Europe (5 | 1.0%), Europe (5 | 1.0%), and Hungary (5 | 1.0%), together accounting for 3.1% of all McNeil residents.
| Immigration Origin | # Population | % Population |
| Eastern Europe | 5 | 1.0% |
| Europe | 5 | 1.0% |
| Hungary | 5 | 1.0% | View All 3 Rows |
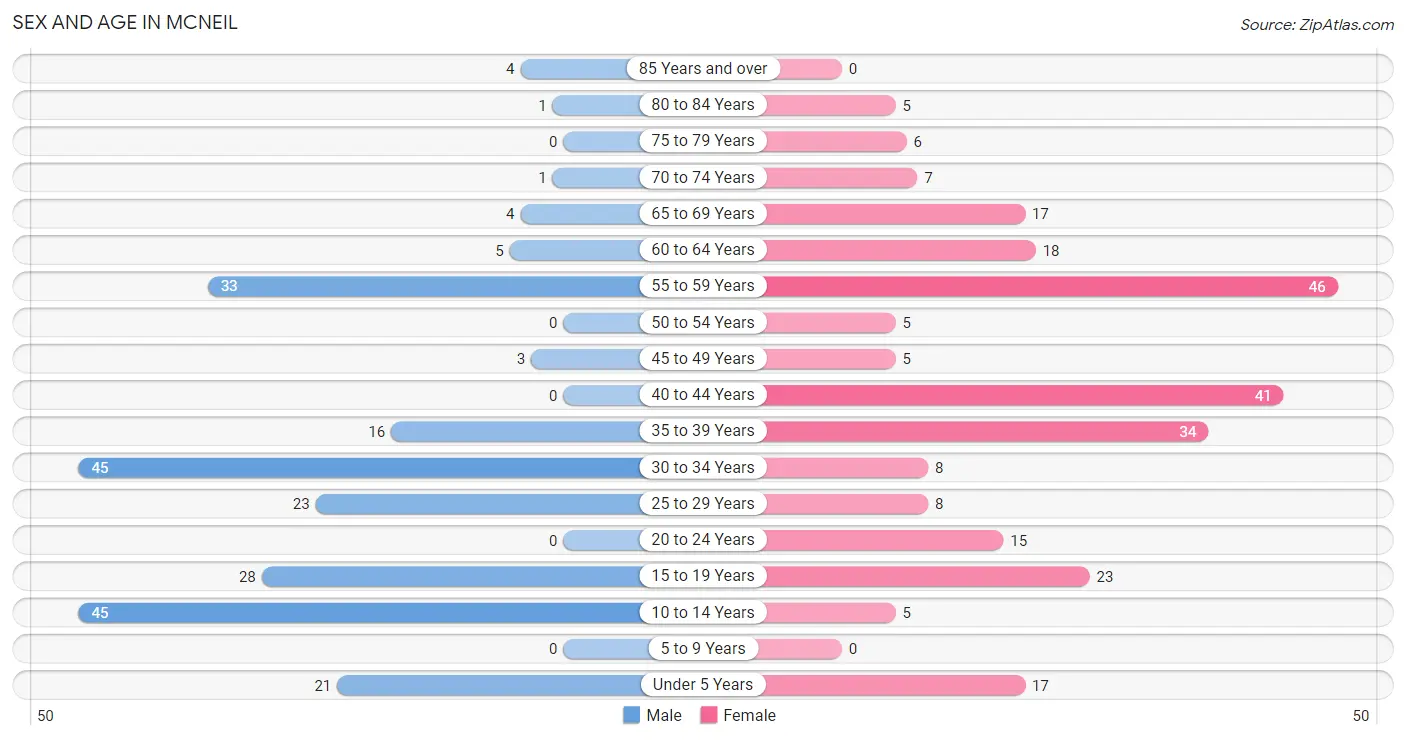
Sex and Age in McNeil
Sex and Age in McNeil
The most populous age groups in McNeil are 10 to 14 Years (45 | 19.7%) for men and 55 to 59 Years (46 | 17.7%) for women.
| Age Bracket | Male | Female |
| Under 5 Years | 21 (9.2%) | 17 (6.5%) |
| 5 to 9 Years | 0 (0.0%) | 0 (0.0%) |
| 10 to 14 Years | 45 (19.7%) | 5 (1.9%) |
| 15 to 19 Years | 28 (12.2%) | 23 (8.8%) |
| 20 to 24 Years | 0 (0.0%) | 15 (5.8%) |
| 25 to 29 Years | 23 (10.0%) | 8 (3.1%) |
| 30 to 34 Years | 45 (19.7%) | 8 (3.1%) |
| 35 to 39 Years | 16 (7.0%) | 34 (13.1%) |
| 40 to 44 Years | 0 (0.0%) | 41 (15.8%) |
| 45 to 49 Years | 3 (1.3%) | 5 (1.9%) |
| 50 to 54 Years | 0 (0.0%) | 5 (1.9%) |
| 55 to 59 Years | 33 (14.4%) | 46 (17.7%) |
| 60 to 64 Years | 5 (2.2%) | 18 (6.9%) |
| 65 to 69 Years | 4 (1.8%) | 17 (6.5%) |
| 70 to 74 Years | 1 (0.4%) | 7 (2.7%) |
| 75 to 79 Years | 0 (0.0%) | 6 (2.3%) |
| 80 to 84 Years | 1 (0.4%) | 5 (1.9%) |
| 85 Years and over | 4 (1.8%) | 0 (0.0%) |
| Total | 229 (100.0%) | 260 (100.0%) |
Families and Households in McNeil
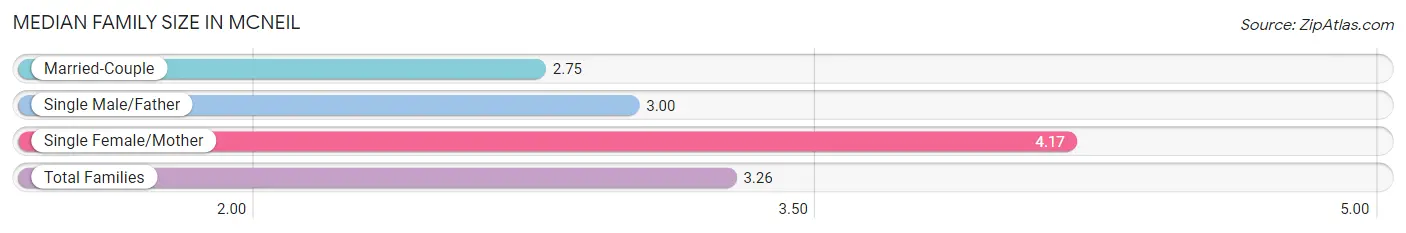
Median Family Size in McNeil
The median family size in McNeil is 3.26 persons per family, with single female/mother families (42 | 35.3%) accounting for the largest median family size of 4.17 persons per family. On the other hand, married-couple families (73 | 61.3%) represent the smallest median family size with 2.75 persons per family.
| Family Type | # Families | Family Size |
| Married-Couple | 73 (61.3%) | 2.75 |
| Single Male/Father | 4 (3.4%) | 3.00 |
| Single Female/Mother | 42 (35.3%) | 4.17 |
| Total Families | 119 (100.0%) | 3.26 |
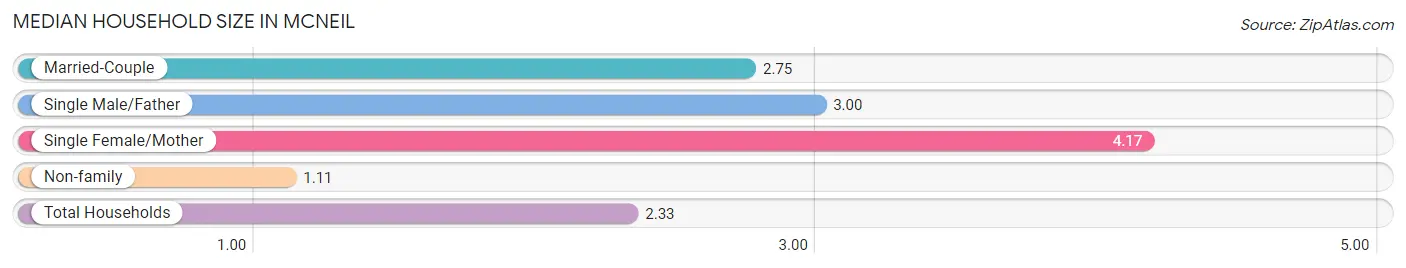
Median Household Size in McNeil
The median household size in McNeil is 2.33 persons per household, with single female/mother households (42 | 20.0%) accounting for the largest median household size of 4.17 persons per household. non-family households (91 | 43.3%) represent the smallest median household size with 1.11 persons per household.
| Household Type | # Households | Household Size |
| Married-Couple | 73 (34.8%) | 2.75 |
| Single Male/Father | 4 (1.9%) | 3.00 |
| Single Female/Mother | 42 (20.0%) | 4.17 |
| Non-family | 91 (43.3%) | 1.11 |
| Total Households | 210 (100.0%) | 2.33 |
Household Size by Marriage Status in McNeil
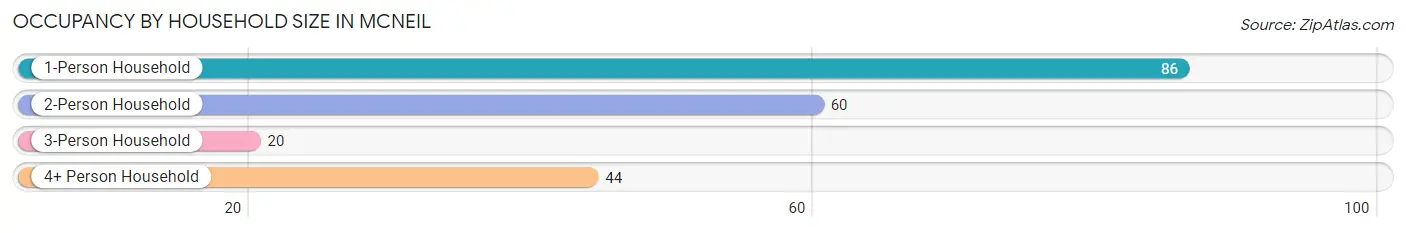
Out of a total of 210 households in McNeil, 119 (56.7%) are family households, while 91 (43.3%) are nonfamily households. The most numerous type of family households are 2-person households, comprising 55, and the most common type of nonfamily households are 1-person households, comprising 86.
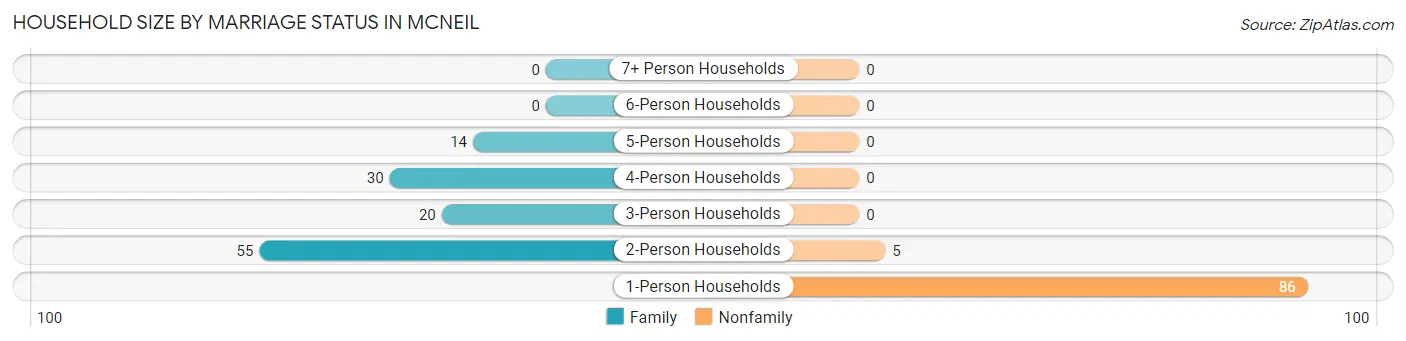
| Household Size | Family Households | Nonfamily Households |
| 1-Person Households | - | 86 (40.9%) |
| 2-Person Households | 55 (26.2%) | 5 (2.4%) |
| 3-Person Households | 20 (9.5%) | 0 (0.0%) |
| 4-Person Households | 30 (14.3%) | 0 (0.0%) |
| 5-Person Households | 14 (6.7%) | 0 (0.0%) |
| 6-Person Households | 0 (0.0%) | 0 (0.0%) |
| 7+ Person Households | 0 (0.0%) | 0 (0.0%) |
| Total | 119 (56.7%) | 91 (43.3%) |
Female Fertility in McNeil
Fertility by Age in McNeil
Average fertility rate in McNeil is 67.0 births per 1,000 women. Women in the age bracket of 20 to 34 years have the highest fertility rate with 290.0 births per 1,000 women. Women in the age bracket of 20 to 34 years acount for 100.0% of all women with births.
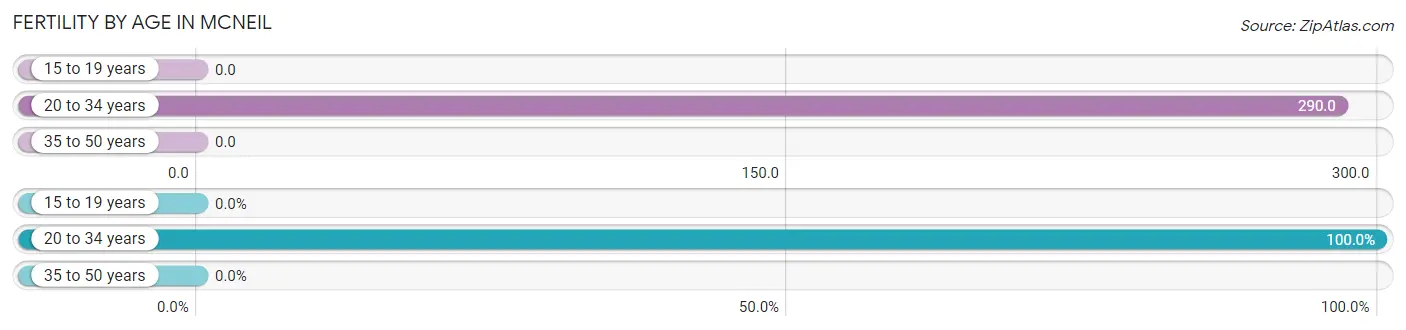
| Age Bracket | Women with Births | Births / 1,000 Women |
| 15 to 19 years | 0 (0.0%) | 0.0 |
| 20 to 34 years | 9 (100.0%) | 290.0 |
| 35 to 50 years | 0 (0.0%) | 0.0 |
| Total | 9 (100.0%) | 67.0 |
Fertility by Age by Marriage Status in McNeil
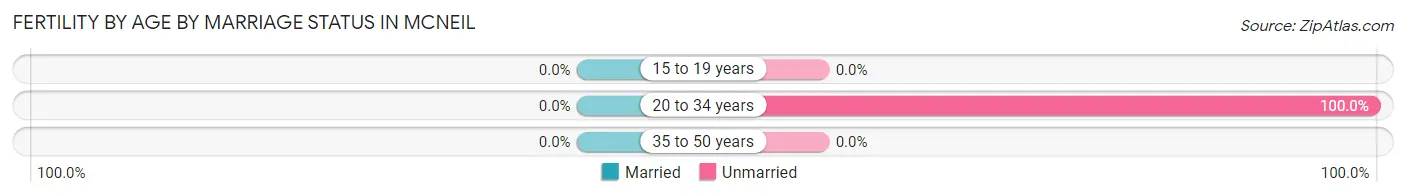
| Age Bracket | Married | Unmarried |
| 15 to 19 years | 0 (0.0%) | 0 (0.0%) |
| 20 to 34 years | 0 (0.0%) | 9 (100.0%) |
| 35 to 50 years | 0 (0.0%) | 0 (0.0%) |
| Total | 0 (0.0%) | 9 (100.0%) |
Fertility by Education in McNeil
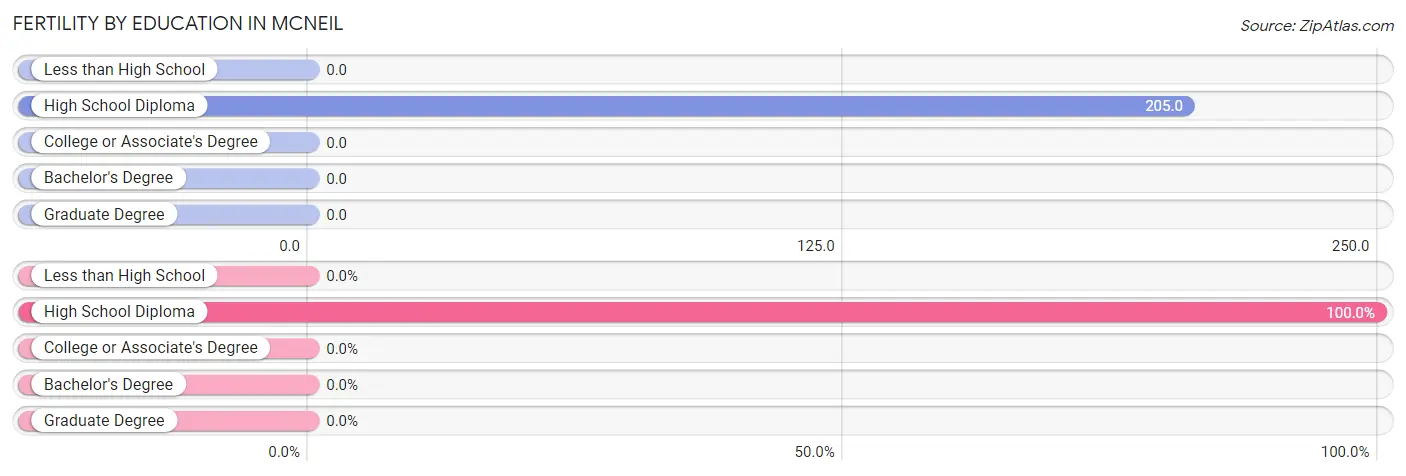
| Educational Attainment | Women with Births | Births / 1,000 Women |
| Less than High School | 0 (0.0%) | 0.0 |
| High School Diploma | 9 (100.0%) | 205.0 |
| College or Associate's Degree | 0 (0.0%) | 0.0 |
| Bachelor's Degree | 0 (0.0%) | 0.0 |
| Graduate Degree | 0 (0.0%) | 0.0 |
| Total | 9 (100.0%) | 67.0 |
Fertility by Education by Marriage Status in McNeil
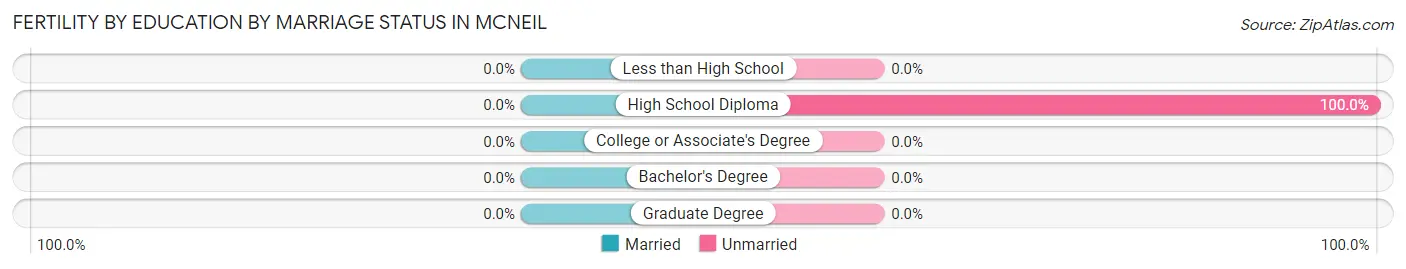
| Educational Attainment | Married | Unmarried |
| Less than High School | 0 (0.0%) | 0 (0.0%) |
| High School Diploma | 0 (0.0%) | 9 (100.0%) |
| College or Associate's Degree | 0 (0.0%) | 0 (0.0%) |
| Bachelor's Degree | 0 (0.0%) | 0 (0.0%) |
| Graduate Degree | 0 (0.0%) | 0 (0.0%) |
| Total | 0 (0.0%) | 9 (100.0%) |
Employment Characteristics in McNeil
Employment by Class of Employer in McNeil
Among the 252 employed individuals in McNeil, private company employees (211 | 83.7%), local government employees (30 | 11.9%), and not-for-profit organizations (11 | 4.4%) make up the most common classes of employment.
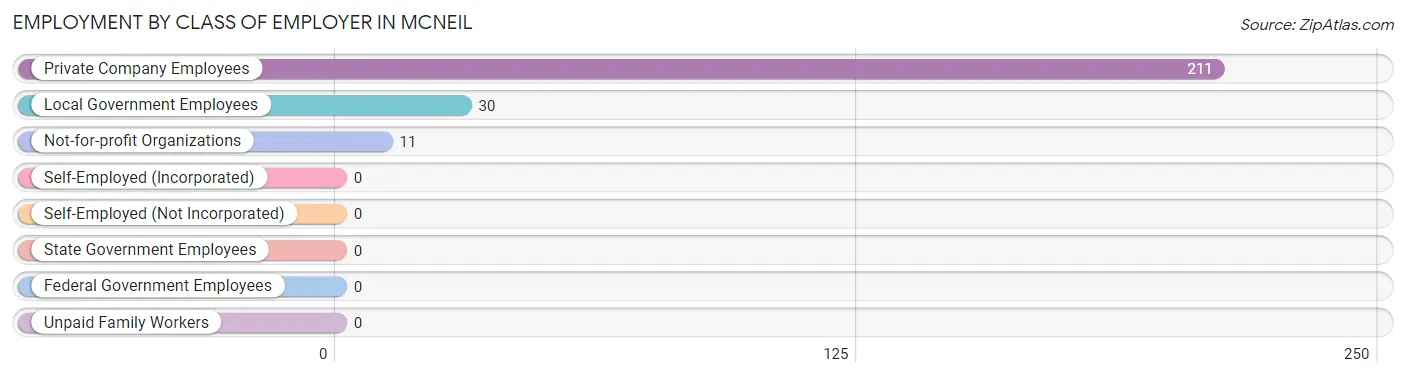
| Employer Class | # Employees | % Employees |
| Private Company Employees | 211 | 83.7% |
| Self-Employed (Incorporated) | 0 | 0.0% |
| Self-Employed (Not Incorporated) | 0 | 0.0% |
| Not-for-profit Organizations | 11 | 4.4% |
| Local Government Employees | 30 | 11.9% |
| State Government Employees | 0 | 0.0% |
| Federal Government Employees | 0 | 0.0% |
| Unpaid Family Workers | 0 | 0.0% |
| Total | 252 | 100.0% |
Employment Status by Age in McNeil
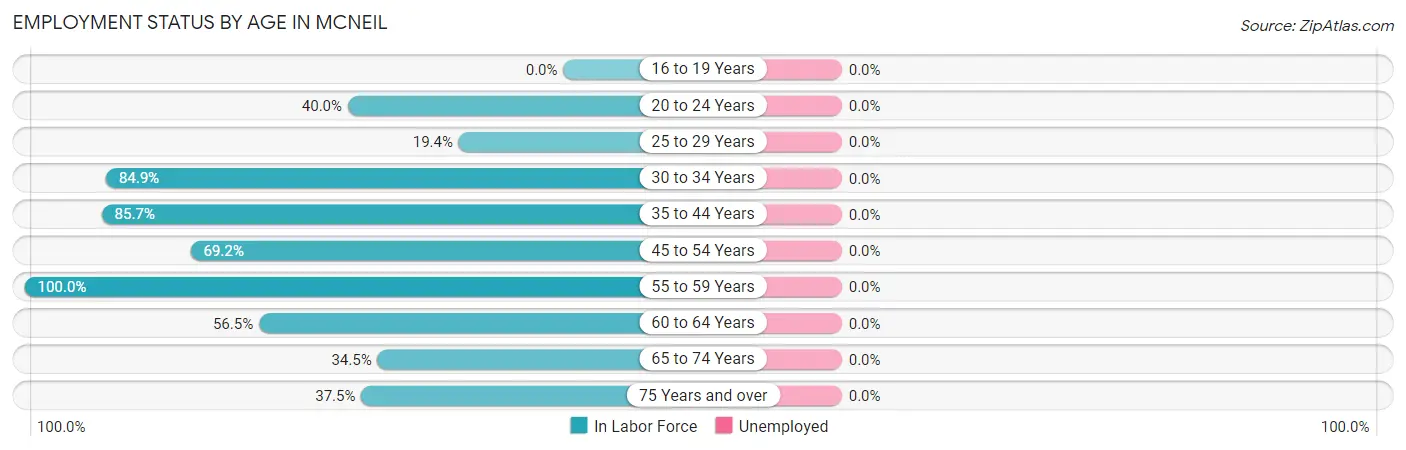
| Age Bracket | In Labor Force | Unemployed |
| 16 to 19 Years | 0 (0.0%) | 0 (0.0%) |
| 20 to 24 Years | 6 (40.0%) | 0 (0.0%) |
| 25 to 29 Years | 6 (19.4%) | 0 (0.0%) |
| 30 to 34 Years | 45 (84.9%) | 0 (0.0%) |
| 35 to 44 Years | 78 (85.7%) | 0 (0.0%) |
| 45 to 54 Years | 9 (69.2%) | 0 (0.0%) |
| 55 to 59 Years | 79 (100.0%) | 0 (0.0%) |
| 60 to 64 Years | 13 (56.5%) | 0 (0.0%) |
| 65 to 74 Years | 10 (34.5%) | 0 (0.0%) |
| 75 Years and over | 6 (37.5%) | 0 (0.0%) |
| Total | 252 (67.2%) | 0 (0.0%) |
Employment Status by Educational Attainment in McNeil
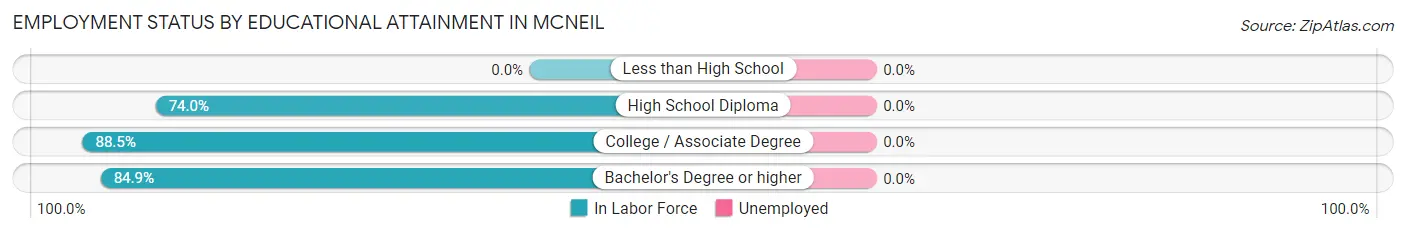
| Educational Attainment | In Labor Force | Unemployed |
| Less than High School | 0 (0.0%) | 0 (0.0%) |
| High School Diploma | 111 (74.0%) | 0 (0.0%) |
| College / Associate Degree | 46 (88.5%) | 0 (0.0%) |
| Bachelor's Degree or higher | 73 (84.9%) | 0 (0.0%) |
| Total | 230 (79.3%) | 0 (0.0%) |
Employment Occupations by Sex in McNeil
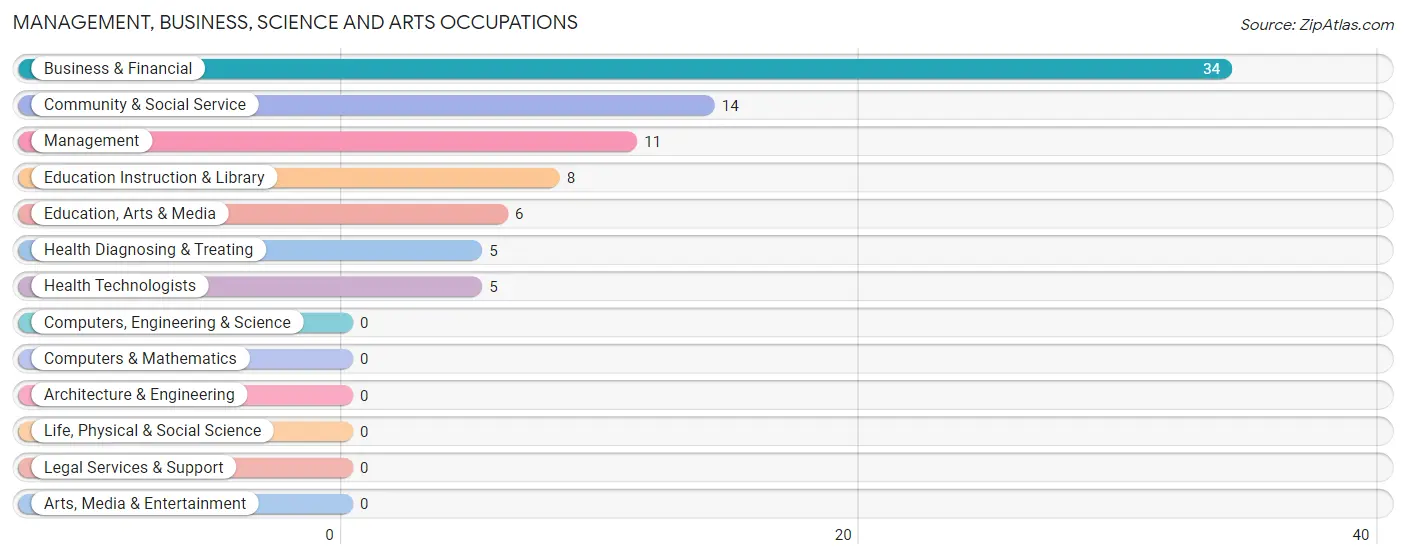
Management, Business, Science and Arts Occupations
The most common Management, Business, Science and Arts occupations in McNeil are Business & Financial (34 | 13.5%), Community & Social Service (14 | 5.6%), Management (11 | 4.4%), Education Instruction & Library (8 | 3.2%), and Education, Arts & Media (6 | 2.4%).
Management, Business, Science and Arts Occupations by Sex
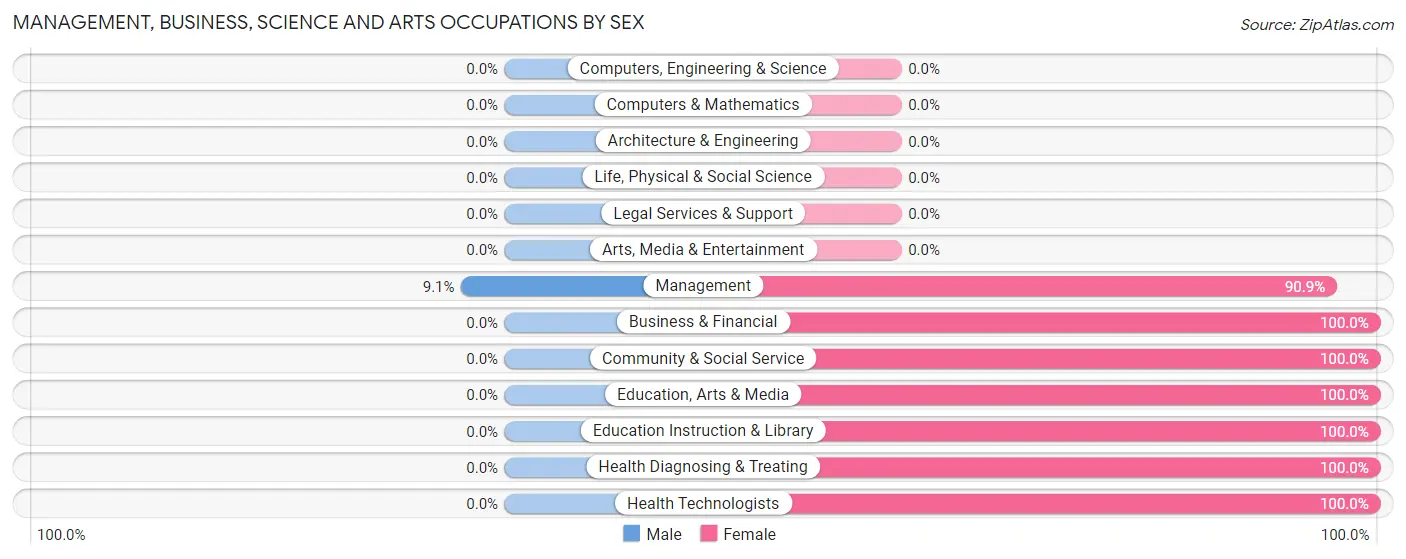
| Occupation | Male | Female |
| Management | 1 (9.1%) | 10 (90.9%) |
| Business & Financial | 0 (0.0%) | 34 (100.0%) |
| Computers, Engineering & Science | 0 (0.0%) | 0 (0.0%) |
| Computers & Mathematics | 0 (0.0%) | 0 (0.0%) |
| Architecture & Engineering | 0 (0.0%) | 0 (0.0%) |
| Life, Physical & Social Science | 0 (0.0%) | 0 (0.0%) |
| Community & Social Service | 0 (0.0%) | 14 (100.0%) |
| Education, Arts & Media | 0 (0.0%) | 6 (100.0%) |
| Legal Services & Support | 0 (0.0%) | 0 (0.0%) |
| Education Instruction & Library | 0 (0.0%) | 8 (100.0%) |
| Arts, Media & Entertainment | 0 (0.0%) | 0 (0.0%) |
| Health Diagnosing & Treating | 0 (0.0%) | 5 (100.0%) |
| Health Technologists | 0 (0.0%) | 5 (100.0%) |
| Total (Category) | 1 (1.6%) | 63 (98.4%) |
| Total (Overall) | 101 (40.1%) | 151 (59.9%) |
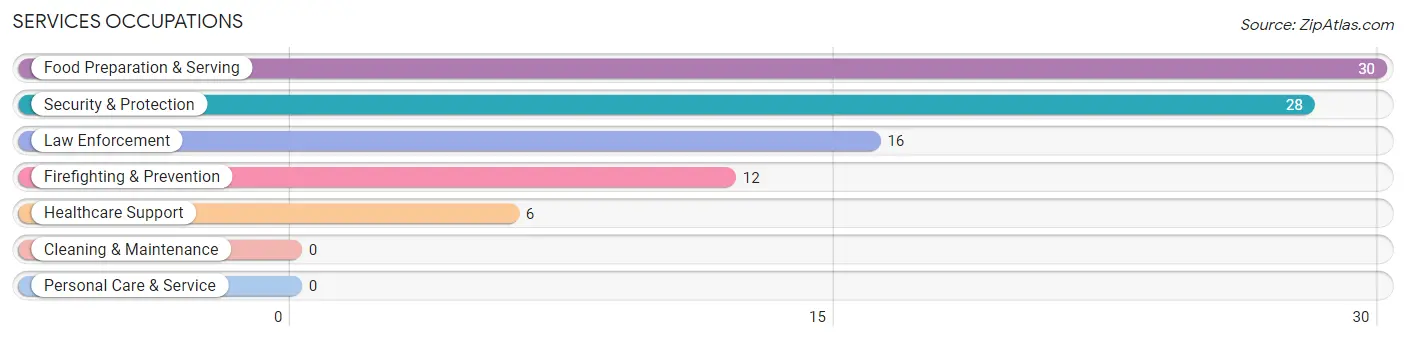
Services Occupations
The most common Services occupations in McNeil are Food Preparation & Serving (30 | 11.9%), Security & Protection (28 | 11.1%), Law Enforcement (16 | 6.4%), Firefighting & Prevention (12 | 4.8%), and Healthcare Support (6 | 2.4%).
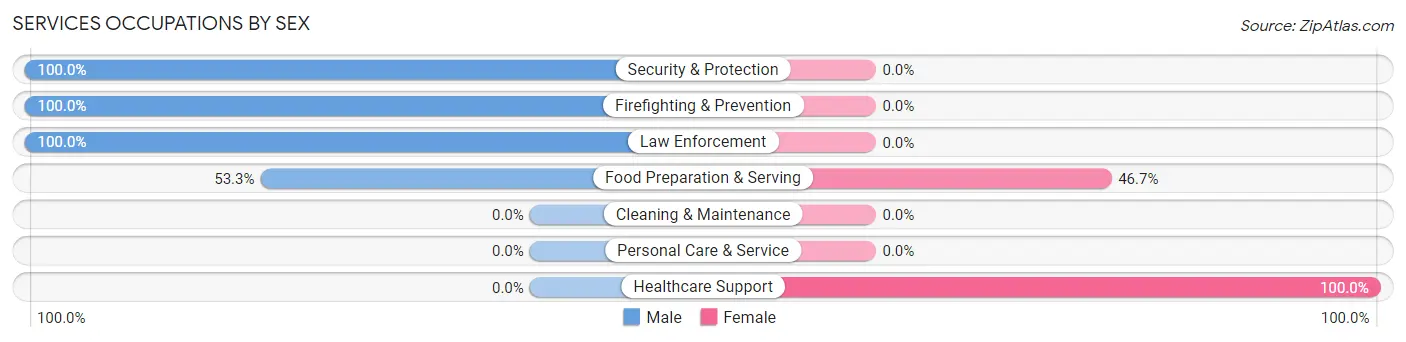
Services Occupations by Sex
Within the Services occupations in McNeil, the most male-oriented occupations are Security & Protection (100.0%), Firefighting & Prevention (100.0%), and Law Enforcement (100.0%), while the most female-oriented occupations are Healthcare Support (100.0%), and Food Preparation & Serving (46.7%).
| Occupation | Male | Female |
| Healthcare Support | 0 (0.0%) | 6 (100.0%) |
| Security & Protection | 28 (100.0%) | 0 (0.0%) |
| Firefighting & Prevention | 12 (100.0%) | 0 (0.0%) |
| Law Enforcement | 16 (100.0%) | 0 (0.0%) |
| Food Preparation & Serving | 16 (53.3%) | 14 (46.7%) |
| Cleaning & Maintenance | 0 (0.0%) | 0 (0.0%) |
| Personal Care & Service | 0 (0.0%) | 0 (0.0%) |
| Total (Category) | 44 (68.8%) | 20 (31.2%) |
| Total (Overall) | 101 (40.1%) | 151 (59.9%) |
Sales and Office Occupations
The most common Sales and Office occupations in McNeil are Office & Administration (41 | 16.3%), and Sales & Related (11 | 4.4%).
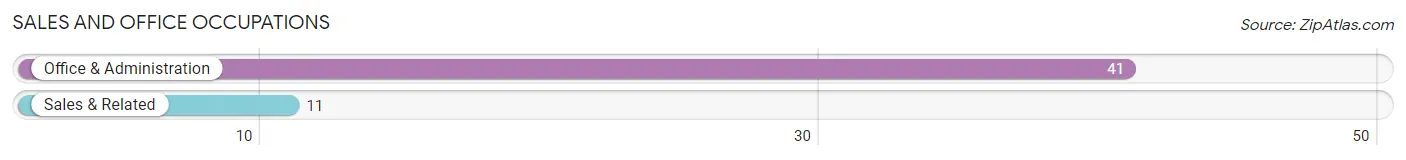
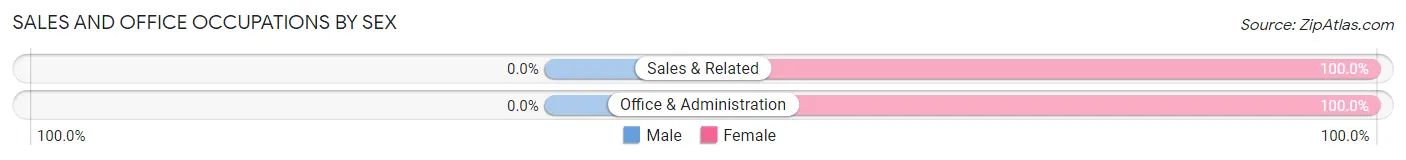
Sales and Office Occupations by Sex
| Occupation | Male | Female |
| Sales & Related | 0 (0.0%) | 11 (100.0%) |
| Office & Administration | 0 (0.0%) | 41 (100.0%) |
| Total (Category) | 0 (0.0%) | 52 (100.0%) |
| Total (Overall) | 101 (40.1%) | 151 (59.9%) |
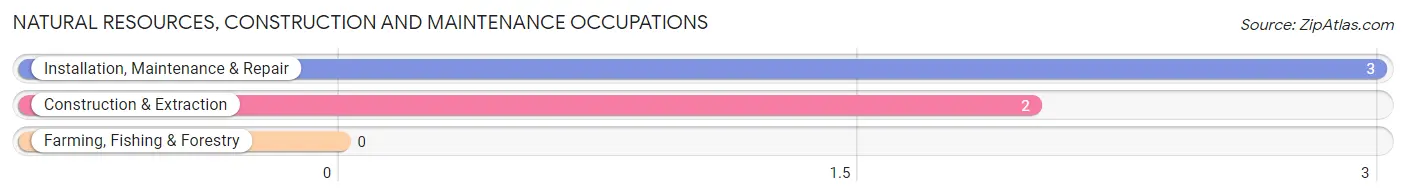
Natural Resources, Construction and Maintenance Occupations
The most common Natural Resources, Construction and Maintenance occupations in McNeil are Installation, Maintenance & Repair (3 | 1.2%), and Construction & Extraction (2 | 0.8%).
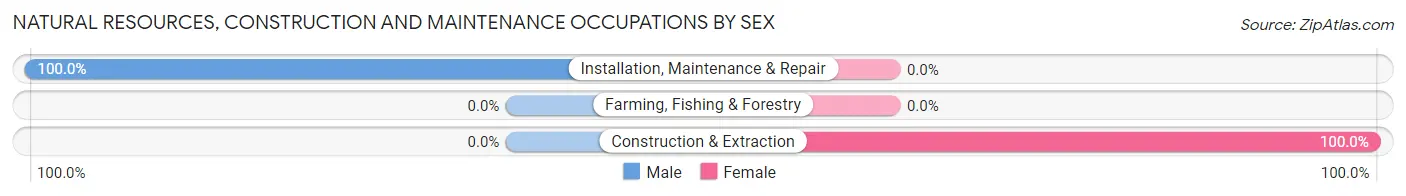
Natural Resources, Construction and Maintenance Occupations by Sex
| Occupation | Male | Female |
| Farming, Fishing & Forestry | 0 (0.0%) | 0 (0.0%) |
| Construction & Extraction | 0 (0.0%) | 2 (100.0%) |
| Installation, Maintenance & Repair | 3 (100.0%) | 0 (0.0%) |
| Total (Category) | 3 (60.0%) | 2 (40.0%) |
| Total (Overall) | 101 (40.1%) | 151 (59.9%) |
Production, Transportation and Moving Occupations
The most common Production, Transportation and Moving occupations in McNeil are Transportation (37 | 14.7%), and Production (30 | 11.9%).
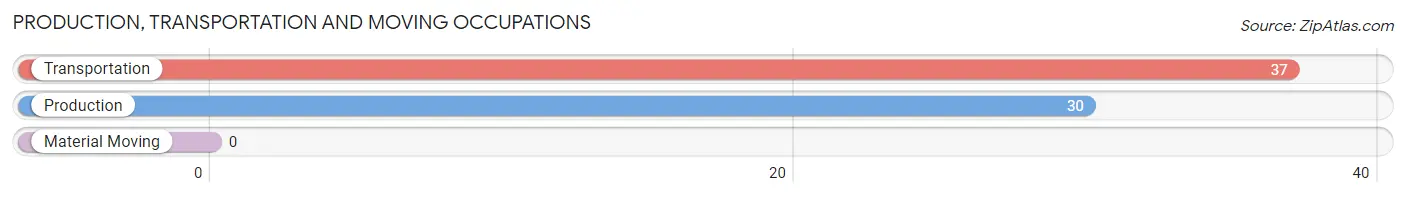
Production, Transportation and Moving Occupations by Sex
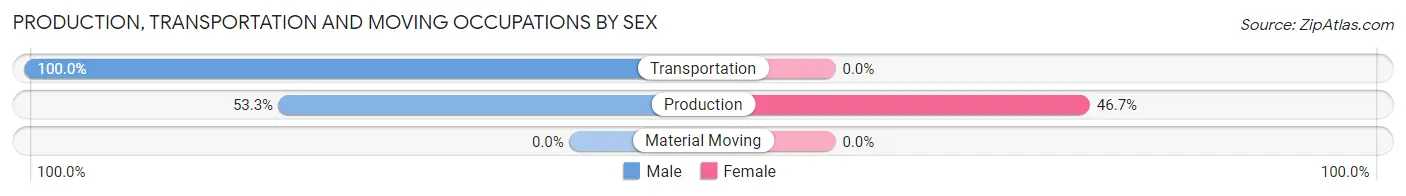
| Occupation | Male | Female |
| Production | 16 (53.3%) | 14 (46.7%) |
| Transportation | 37 (100.0%) | 0 (0.0%) |
| Material Moving | 0 (0.0%) | 0 (0.0%) |
| Total (Category) | 53 (79.1%) | 14 (20.9%) |
| Total (Overall) | 101 (40.1%) | 151 (59.9%) |
Employment Industries by Sex in McNeil
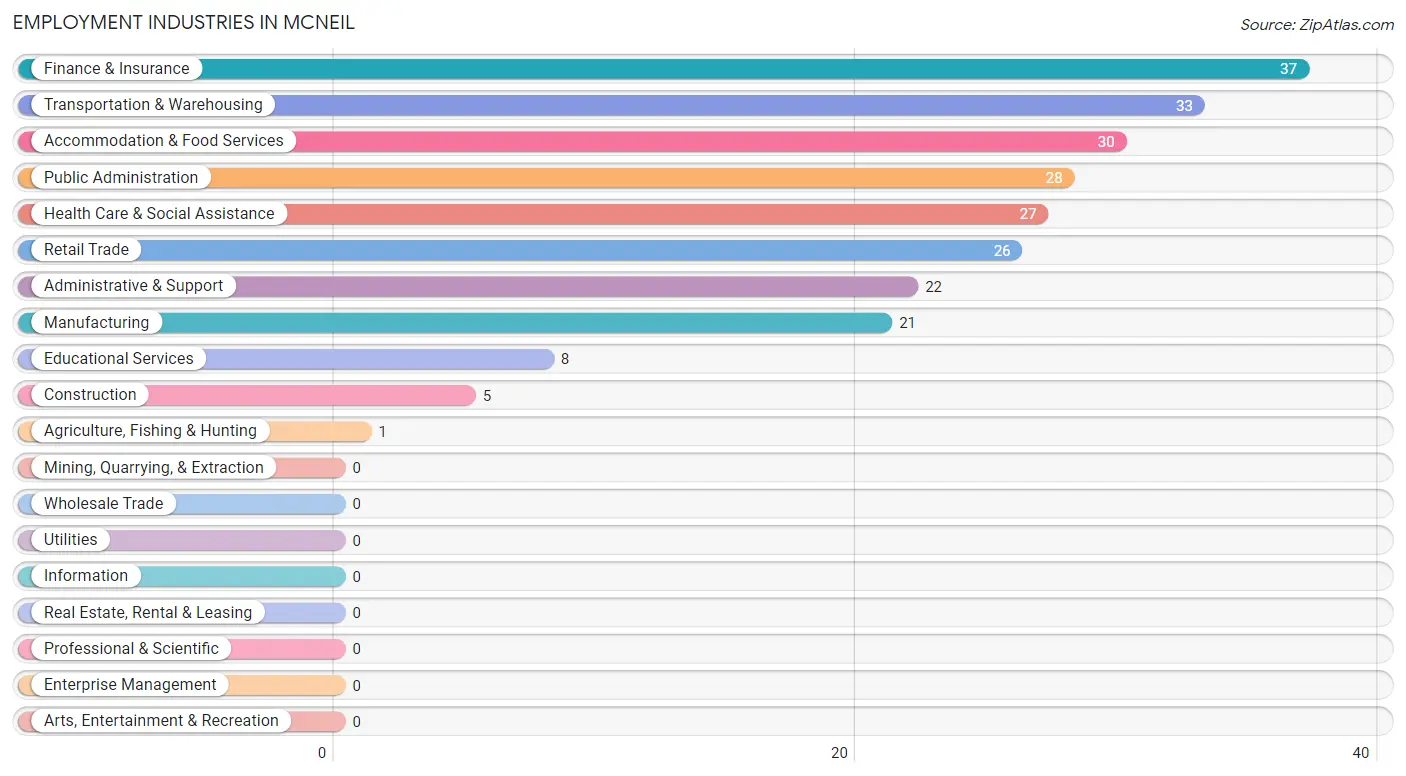
Employment Industries in McNeil
The major employment industries in McNeil include Finance & Insurance (37 | 14.7%), Transportation & Warehousing (33 | 13.1%), Accommodation & Food Services (30 | 11.9%), Public Administration (28 | 11.1%), and Health Care & Social Assistance (27 | 10.7%).
Employment Industries by Sex in McNeil
The McNeil industries that see more men than women are Agriculture, Fishing & Hunting (100.0%), Transportation & Warehousing (100.0%), and Manufacturing (95.2%), whereas the industries that tend to have a higher number of women are Retail Trade (100.0%), Finance & Insurance (100.0%), and Educational Services (100.0%).
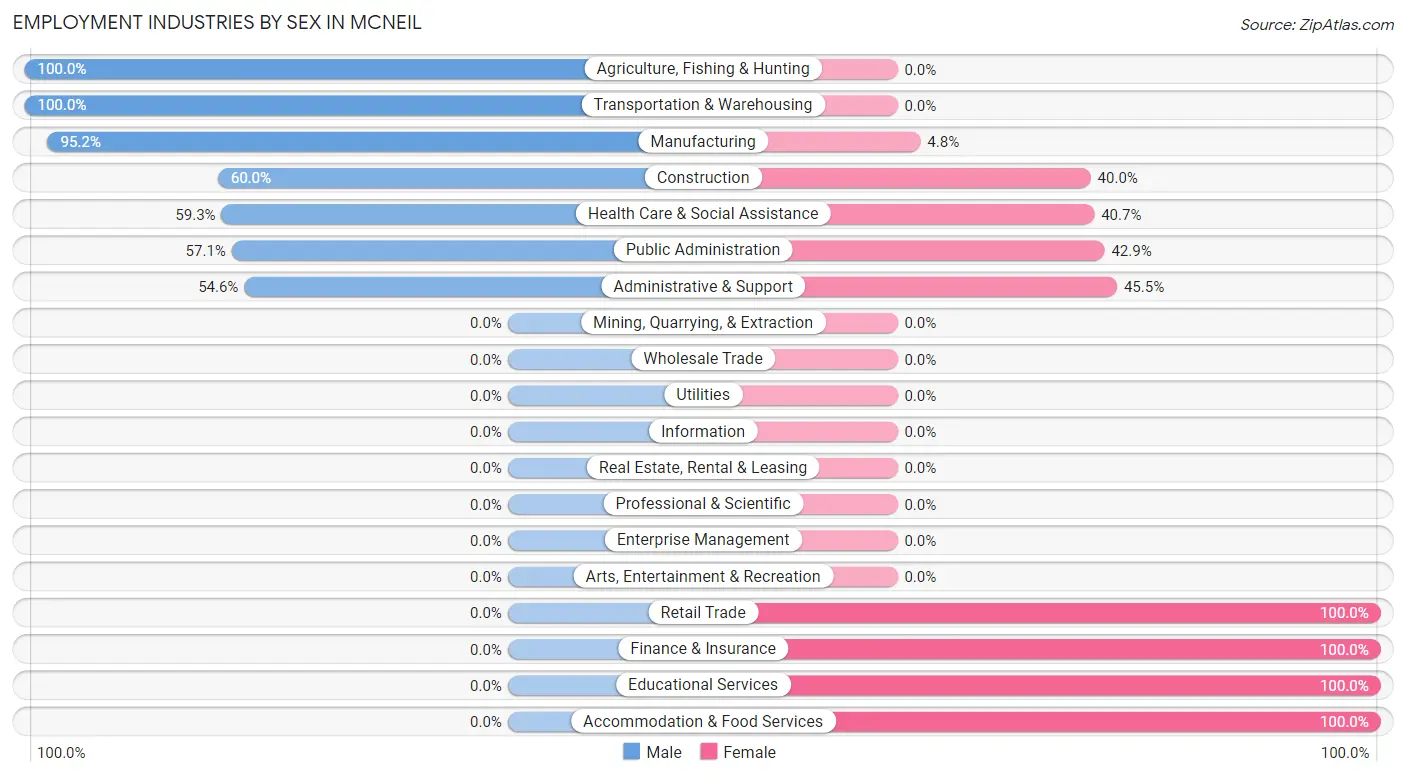
| Industry | Male | Female |
| Agriculture, Fishing & Hunting | 1 (100.0%) | 0 (0.0%) |
| Mining, Quarrying, & Extraction | 0 (0.0%) | 0 (0.0%) |
| Construction | 3 (60.0%) | 2 (40.0%) |
| Manufacturing | 20 (95.2%) | 1 (4.8%) |
| Wholesale Trade | 0 (0.0%) | 0 (0.0%) |
| Retail Trade | 0 (0.0%) | 26 (100.0%) |
| Transportation & Warehousing | 33 (100.0%) | 0 (0.0%) |
| Utilities | 0 (0.0%) | 0 (0.0%) |
| Information | 0 (0.0%) | 0 (0.0%) |
| Finance & Insurance | 0 (0.0%) | 37 (100.0%) |
| Real Estate, Rental & Leasing | 0 (0.0%) | 0 (0.0%) |
| Professional & Scientific | 0 (0.0%) | 0 (0.0%) |
| Enterprise Management | 0 (0.0%) | 0 (0.0%) |
| Administrative & Support | 12 (54.5%) | 10 (45.5%) |
| Educational Services | 0 (0.0%) | 8 (100.0%) |
| Health Care & Social Assistance | 16 (59.3%) | 11 (40.7%) |
| Arts, Entertainment & Recreation | 0 (0.0%) | 0 (0.0%) |
| Accommodation & Food Services | 0 (0.0%) | 30 (100.0%) |
| Public Administration | 16 (57.1%) | 12 (42.9%) |
| Total | 101 (40.1%) | 151 (59.9%) |
Education in McNeil
School Enrollment in McNeil
The most common levels of schooling among the 111 students in McNeil are high school (56 | 50.4%), middle school (35 | 31.5%), and nursery / preschool (10 | 9.0%).
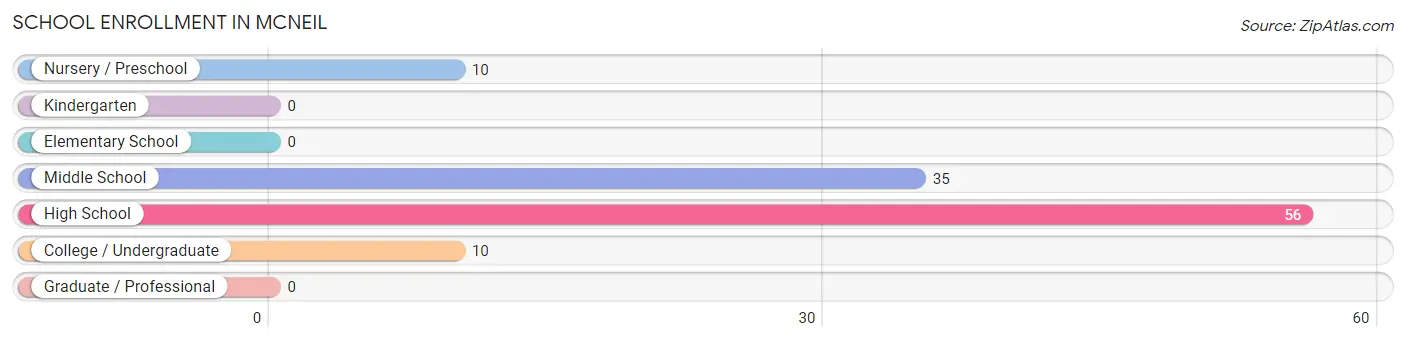
| School Level | # Students | % Students |
| Nursery / Preschool | 10 | 9.0% |
| Kindergarten | 0 | 0.0% |
| Elementary School | 0 | 0.0% |
| Middle School | 35 | 31.5% |
| High School | 56 | 50.4% |
| College / Undergraduate | 10 | 9.0% |
| Graduate / Professional | 0 | 0.0% |
| Total | 111 | 100.0% |
School Enrollment by Age by Funding Source in McNeil
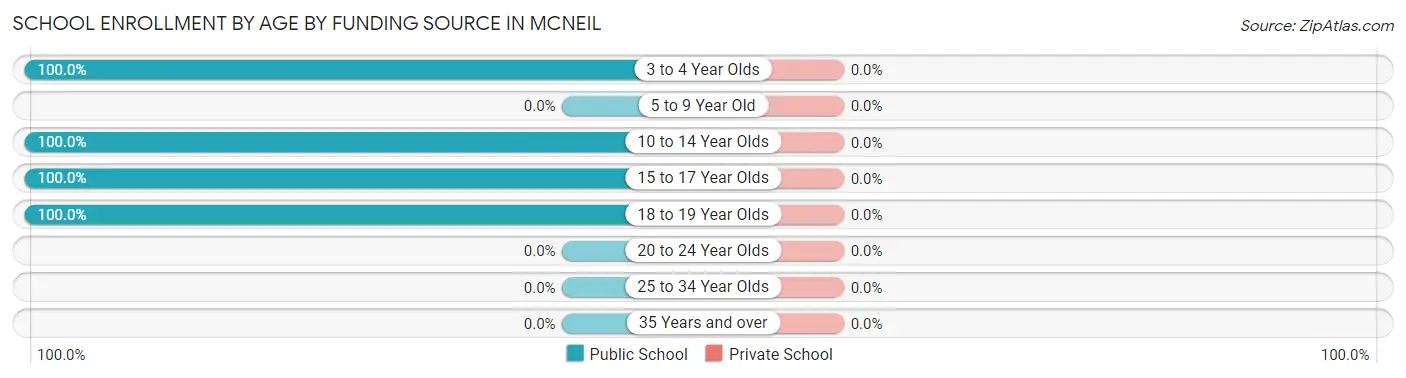
| Age Bracket | Public School | Private School |
| 3 to 4 Year Olds | 10 (100.0%) | 0 (0.0%) |
| 5 to 9 Year Old | 0 (0.0%) | 0 (0.0%) |
| 10 to 14 Year Olds | 50 (100.0%) | 0 (0.0%) |
| 15 to 17 Year Olds | 41 (100.0%) | 0 (0.0%) |
| 18 to 19 Year Olds | 10 (100.0%) | 0 (0.0%) |
| 20 to 24 Year Olds | 0 (0.0%) | 0 (0.0%) |
| 25 to 34 Year Olds | 0 (0.0%) | 0 (0.0%) |
| 35 Years and over | 0 (0.0%) | 0 (0.0%) |
| Total | 111 (100.0%) | 0 (0.0%) |
Educational Attainment by Field of Study in McNeil
Business (45 | 42.9%), arts & humanities (41 | 39.1%), physical & health sciences (11 | 10.5%), science & technology (5 | 4.8%), and education (3 | 2.9%) are the most common fields of study among 105 individuals in McNeil who have obtained a bachelor's degree or higher.
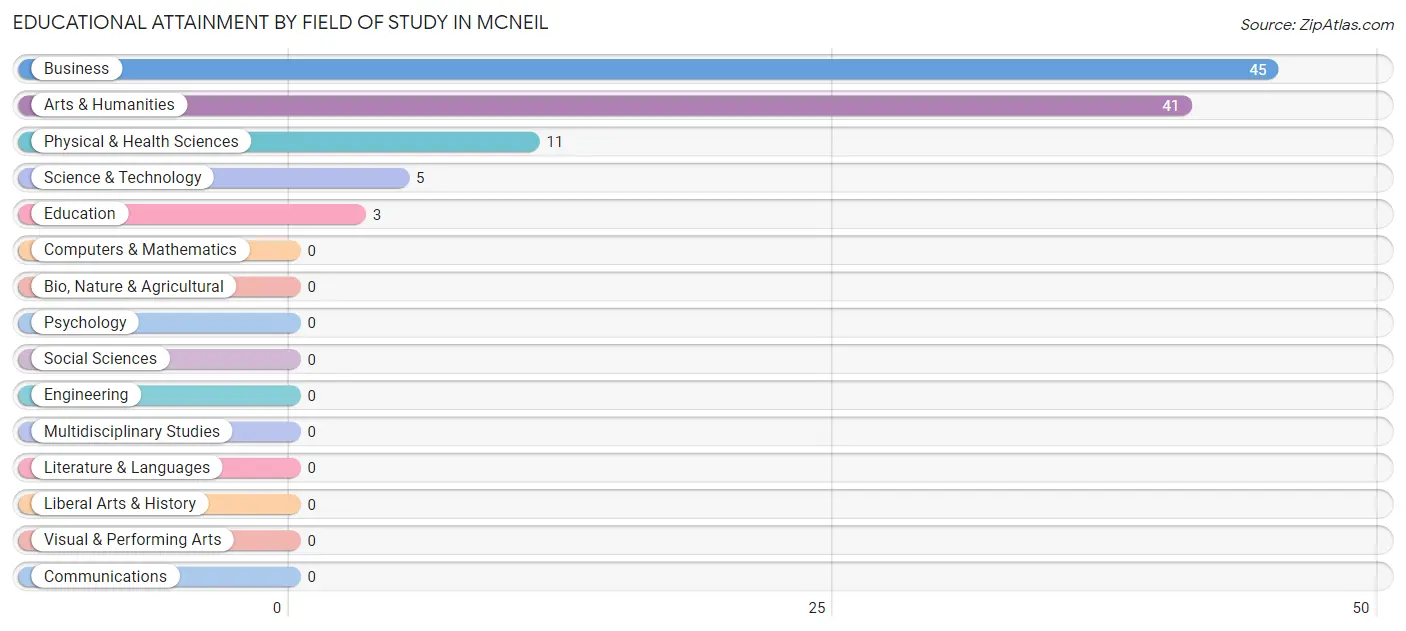
| Field of Study | # Graduates | % Graduates |
| Computers & Mathematics | 0 | 0.0% |
| Bio, Nature & Agricultural | 0 | 0.0% |
| Physical & Health Sciences | 11 | 10.5% |
| Psychology | 0 | 0.0% |
| Social Sciences | 0 | 0.0% |
| Engineering | 0 | 0.0% |
| Multidisciplinary Studies | 0 | 0.0% |
| Science & Technology | 5 | 4.8% |
| Business | 45 | 42.9% |
| Education | 3 | 2.9% |
| Literature & Languages | 0 | 0.0% |
| Liberal Arts & History | 0 | 0.0% |
| Visual & Performing Arts | 0 | 0.0% |
| Communications | 0 | 0.0% |
| Arts & Humanities | 41 | 39.1% |
| Total | 105 | 100.0% |
Transportation & Commute in McNeil
Vehicle Availability by Sex in McNeil
The most prevalent vehicle ownership categories in McNeil are males with 2 vehicles (84, accounting for 83.2%) and females with 2 vehicles (72, making up 55.6%).
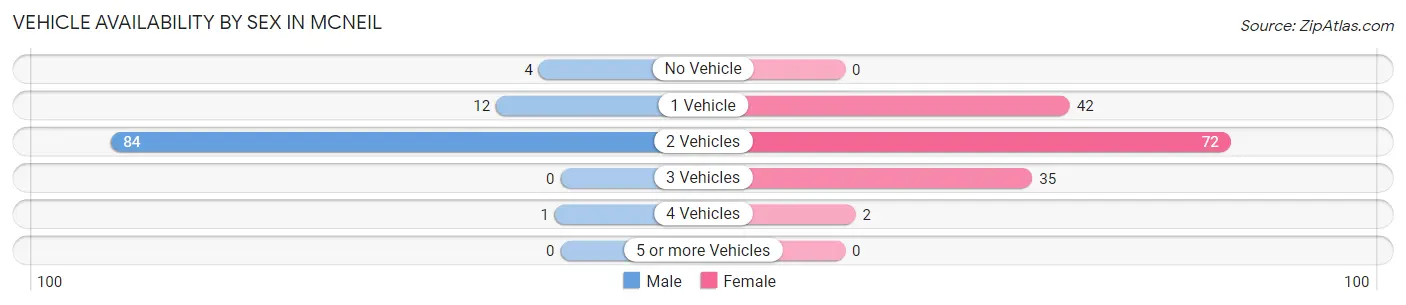
| Vehicles Available | Male | Female |
| No Vehicle | 4 (4.0%) | 0 (0.0%) |
| 1 Vehicle | 12 (11.9%) | 42 (27.8%) |
| 2 Vehicles | 84 (83.2%) | 72 (47.7%) |
| 3 Vehicles | 0 (0.0%) | 35 (23.2%) |
| 4 Vehicles | 1 (1.0%) | 2 (1.3%) |
| 5 or more Vehicles | 0 (0.0%) | 0 (0.0%) |
| Total | 101 (100.0%) | 151 (100.0%) |
Commute Time in McNeil
The most frequently occuring commute durations in McNeil are 15 to 19 minutes (82 commuters, 32.5%), 20 to 24 minutes (35 commuters, 13.9%), and 30 to 34 minutes (33 commuters, 13.1%).
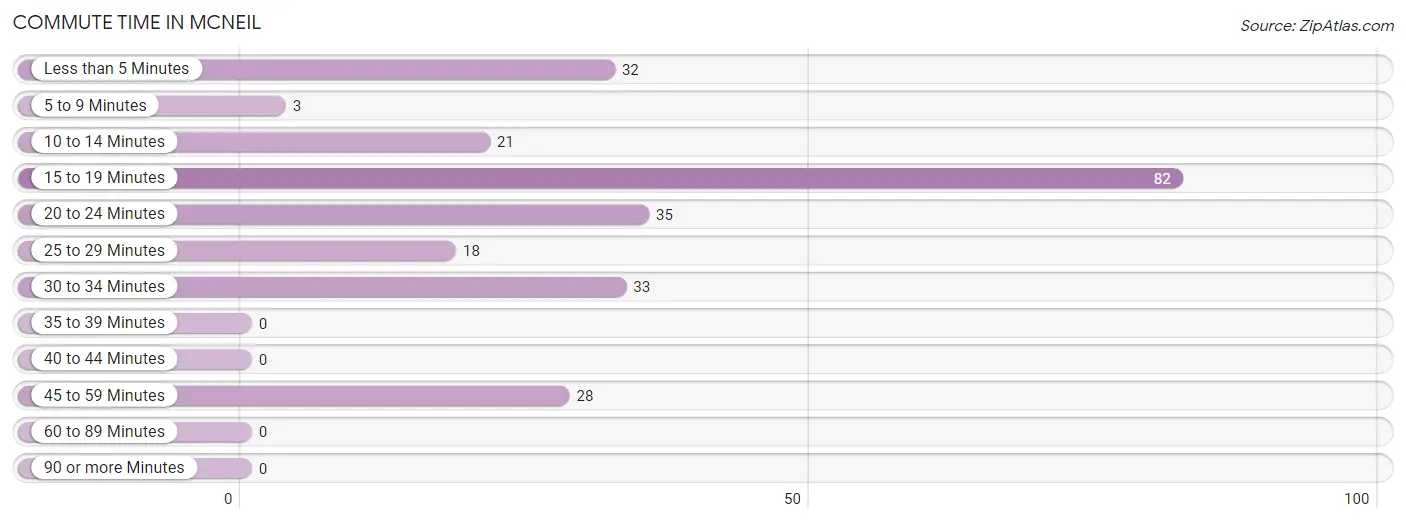
| Commute Time | # Commuters | % Commuters |
| Less than 5 Minutes | 32 | 12.7% |
| 5 to 9 Minutes | 3 | 1.2% |
| 10 to 14 Minutes | 21 | 8.3% |
| 15 to 19 Minutes | 82 | 32.5% |
| 20 to 24 Minutes | 35 | 13.9% |
| 25 to 29 Minutes | 18 | 7.1% |
| 30 to 34 Minutes | 33 | 13.1% |
| 35 to 39 Minutes | 0 | 0.0% |
| 40 to 44 Minutes | 0 | 0.0% |
| 45 to 59 Minutes | 28 | 11.1% |
| 60 to 89 Minutes | 0 | 0.0% |
| 90 or more Minutes | 0 | 0.0% |
Commute Time by Sex in McNeil
The most common commute times in McNeil are 30 to 34 minutes (33 commuters, 32.7%) for males and 15 to 19 minutes (67 commuters, 44.4%) for females.
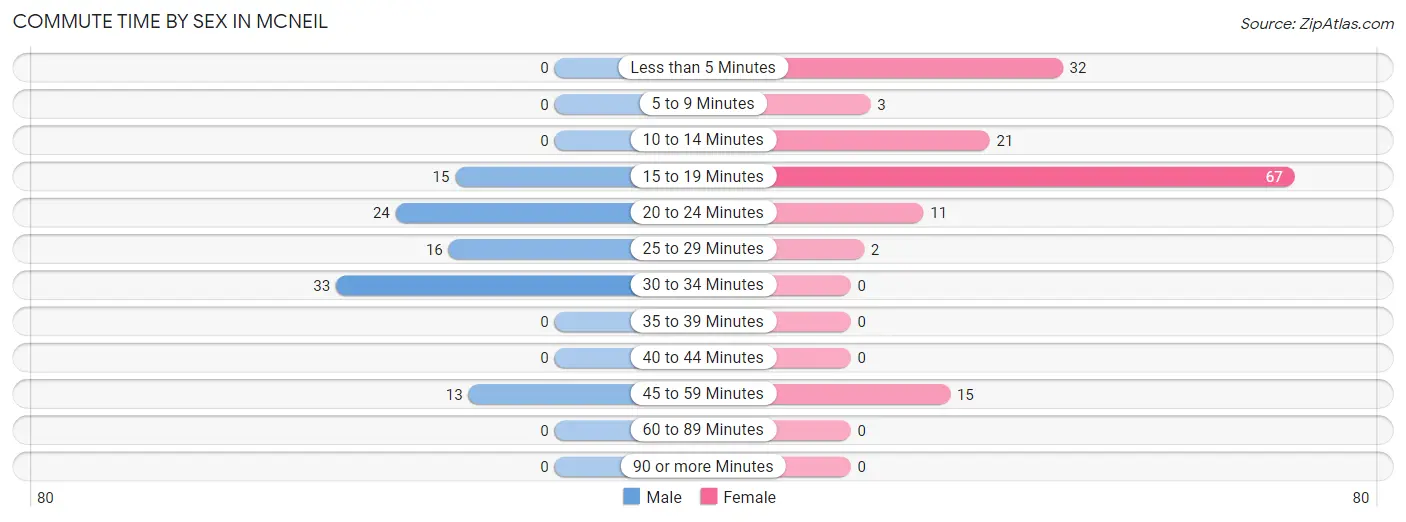
| Commute Time | Male | Female |
| Less than 5 Minutes | 0 (0.0%) | 32 (21.2%) |
| 5 to 9 Minutes | 0 (0.0%) | 3 (2.0%) |
| 10 to 14 Minutes | 0 (0.0%) | 21 (13.9%) |
| 15 to 19 Minutes | 15 (14.8%) | 67 (44.4%) |
| 20 to 24 Minutes | 24 (23.8%) | 11 (7.3%) |
| 25 to 29 Minutes | 16 (15.8%) | 2 (1.3%) |
| 30 to 34 Minutes | 33 (32.7%) | 0 (0.0%) |
| 35 to 39 Minutes | 0 (0.0%) | 0 (0.0%) |
| 40 to 44 Minutes | 0 (0.0%) | 0 (0.0%) |
| 45 to 59 Minutes | 13 (12.9%) | 15 (9.9%) |
| 60 to 89 Minutes | 0 (0.0%) | 0 (0.0%) |
| 90 or more Minutes | 0 (0.0%) | 0 (0.0%) |
Time of Departure to Work by Sex in McNeil
The most frequent times of departure to work in McNeil are 7:00 AM to 7:29 AM (33, 32.7%) for males and 7:30 AM to 7:59 AM (58, 38.4%) for females.
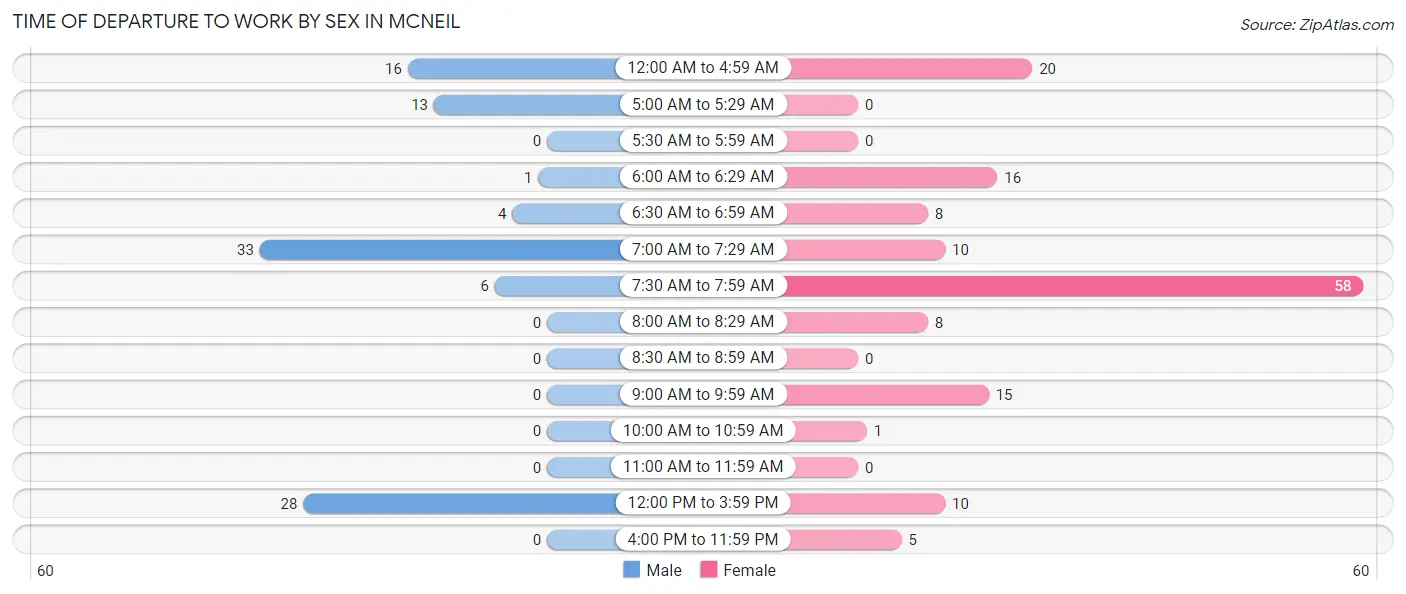
| Time of Departure | Male | Female |
| 12:00 AM to 4:59 AM | 16 (15.8%) | 20 (13.3%) |
| 5:00 AM to 5:29 AM | 13 (12.9%) | 0 (0.0%) |
| 5:30 AM to 5:59 AM | 0 (0.0%) | 0 (0.0%) |
| 6:00 AM to 6:29 AM | 1 (1.0%) | 16 (10.6%) |
| 6:30 AM to 6:59 AM | 4 (4.0%) | 8 (5.3%) |
| 7:00 AM to 7:29 AM | 33 (32.7%) | 10 (6.6%) |
| 7:30 AM to 7:59 AM | 6 (5.9%) | 58 (38.4%) |
| 8:00 AM to 8:29 AM | 0 (0.0%) | 8 (5.3%) |
| 8:30 AM to 8:59 AM | 0 (0.0%) | 0 (0.0%) |
| 9:00 AM to 9:59 AM | 0 (0.0%) | 15 (9.9%) |
| 10:00 AM to 10:59 AM | 0 (0.0%) | 1 (0.7%) |
| 11:00 AM to 11:59 AM | 0 (0.0%) | 0 (0.0%) |
| 12:00 PM to 3:59 PM | 28 (27.7%) | 10 (6.6%) |
| 4:00 PM to 11:59 PM | 0 (0.0%) | 5 (3.3%) |
| Total | 101 (100.0%) | 151 (100.0%) |
Housing Occupancy in McNeil
Occupancy by Ownership in McNeil
Of the total 210 dwellings in McNeil, owner-occupied units account for 151 (71.9%), while renter-occupied units make up 59 (28.1%).
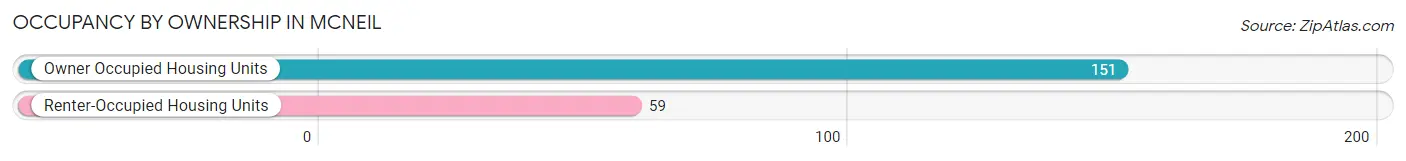
| Occupancy | # Housing Units | % Housing Units |
| Owner Occupied Housing Units | 151 | 71.9% |
| Renter-Occupied Housing Units | 59 | 28.1% |
| Total Occupied Housing Units | 210 | 100.0% |
Occupancy by Household Size in McNeil
| Household Size | # Housing Units | % Housing Units |
| 1-Person Household | 86 | 40.9% |
| 2-Person Household | 60 | 28.6% |
| 3-Person Household | 20 | 9.5% |
| 4+ Person Household | 44 | 20.9% |
| Total Housing Units | 210 | 100.0% |
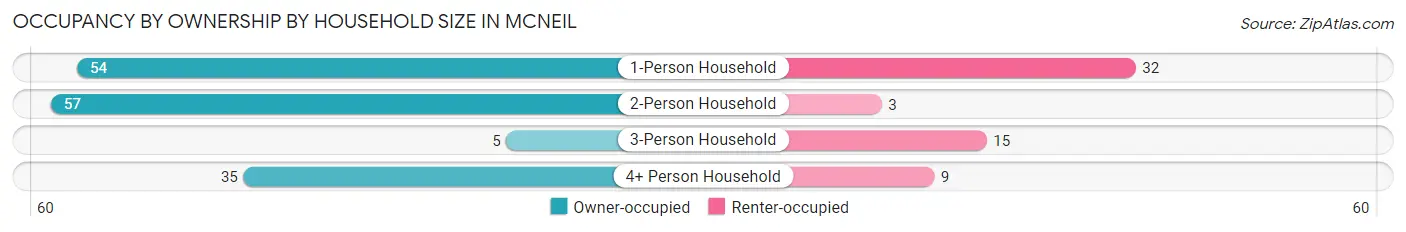
Occupancy by Ownership by Household Size in McNeil
| Household Size | Owner-occupied | Renter-occupied |
| 1-Person Household | 54 (62.8%) | 32 (37.2%) |
| 2-Person Household | 57 (95.0%) | 3 (5.0%) |
| 3-Person Household | 5 (25.0%) | 15 (75.0%) |
| 4+ Person Household | 35 (79.5%) | 9 (20.4%) |
| Total Housing Units | 151 (71.9%) | 59 (28.1%) |
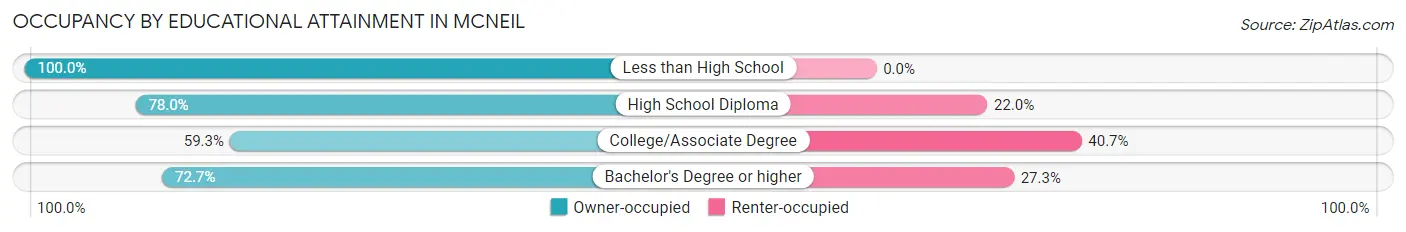
Occupancy by Educational Attainment in McNeil
| Household Size | Owner-occupied | Renter-occupied |
| Less than High School | 5 (100.0%) | 0 (0.0%) |
| High School Diploma | 71 (78.0%) | 20 (22.0%) |
| College/Associate Degree | 35 (59.3%) | 24 (40.7%) |
| Bachelor's Degree or higher | 40 (72.7%) | 15 (27.3%) |
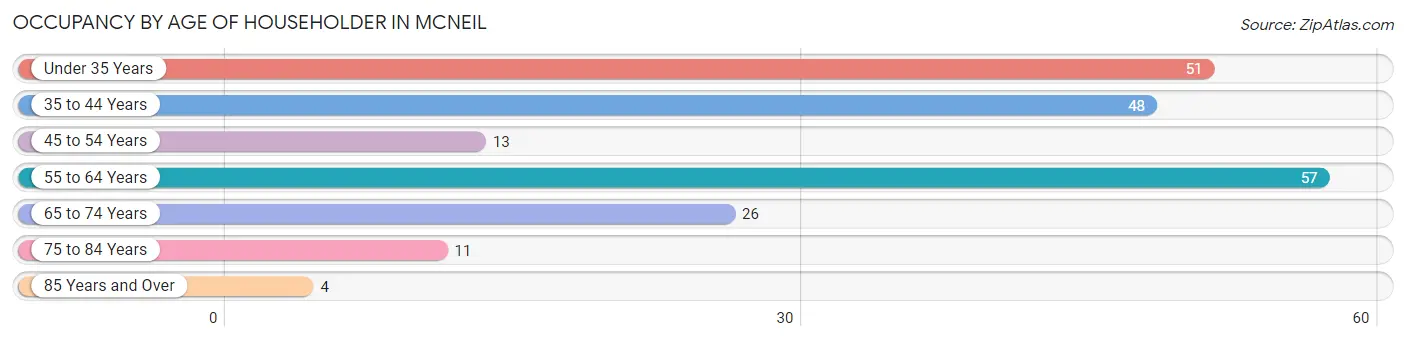
Occupancy by Age of Householder in McNeil
| Age Bracket | # Households | % Households |
| Under 35 Years | 51 | 24.3% |
| 35 to 44 Years | 48 | 22.9% |
| 45 to 54 Years | 13 | 6.2% |
| 55 to 64 Years | 57 | 27.1% |
| 65 to 74 Years | 26 | 12.4% |
| 75 to 84 Years | 11 | 5.2% |
| 85 Years and Over | 4 | 1.9% |
| Total | 210 | 100.0% |
Housing Finances in McNeil
Median Income by Occupancy in McNeil
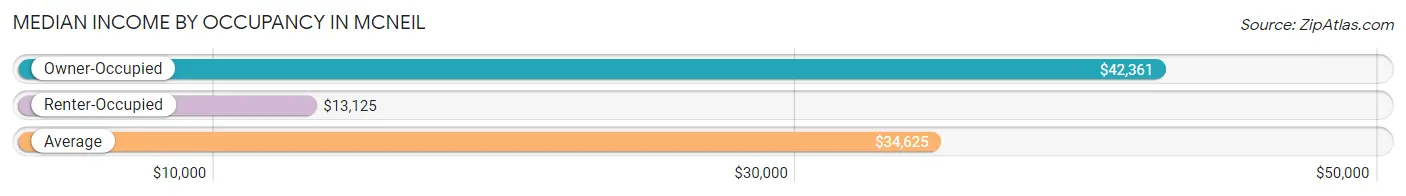
| Occupancy Type | # Households | Median Income |
| Owner-Occupied | 151 (71.9%) | $42,361 |
| Renter-Occupied | 59 (28.1%) | $13,125 |
| Average | 210 (100.0%) | $34,625 |
Occupancy by Householder Income Bracket in McNeil
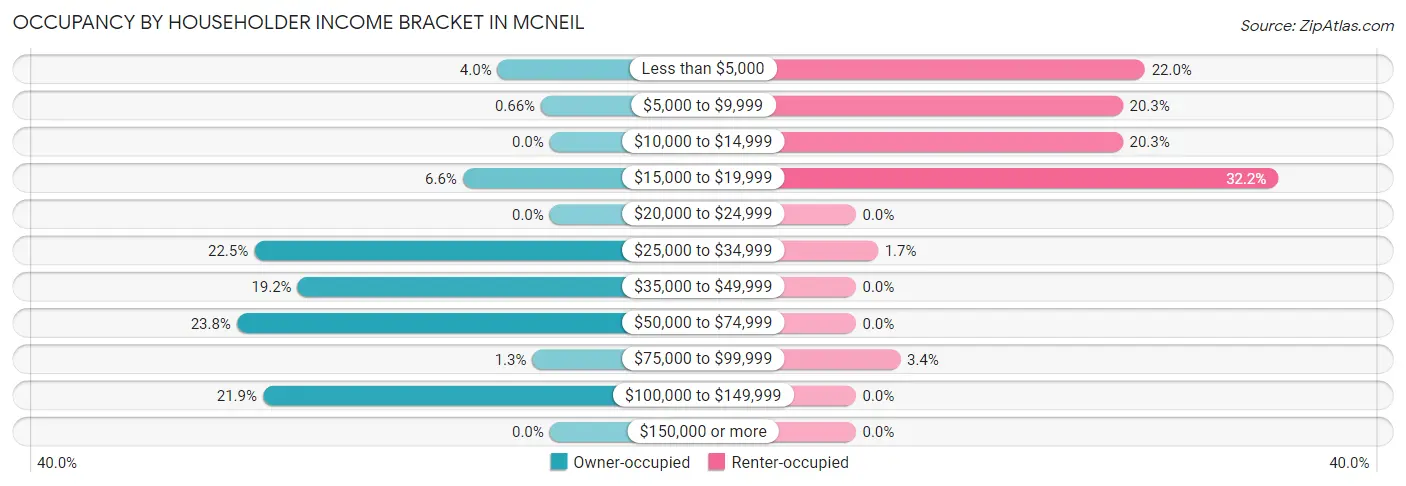
| Income Bracket | Owner-occupied | Renter-occupied |
| Less than $5,000 | 6 (4.0%) | 13 (22.0%) |
| $5,000 to $9,999 | 1 (0.7%) | 12 (20.3%) |
| $10,000 to $14,999 | 0 (0.0%) | 12 (20.3%) |
| $15,000 to $19,999 | 10 (6.6%) | 19 (32.2%) |
| $20,000 to $24,999 | 0 (0.0%) | 0 (0.0%) |
| $25,000 to $34,999 | 34 (22.5%) | 1 (1.7%) |
| $35,000 to $49,999 | 29 (19.2%) | 0 (0.0%) |
| $50,000 to $74,999 | 36 (23.8%) | 0 (0.0%) |
| $75,000 to $99,999 | 2 (1.3%) | 2 (3.4%) |
| $100,000 to $149,999 | 33 (21.8%) | 0 (0.0%) |
| $150,000 or more | 0 (0.0%) | 0 (0.0%) |
| Total | 151 (100.0%) | 59 (100.0%) |
Monthly Housing Cost Tiers in McNeil
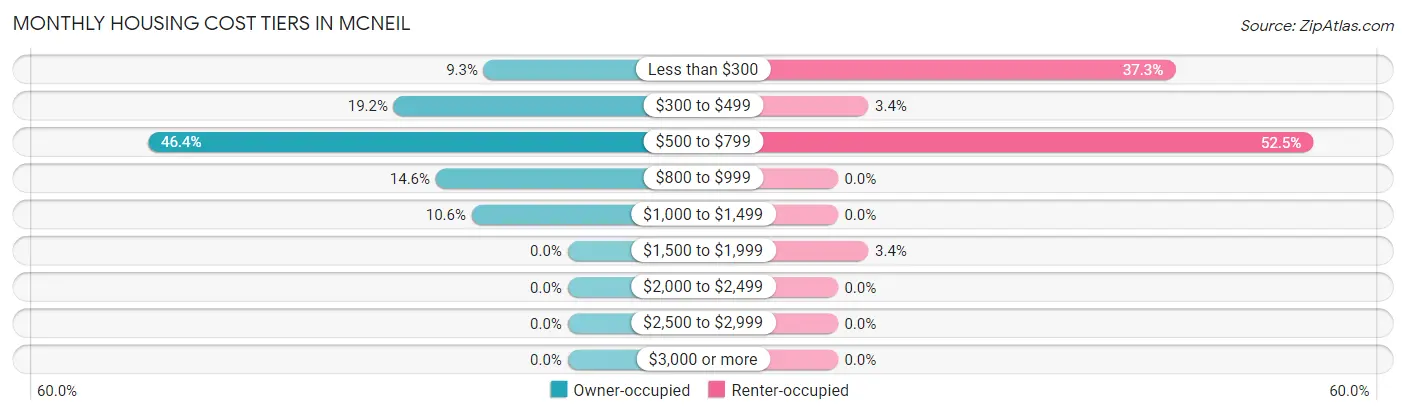
| Monthly Cost | Owner-occupied | Renter-occupied |
| Less than $300 | 14 (9.3%) | 22 (37.3%) |
| $300 to $499 | 29 (19.2%) | 2 (3.4%) |
| $500 to $799 | 70 (46.4%) | 31 (52.5%) |
| $800 to $999 | 22 (14.6%) | 0 (0.0%) |
| $1,000 to $1,499 | 16 (10.6%) | 0 (0.0%) |
| $1,500 to $1,999 | 0 (0.0%) | 2 (3.4%) |
| $2,000 to $2,499 | 0 (0.0%) | 0 (0.0%) |
| $2,500 to $2,999 | 0 (0.0%) | 0 (0.0%) |
| $3,000 or more | 0 (0.0%) | 0 (0.0%) |
| Total | 151 (100.0%) | 59 (100.0%) |
Physical Housing Characteristics in McNeil
Housing Structures in McNeil
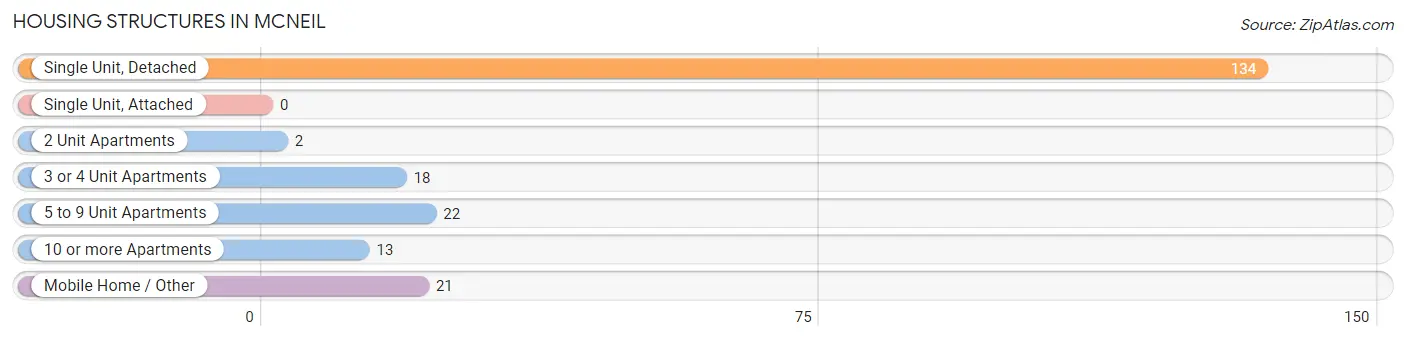
| Structure Type | # Housing Units | % Housing Units |
| Single Unit, Detached | 134 | 63.8% |
| Single Unit, Attached | 0 | 0.0% |
| 2 Unit Apartments | 2 | 0.9% |
| 3 or 4 Unit Apartments | 18 | 8.6% |
| 5 to 9 Unit Apartments | 22 | 10.5% |
| 10 or more Apartments | 13 | 6.2% |
| Mobile Home / Other | 21 | 10.0% |
| Total | 210 | 100.0% |
Housing Structures by Occupancy in McNeil
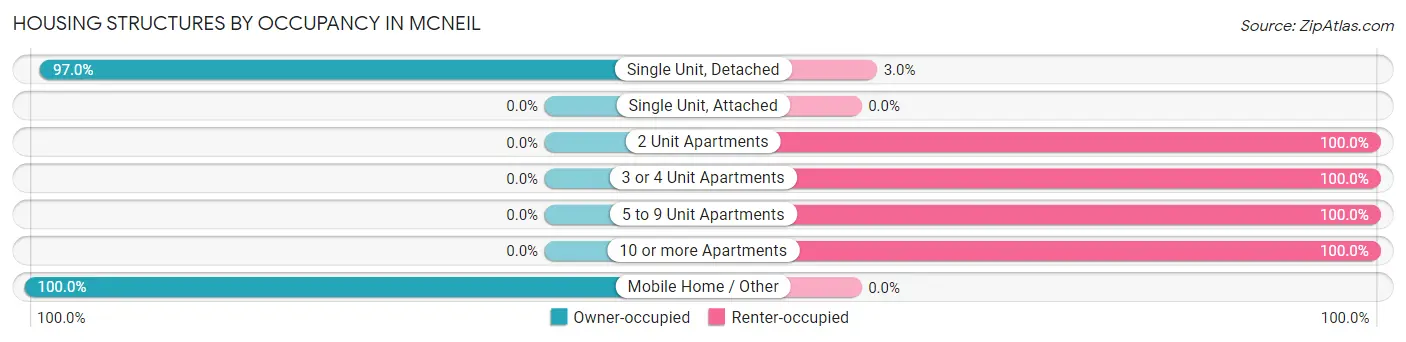
| Structure Type | Owner-occupied | Renter-occupied |
| Single Unit, Detached | 130 (97.0%) | 4 (3.0%) |
| Single Unit, Attached | 0 (0.0%) | 0 (0.0%) |
| 2 Unit Apartments | 0 (0.0%) | 2 (100.0%) |
| 3 or 4 Unit Apartments | 0 (0.0%) | 18 (100.0%) |
| 5 to 9 Unit Apartments | 0 (0.0%) | 22 (100.0%) |
| 10 or more Apartments | 0 (0.0%) | 13 (100.0%) |
| Mobile Home / Other | 21 (100.0%) | 0 (0.0%) |
| Total | 151 (71.9%) | 59 (28.1%) |
Housing Structures by Number of Rooms in McNeil
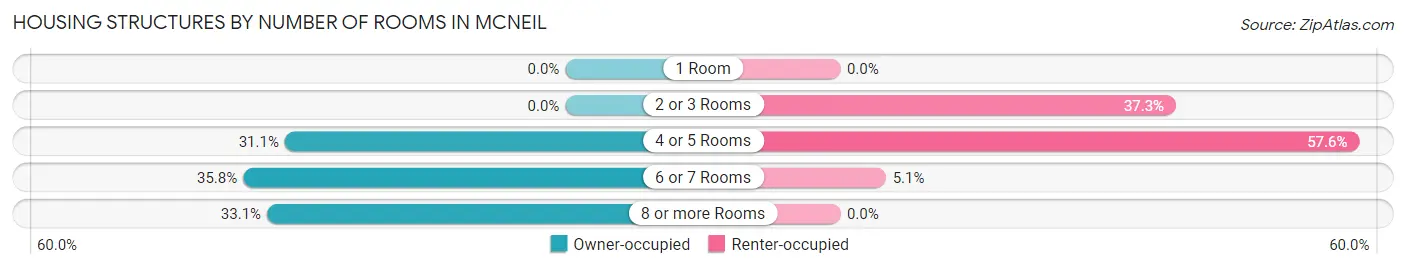
| Number of Rooms | Owner-occupied | Renter-occupied |
| 1 Room | 0 (0.0%) | 0 (0.0%) |
| 2 or 3 Rooms | 0 (0.0%) | 22 (37.3%) |
| 4 or 5 Rooms | 47 (31.1%) | 34 (57.6%) |
| 6 or 7 Rooms | 54 (35.8%) | 3 (5.1%) |
| 8 or more Rooms | 50 (33.1%) | 0 (0.0%) |
| Total | 151 (100.0%) | 59 (100.0%) |
Housing Structure by Heating Type in McNeil
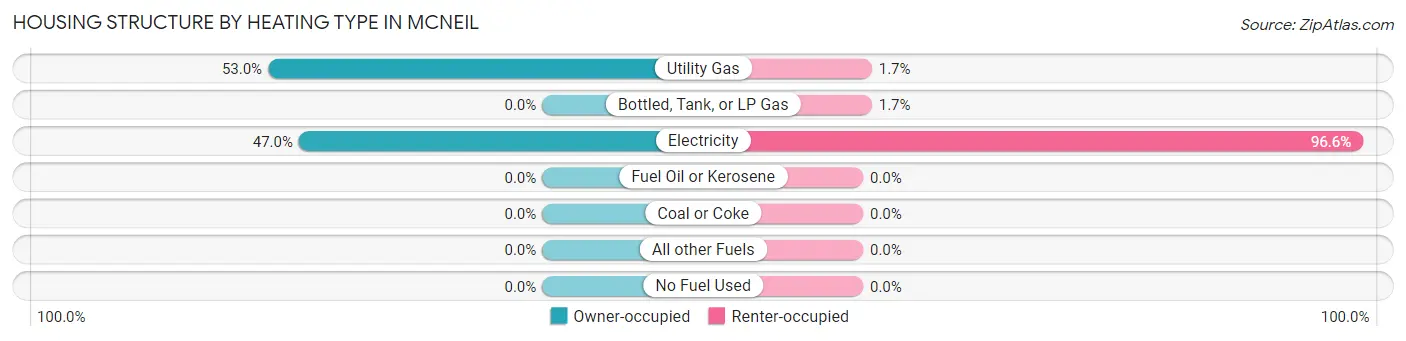
| Heating Type | Owner-occupied | Renter-occupied |
| Utility Gas | 80 (53.0%) | 1 (1.7%) |
| Bottled, Tank, or LP Gas | 0 (0.0%) | 1 (1.7%) |
| Electricity | 71 (47.0%) | 57 (96.6%) |
| Fuel Oil or Kerosene | 0 (0.0%) | 0 (0.0%) |
| Coal or Coke | 0 (0.0%) | 0 (0.0%) |
| All other Fuels | 0 (0.0%) | 0 (0.0%) |
| No Fuel Used | 0 (0.0%) | 0 (0.0%) |
| Total | 151 (100.0%) | 59 (100.0%) |
Household Vehicle Usage in McNeil
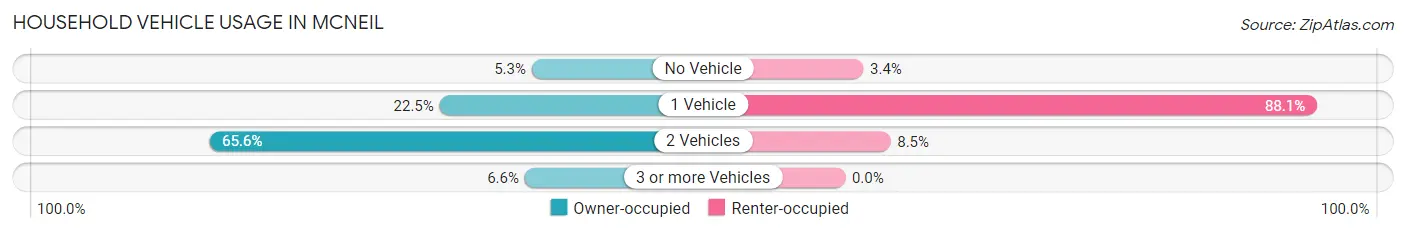
| Vehicles per Household | Owner-occupied | Renter-occupied |
| No Vehicle | 8 (5.3%) | 2 (3.4%) |
| 1 Vehicle | 34 (22.5%) | 52 (88.1%) |
| 2 Vehicles | 99 (65.6%) | 5 (8.5%) |
| 3 or more Vehicles | 10 (6.6%) | 0 (0.0%) |
| Total | 151 (100.0%) | 59 (100.0%) |
Real Estate & Mortgages in McNeil
Real Estate and Mortgage Overview in McNeil
| Characteristic | Without Mortgage | With Mortgage |
| Housing Units | 57 | 94 |
| Median Property Value | $52,500 | $83,200 |
| Median Household Income | $34,792 | $0 |
| Monthly Housing Costs | $335 | $0 |
| Real Estate Taxes | $335 | $16 |
Property Value by Mortgage Status in McNeil
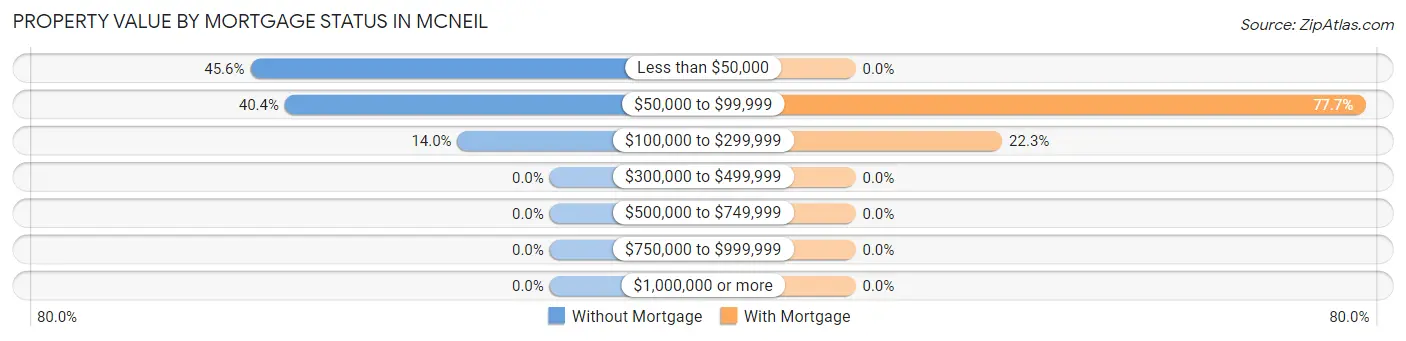
| Property Value | Without Mortgage | With Mortgage |
| Less than $50,000 | 26 (45.6%) | 0 (0.0%) |
| $50,000 to $99,999 | 23 (40.4%) | 73 (77.7%) |
| $100,000 to $299,999 | 8 (14.0%) | 21 (22.3%) |
| $300,000 to $499,999 | 0 (0.0%) | 0 (0.0%) |
| $500,000 to $749,999 | 0 (0.0%) | 0 (0.0%) |
| $750,000 to $999,999 | 0 (0.0%) | 0 (0.0%) |
| $1,000,000 or more | 0 (0.0%) | 0 (0.0%) |
| Total | 57 (100.0%) | 94 (100.0%) |
Household Income by Mortgage Status in McNeil
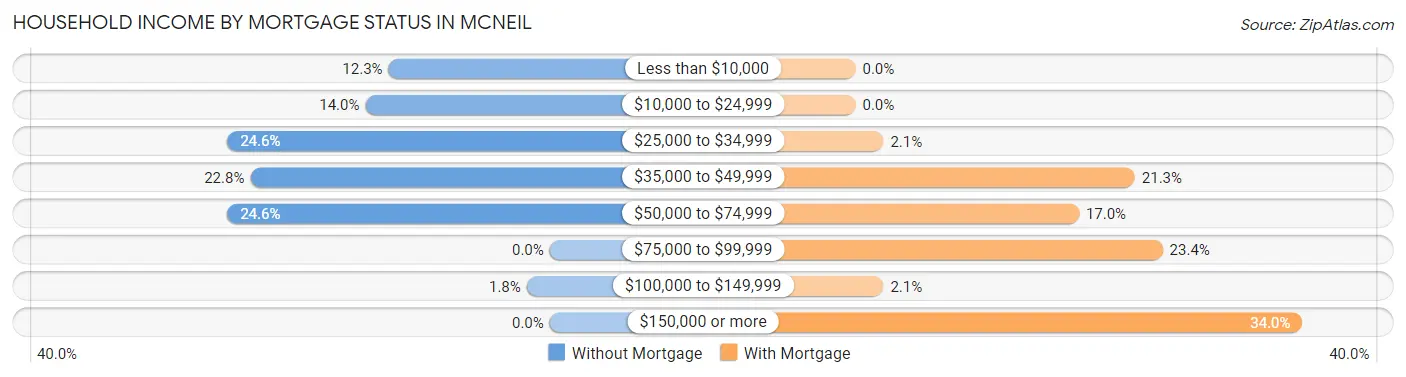
| Household Income | Without Mortgage | With Mortgage |
| Less than $10,000 | 7 (12.3%) | 0 (0.0%) |
| $10,000 to $24,999 | 8 (14.0%) | 0 (0.0%) |
| $25,000 to $34,999 | 14 (24.6%) | 2 (2.1%) |
| $35,000 to $49,999 | 13 (22.8%) | 20 (21.3%) |
| $50,000 to $74,999 | 14 (24.6%) | 16 (17.0%) |
| $75,000 to $99,999 | 0 (0.0%) | 22 (23.4%) |
| $100,000 to $149,999 | 1 (1.8%) | 2 (2.1%) |
| $150,000 or more | 0 (0.0%) | 32 (34.0%) |
| Total | 57 (100.0%) | 94 (100.0%) |
Property Value to Household Income Ratio in McNeil
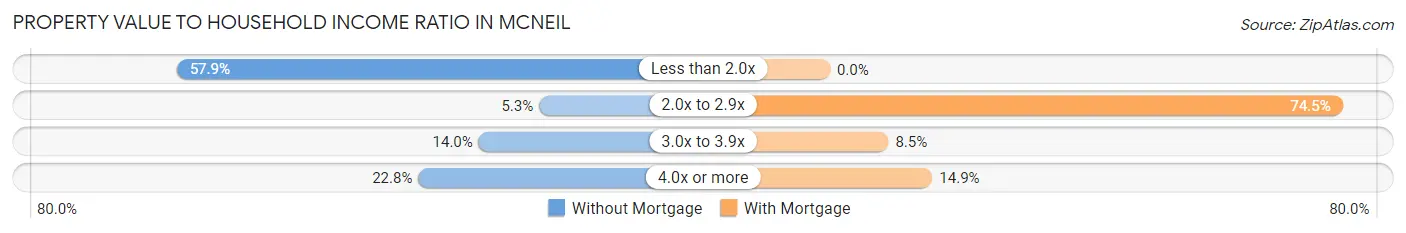
| Value-to-Income Ratio | Without Mortgage | With Mortgage |
| Less than 2.0x | 33 (57.9%) | 0 (0.0%) |
| 2.0x to 2.9x | 3 (5.3%) | 70 (74.5%) |
| 3.0x to 3.9x | 8 (14.0%) | 8 (8.5%) |
| 4.0x or more | 13 (22.8%) | 14 (14.9%) |
| Total | 57 (100.0%) | 94 (100.0%) |
Real Estate Taxes by Mortgage Status in McNeil
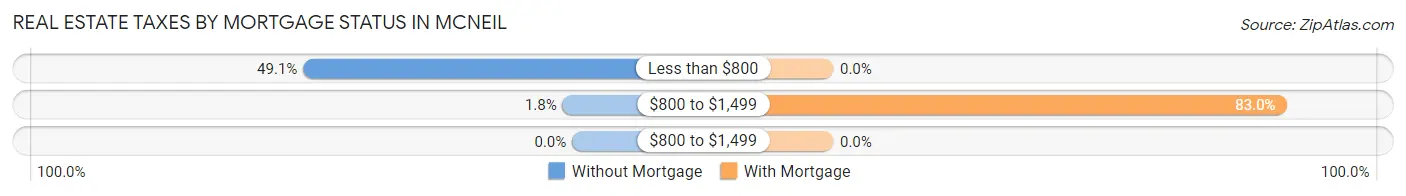
| Property Taxes | Without Mortgage | With Mortgage |
| Less than $800 | 28 (49.1%) | 0 (0.0%) |
| $800 to $1,499 | 1 (1.8%) | 78 (83.0%) |
| $800 to $1,499 | 0 (0.0%) | 0 (0.0%) |
| Total | 57 (100.0%) | 94 (100.0%) |
Health & Disability in McNeil
Health Insurance Coverage by Age in McNeil
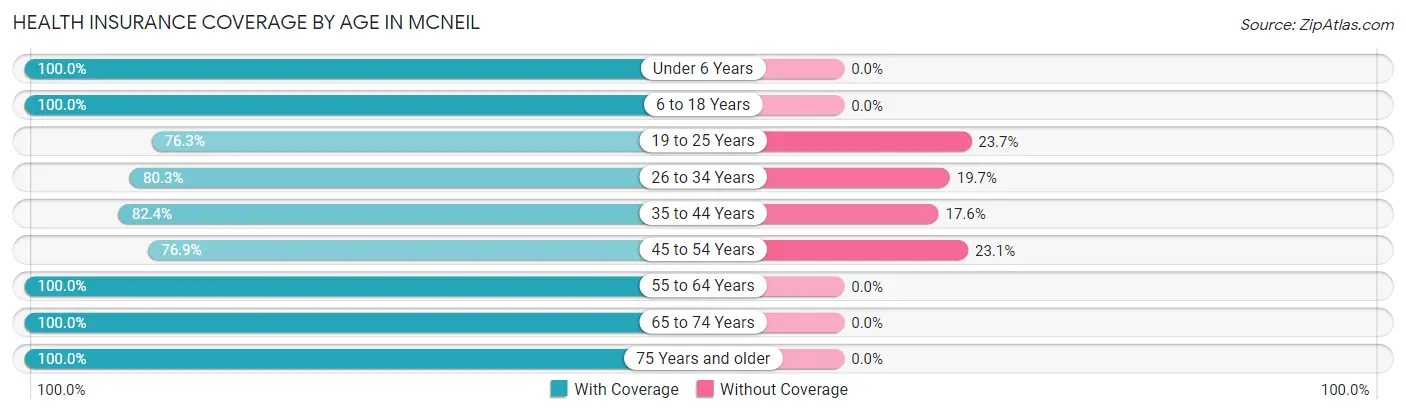
| Age Bracket | With Coverage | Without Coverage |
| Under 6 Years | 38 (100.0%) | 0 (0.0%) |
| 6 to 18 Years | 101 (100.0%) | 0 (0.0%) |
| 19 to 25 Years | 29 (76.3%) | 9 (23.7%) |
| 26 to 34 Years | 49 (80.3%) | 12 (19.7%) |
| 35 to 44 Years | 75 (82.4%) | 16 (17.6%) |
| 45 to 54 Years | 10 (76.9%) | 3 (23.1%) |
| 55 to 64 Years | 102 (100.0%) | 0 (0.0%) |
| 65 to 74 Years | 29 (100.0%) | 0 (0.0%) |
| 75 Years and older | 16 (100.0%) | 0 (0.0%) |
| Total | 449 (91.8%) | 40 (8.2%) |
Health Insurance Coverage by Citizenship Status in McNeil
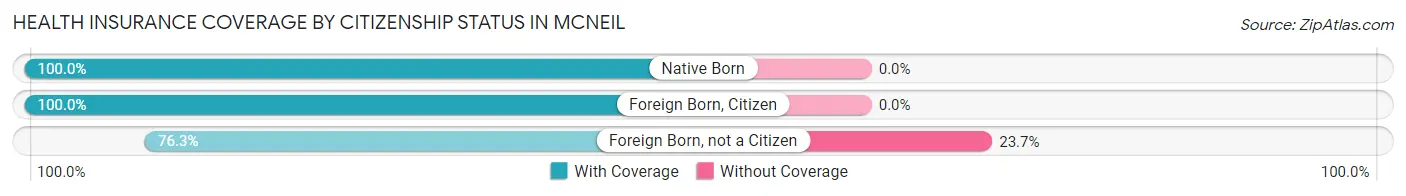
| Citizenship Status | With Coverage | Without Coverage |
| Native Born | 38 (100.0%) | 0 (0.0%) |
| Foreign Born, Citizen | 101 (100.0%) | 0 (0.0%) |
| Foreign Born, not a Citizen | 29 (76.3%) | 9 (23.7%) |
Health Insurance Coverage by Household Income in McNeil
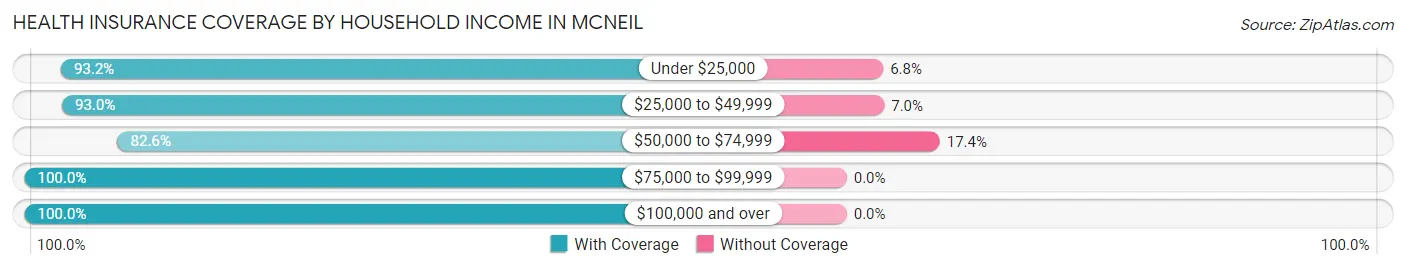
| Household Income | With Coverage | Without Coverage |
| Under $25,000 | 123 (93.2%) | 9 (6.8%) |
| $25,000 to $49,999 | 159 (93.0%) | 12 (7.0%) |
| $50,000 to $74,999 | 90 (82.6%) | 19 (17.4%) |
| $75,000 to $99,999 | 10 (100.0%) | 0 (0.0%) |
| $100,000 and over | 67 (100.0%) | 0 (0.0%) |
Public vs Private Health Insurance Coverage by Age in McNeil
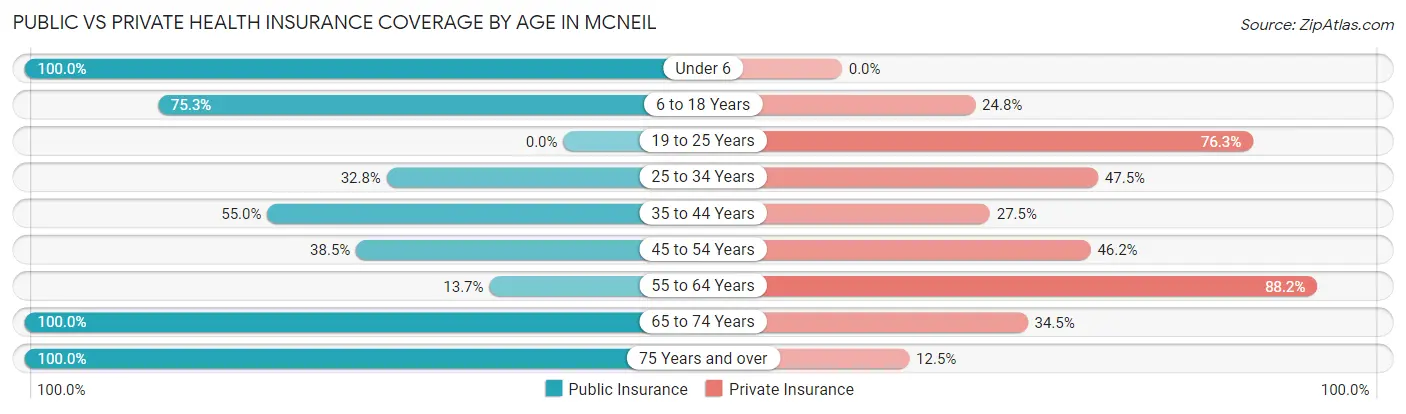
| Age Bracket | Public Insurance | Private Insurance |
| Under 6 | 38 (100.0%) | 0 (0.0%) |
| 6 to 18 Years | 76 (75.2%) | 25 (24.7%) |
| 19 to 25 Years | 0 (0.0%) | 29 (76.3%) |
| 25 to 34 Years | 20 (32.8%) | 29 (47.5%) |
| 35 to 44 Years | 50 (54.9%) | 25 (27.5%) |
| 45 to 54 Years | 5 (38.5%) | 6 (46.2%) |
| 55 to 64 Years | 14 (13.7%) | 90 (88.2%) |
| 65 to 74 Years | 29 (100.0%) | 10 (34.5%) |
| 75 Years and over | 16 (100.0%) | 2 (12.5%) |
| Total | 248 (50.7%) | 216 (44.2%) |
Disability Status by Sex by Age in McNeil
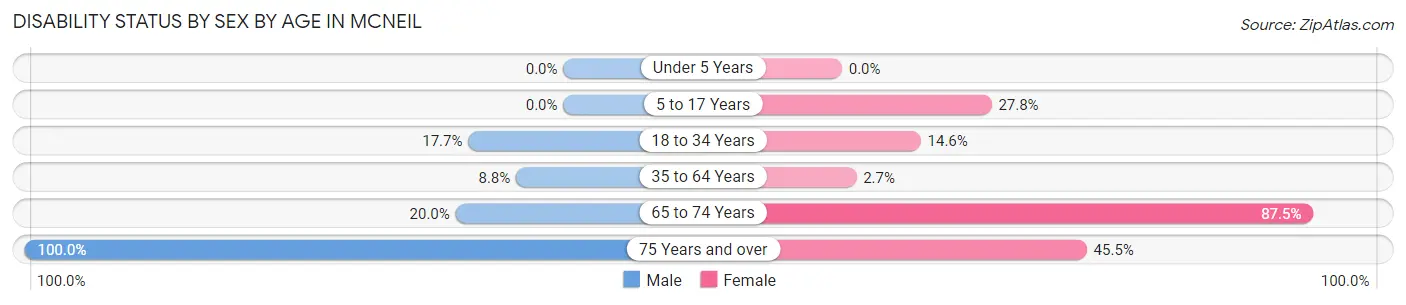
| Age Bracket | Male | Female |
| Under 5 Years | 0 (0.0%) | 0 (0.0%) |
| 5 to 17 Years | 0 (0.0%) | 5 (27.8%) |
| 18 to 34 Years | 12 (17.6%) | 6 (14.6%) |
| 35 to 64 Years | 5 (8.8%) | 4 (2.7%) |
| 65 to 74 Years | 1 (20.0%) | 21 (87.5%) |
| 75 Years and over | 5 (100.0%) | 5 (45.5%) |
Disability Class by Sex by Age in McNeil
Disability Class: Hearing Difficulty
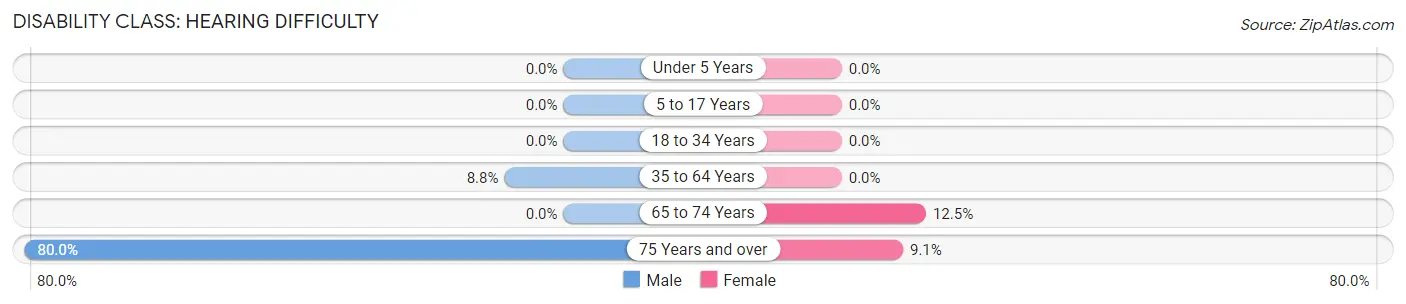
| Age Bracket | Male | Female |
| Under 5 Years | 0 (0.0%) | 0 (0.0%) |
| 5 to 17 Years | 0 (0.0%) | 0 (0.0%) |
| 18 to 34 Years | 0 (0.0%) | 0 (0.0%) |
| 35 to 64 Years | 5 (8.8%) | 0 (0.0%) |
| 65 to 74 Years | 0 (0.0%) | 3 (12.5%) |
| 75 Years and over | 4 (80.0%) | 1 (9.1%) |
Disability Class: Vision Difficulty
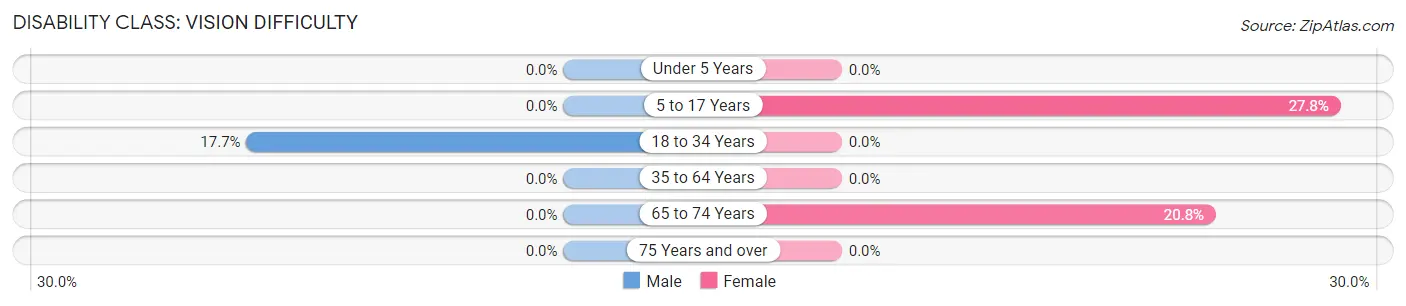
| Age Bracket | Male | Female |
| Under 5 Years | 0 (0.0%) | 0 (0.0%) |
| 5 to 17 Years | 0 (0.0%) | 5 (27.8%) |
| 18 to 34 Years | 12 (17.6%) | 0 (0.0%) |
| 35 to 64 Years | 0 (0.0%) | 0 (0.0%) |
| 65 to 74 Years | 0 (0.0%) | 5 (20.8%) |
| 75 Years and over | 0 (0.0%) | 0 (0.0%) |
Disability Class: Cognitive Difficulty
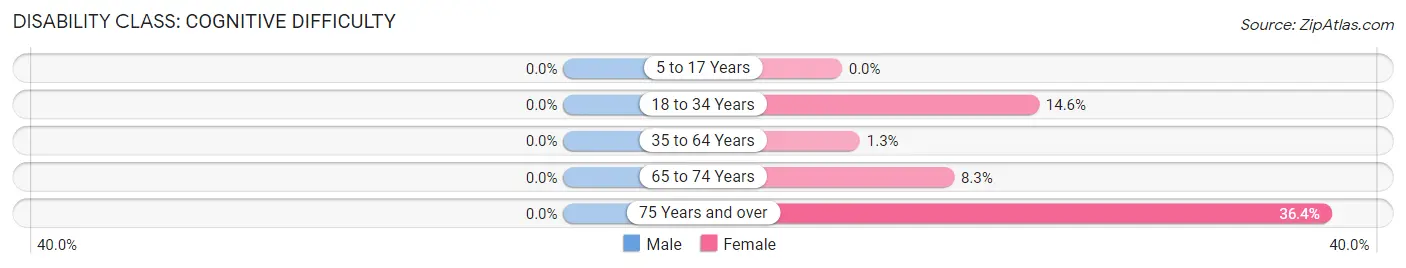
| Age Bracket | Male | Female |
| 5 to 17 Years | 0 (0.0%) | 0 (0.0%) |
| 18 to 34 Years | 0 (0.0%) | 6 (14.6%) |
| 35 to 64 Years | 0 (0.0%) | 2 (1.3%) |
| 65 to 74 Years | 0 (0.0%) | 2 (8.3%) |
| 75 Years and over | 0 (0.0%) | 4 (36.4%) |
Disability Class: Ambulatory Difficulty
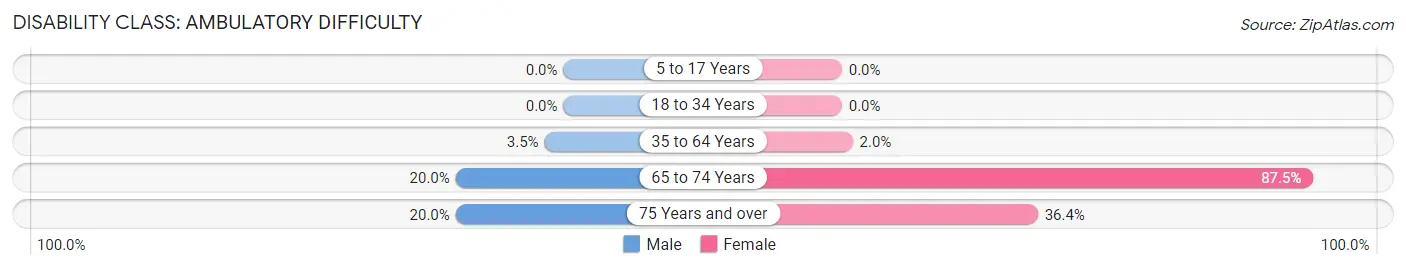
| Age Bracket | Male | Female |
| 5 to 17 Years | 0 (0.0%) | 0 (0.0%) |
| 18 to 34 Years | 0 (0.0%) | 0 (0.0%) |
| 35 to 64 Years | 2 (3.5%) | 3 (2.0%) |
| 65 to 74 Years | 1 (20.0%) | 21 (87.5%) |
| 75 Years and over | 1 (20.0%) | 4 (36.4%) |
Disability Class: Self-Care Difficulty
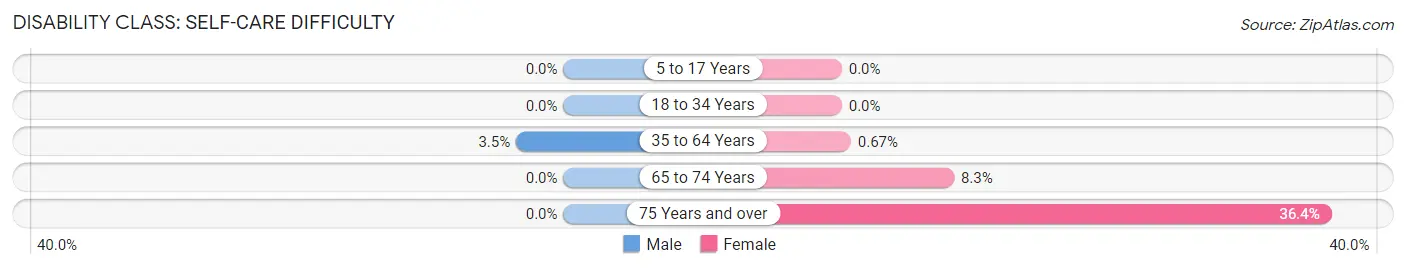
| Age Bracket | Male | Female |
| 5 to 17 Years | 0 (0.0%) | 0 (0.0%) |
| 18 to 34 Years | 0 (0.0%) | 0 (0.0%) |
| 35 to 64 Years | 2 (3.5%) | 1 (0.7%) |
| 65 to 74 Years | 0 (0.0%) | 2 (8.3%) |
| 75 Years and over | 0 (0.0%) | 4 (36.4%) |
Technology Access in McNeil
Computing Device Access in McNeil
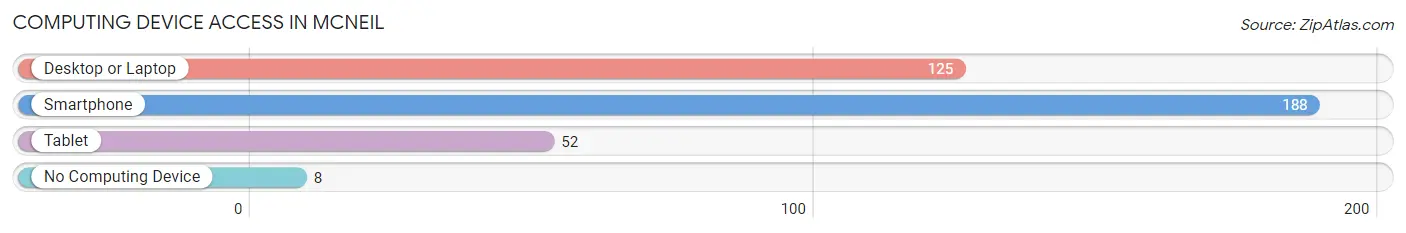
| Device Type | # Households | % Households |
| Desktop or Laptop | 125 | 59.5% |
| Smartphone | 188 | 89.5% |
| Tablet | 52 | 24.8% |
| No Computing Device | 8 | 3.8% |
| Total | 210 | 100.0% |
Internet Access in McNeil
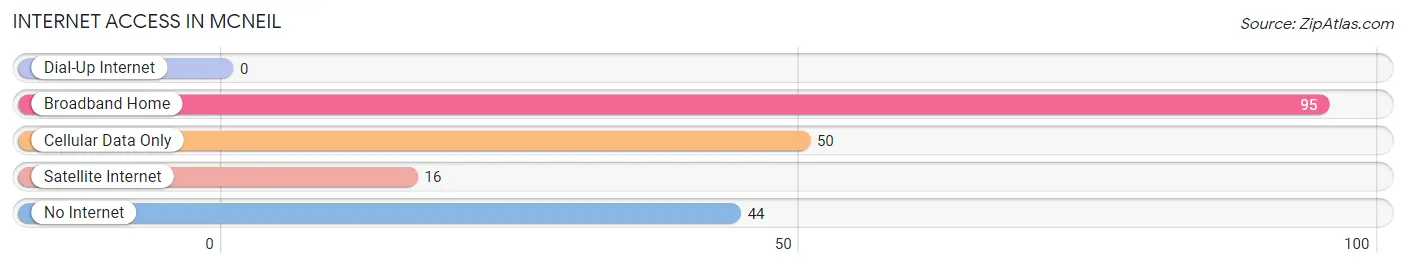
| Internet Type | # Households | % Households |
| Dial-Up Internet | 0 | 0.0% |
| Broadband Home | 95 | 45.2% |
| Cellular Data Only | 50 | 23.8% |
| Satellite Internet | 16 | 7.6% |
| No Internet | 44 | 20.9% |
| Total | 210 | 100.0% |
McNeil Summary
Mcneil is a small town located in Arkansas, United States. It is situated in the southwestern part of the state, in the Ouachita Mountains. The town has a population of approximately 500 people and is part of the Little Rock-North Little Rock-Conway Metropolitan Statistical Area.
History
Mcneil was founded in 1883 by a group of settlers from the nearby town of Hot Springs. The town was named after a local settler, William McNeil. The town was originally a farming community, but it soon became a popular tourist destination due to its proximity to Hot Springs. In the early 1900s, the town was home to a number of resorts and hotels, as well as a number of businesses.
In the 1920s, the town began to decline as the popularity of Hot Springs began to wane. The Great Depression also had a negative impact on the town, and by the 1940s, the population had dropped to just over 200 people. The town was able to survive, however, and by the 1950s, the population had grown to over 500 people.
Geography
Mcneil is located in the Ouachita Mountains of Arkansas. The town is situated in the southwestern part of the state, approximately 30 miles from Hot Springs. The town is located at an elevation of 1,000 feet above sea level. The town is surrounded by rolling hills and forests, and is home to a number of creeks and streams.
Economy
Mcneil is a small, rural town, and the economy is largely based on agriculture. The town is home to a number of farms, and the main crops grown in the area are corn, soybeans, and cotton. The town is also home to a number of small businesses, including a grocery store, a hardware store, and a few restaurants.
Demographics
As of the 2010 census, the population of Mcneil was 514 people. The racial makeup of the town was 97.3% White, 0.6% African American, 0.2% Native American, 0.2% Asian, 0.4% from other races, and 1.3% from two or more races. The median household income in the town was $31,250, and the median family income was $37,500. The per capita income in the town was $15,845.
Conclusion
Mcneil is a small town located in Arkansas, United States. It is situated in the southwestern part of the state, in the Ouachita Mountains. The town has a population of approximately 500 people and is part of the Little Rock-North Little Rock-Conway Metropolitan Statistical Area. The economy of the town is largely based on agriculture, and the town is home to a number of small businesses. The population of the town is predominantly White, and the median household income is $31,250.
Common Questions
What is Per Capita Income in McNeil?
Per Capita income in McNeil is $19,049.
What is the Median Family Income in McNeil?
Median Family Income in McNeil is $55,417.
What is the Median Household income in McNeil?
Median Household Income in McNeil is $34,625.
What is Income or Wage Gap in McNeil?
Income or Wage Gap in McNeil is 36.0%.
Women in McNeil earn 64.0 cents for every dollar earned by a man.
What is Inequality or Gini Index in McNeil?
Inequality or Gini Index in McNeil is 0.44.
What is the Total Population of McNeil?
Total Population of McNeil is 489.
What is the Total Male Population of McNeil?
Total Male Population of McNeil is 229.
What is the Total Female Population of McNeil?
Total Female Population of McNeil is 260.
What is the Ratio of Males per 100 Females in McNeil?
There are 88.08 Males per 100 Females in McNeil.
What is the Ratio of Females per 100 Males in McNeil?
There are 113.54 Females per 100 Males in McNeil.
What is the Median Population Age in McNeil?
Median Population Age in McNeil is 35.5 Years.
What is the Average Family Size in McNeil
Average Family Size in McNeil is 3.3 People.
What is the Average Household Size in McNeil
Average Household Size in McNeil is 2.3 People.
How Large is the Labor Force in McNeil?
There are 252 People in the Labor Forcein in McNeil.
What is the Percentage of People in the Labor Force in McNeil?
67.2% of People are in the Labor Force in McNeil.