North Crossett, AR Map & Demographics
North Crossett Map
North Crossett Overview
$20,191
PER CAPITA INCOME
$42,303
AVG FAMILY INCOME
$40,504
AVG HOUSEHOLD INCOME
53.2%
WAGE / INCOME GAP [ % ]
46.8¢/ $1
WAGE / INCOME GAP [ $ ]
$7,734
FAMILY INCOME DEFICIT
0.42
INEQUALITY / GINI INDEX
2,751
TOTAL POPULATION
1,369
MALE POPULATION
1,382
FEMALE POPULATION
99.06
MALES / 100 FEMALES
100.95
FEMALES / 100 MALES
45.7
MEDIAN AGE
3.9
AVG FAMILY SIZE
2.8
AVG HOUSEHOLD SIZE
1,042
LABOR FORCE [ PEOPLE ]
47.0%
PERCENT IN LABOR FORCE
4.7%
UNEMPLOYMENT RATE
Income in North Crossett
Income Overview in North Crossett
Per Capita Income in North Crossett is $20,191, while median incomes of families and households are $42,303 and $40,504 respectively.
| Characteristic | Number | Measure |
| Per Capita Income | 2,751 | $20,191 |
| Median Family Income | 563 | $42,303 |
| Mean Family Income | 563 | $59,409 |
| Median Household Income | 965 | $40,504 |
| Mean Household Income | 965 | $48,849 |
| Income Deficit | 563 | $7,734 |
| Wage / Income Gap (%) | 2,751 | 53.16% |
| Wage / Income Gap ($) | 2,751 | 46.84¢ per $1 |
| Gini / Inequality Index | 2,751 | 0.42 |
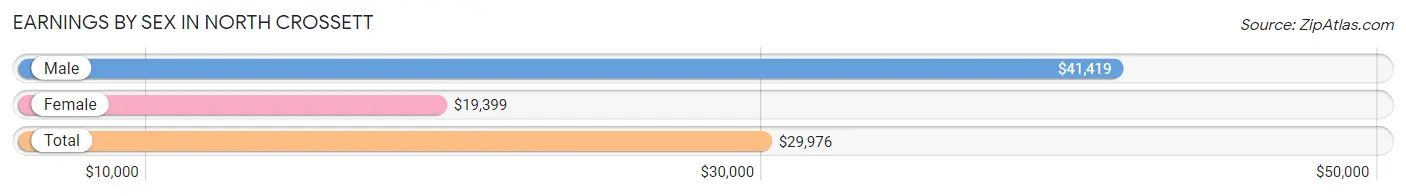
Earnings by Sex in North Crossett
Average Earnings in North Crossett are $29,976, $41,419 for men and $19,399 for women, a difference of 53.2%.
| Sex | Number | Average Earnings |
| Male | 526 (44.7%) | $41,419 |
| Female | 651 (55.3%) | $19,399 |
| Total | 1,177 (100.0%) | $29,976 |
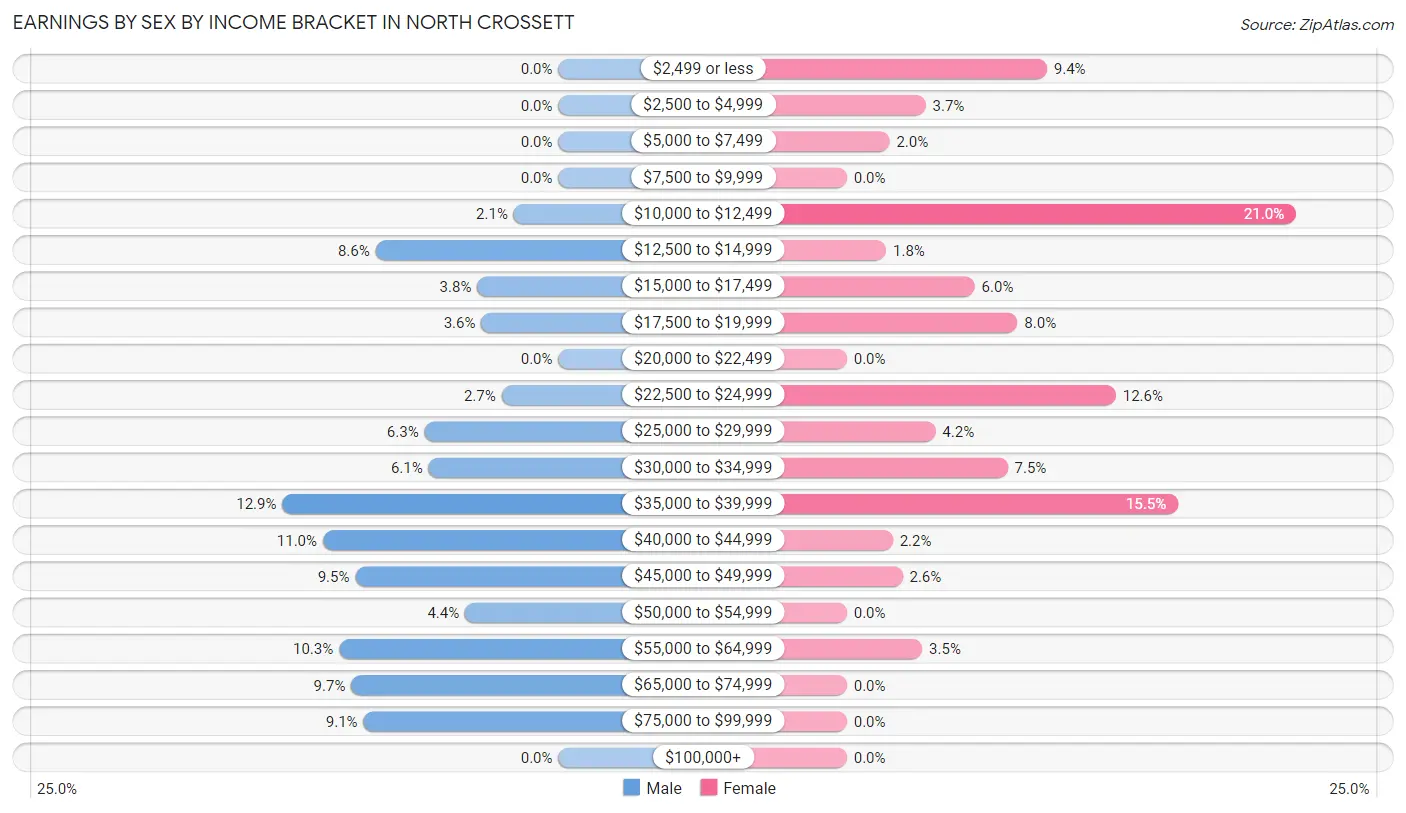
Earnings by Sex by Income Bracket in North Crossett
The most common earnings brackets in North Crossett are $35,000 to $39,999 for men (68 | 12.9%) and $10,000 to $12,499 for women (137 | 21.0%).
| Income | Male | Female |
| $2,499 or less | 0 (0.0%) | 61 (9.4%) |
| $2,500 to $4,999 | 0 (0.0%) | 24 (3.7%) |
| $5,000 to $7,499 | 0 (0.0%) | 13 (2.0%) |
| $7,500 to $9,999 | 0 (0.0%) | 0 (0.0%) |
| $10,000 to $12,499 | 11 (2.1%) | 137 (21.0%) |
| $12,500 to $14,999 | 45 (8.6%) | 12 (1.8%) |
| $15,000 to $17,499 | 20 (3.8%) | 39 (6.0%) |
| $17,500 to $19,999 | 19 (3.6%) | 52 (8.0%) |
| $20,000 to $22,499 | 0 (0.0%) | 0 (0.0%) |
| $22,500 to $24,999 | 14 (2.7%) | 82 (12.6%) |
| $25,000 to $29,999 | 33 (6.3%) | 27 (4.2%) |
| $30,000 to $34,999 | 32 (6.1%) | 49 (7.5%) |
| $35,000 to $39,999 | 68 (12.9%) | 101 (15.5%) |
| $40,000 to $44,999 | 58 (11.0%) | 14 (2.1%) |
| $45,000 to $49,999 | 50 (9.5%) | 17 (2.6%) |
| $50,000 to $54,999 | 23 (4.4%) | 0 (0.0%) |
| $55,000 to $64,999 | 54 (10.3%) | 23 (3.5%) |
| $65,000 to $74,999 | 51 (9.7%) | 0 (0.0%) |
| $75,000 to $99,999 | 48 (9.1%) | 0 (0.0%) |
| $100,000+ | 0 (0.0%) | 0 (0.0%) |
| Total | 526 (100.0%) | 651 (100.0%) |
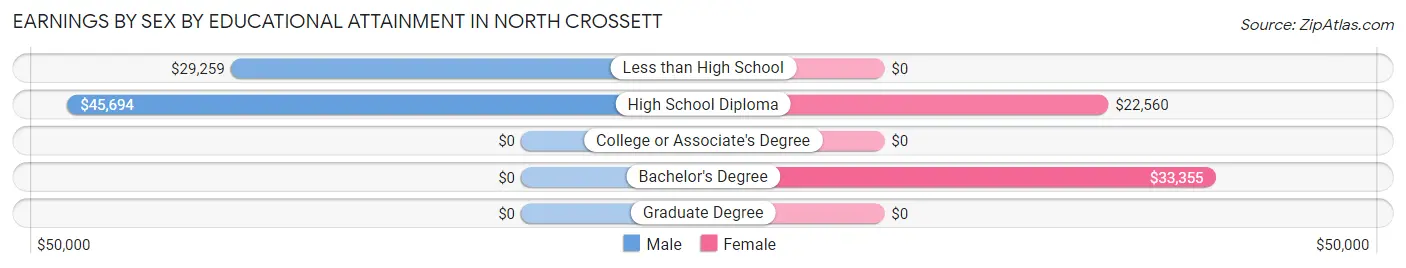
Earnings by Sex by Educational Attainment in North Crossett
Average earnings in North Crossett are $41,351 for men and $18,787 for women, a difference of 54.6%. Men with an educational attainment of high school diploma enjoy the highest average annual earnings of $45,694, while those with less than high school education earn the least with $29,259. Women with an educational attainment of bachelor's degree earn the most with the average annual earnings of $33,355, while those with high school diploma education have the smallest earnings of $22,560.
| Educational Attainment | Male Income | Female Income |
| Less than High School | $29,259 | $0 |
| High School Diploma | $45,694 | $22,560 |
| College or Associate's Degree | - | - |
| Bachelor's Degree | - | - |
| Graduate Degree | - | - |
| Total | $41,351 | $18,787 |
Family Income in North Crossett
Family Income Brackets in North Crossett
According to the North Crossett family income data, there are 111 families falling into the $15,000 to $24,999 income range, which is the most common income bracket and makes up 19.7% of all families.
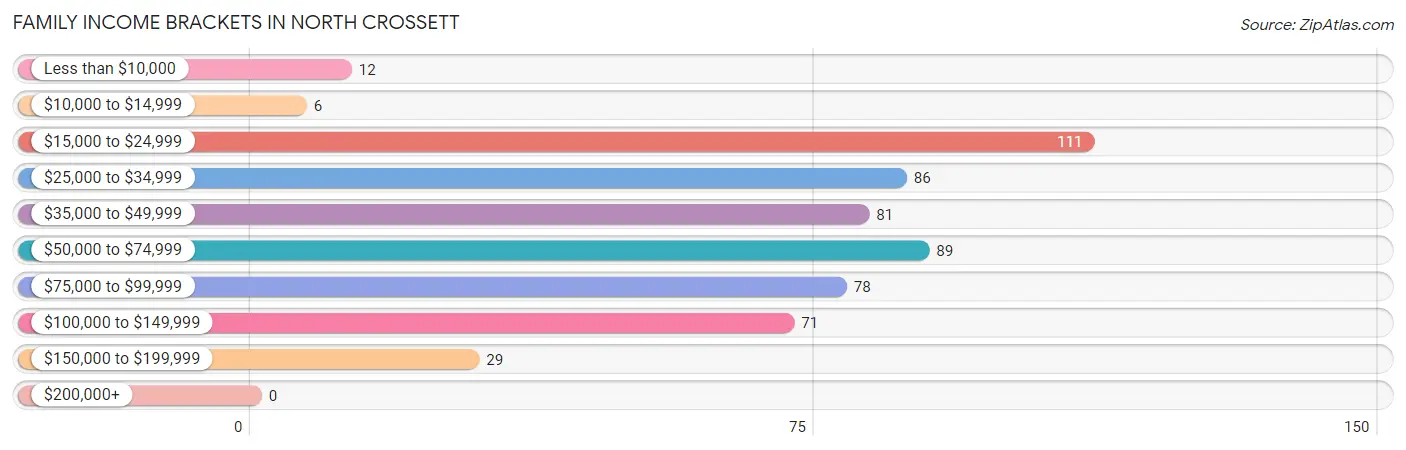
| Income Bracket | # Families | % Families |
| Less than $10,000 | 12 | 2.1% |
| $10,000 to $14,999 | 6 | 1.1% |
| $15,000 to $24,999 | 111 | 19.7% |
| $25,000 to $34,999 | 86 | 15.3% |
| $35,000 to $49,999 | 81 | 14.4% |
| $50,000 to $74,999 | 89 | 15.8% |
| $75,000 to $99,999 | 78 | 13.9% |
| $100,000 to $149,999 | 71 | 12.6% |
| $150,000 to $199,999 | 29 | 5.2% |
| $200,000+ | 0 | 0.0% |
Family Income by Famaliy Size in North Crossett
4-person families (96 | 17.1%) account for the highest median family income in North Crossett with $77,750 per family, while 3-person families (129 | 22.9%) have the highest median income of $21,634 per family member.
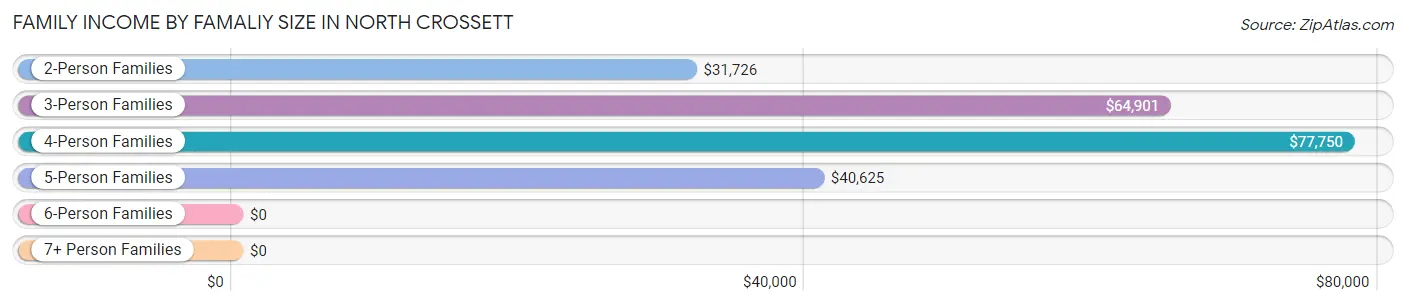
| Income Bracket | # Families | Median Income |
| 2-Person Families | 271 (48.1%) | $31,726 |
| 3-Person Families | 129 (22.9%) | $64,901 |
| 4-Person Families | 96 (17.1%) | $77,750 |
| 5-Person Families | 57 (10.1%) | $40,625 |
| 6-Person Families | 10 (1.8%) | $0 |
| 7+ Person Families | 0 (0.0%) | $0 |
| Total | 563 (100.0%) | $42,303 |
Family Income by Number of Earners in North Crossett
The median family income in North Crossett is $42,303, with families comprising 3+ earners (81) having the highest median family income of $114,801, while families with 1 earner (126) have the lowest median family income of $28,864, accounting for 14.4% and 22.4% of families, respectively.
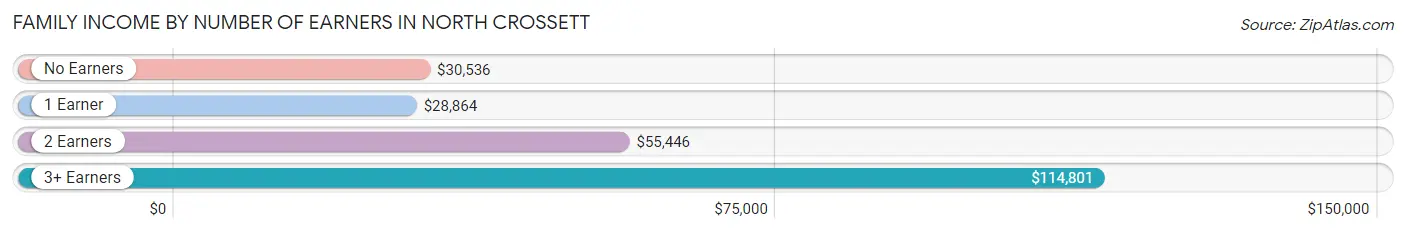
| Number of Earners | # Families | Median Income |
| No Earners | 171 (30.4%) | $30,536 |
| 1 Earner | 126 (22.4%) | $28,864 |
| 2 Earners | 185 (32.9%) | $55,446 |
| 3+ Earners | 81 (14.4%) | $114,801 |
| Total | 563 (100.0%) | $42,303 |
Household Income in North Crossett
Household Income Brackets in North Crossett
With 175 households falling in the category, the $50,000 to $74,999 income range is the most frequent in North Crossett, accounting for 18.1% of all households.
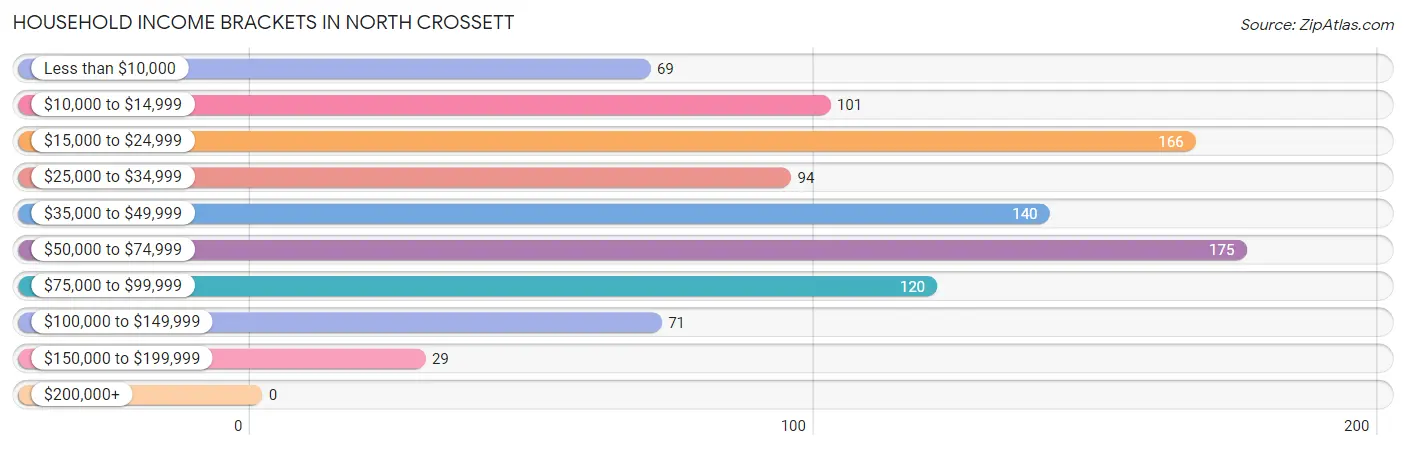
| Income Bracket | # Households | % Households |
| Less than $10,000 | 69 | 7.2% |
| $10,000 to $14,999 | 101 | 10.5% |
| $15,000 to $24,999 | 166 | 17.2% |
| $25,000 to $34,999 | 94 | 9.7% |
| $35,000 to $49,999 | 140 | 14.5% |
| $50,000 to $74,999 | 175 | 18.1% |
| $75,000 to $99,999 | 120 | 12.4% |
| $100,000 to $149,999 | 71 | 7.4% |
| $150,000 to $199,999 | 29 | 3.0% |
| $200,000+ | 0 | 0.0% |
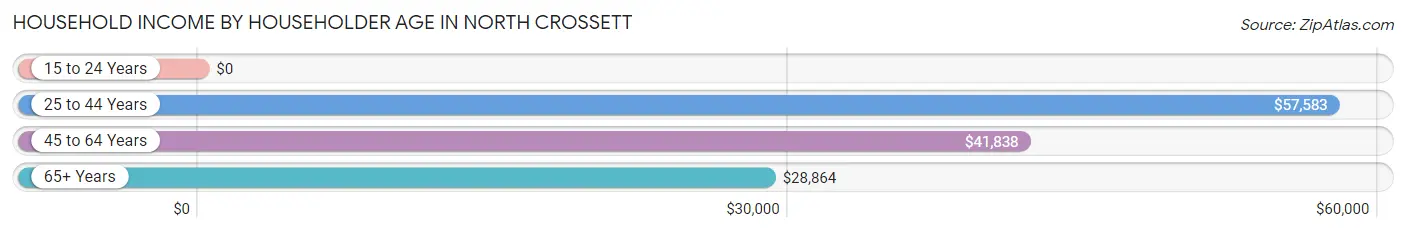
Household Income by Householder Age in North Crossett
The median household income in North Crossett is $40,504, with the highest median household income of $57,583 found in the 25 to 44 years age bracket for the primary householder. A total of 183 households (19.0%) fall into this category. Meanwhile, the 15 to 24 years age bracket for the primary householder has the lowest median household income of $0, with 19 households (2.0%) in this group.
| Income Bracket | # Households | Median Income |
| 15 to 24 Years | 19 (2.0%) | $0 |
| 25 to 44 Years | 183 (19.0%) | $57,583 |
| 45 to 64 Years | 451 (46.7%) | $41,838 |
| 65+ Years | 312 (32.3%) | $28,864 |
| Total | 965 (100.0%) | $40,504 |
Poverty in North Crossett
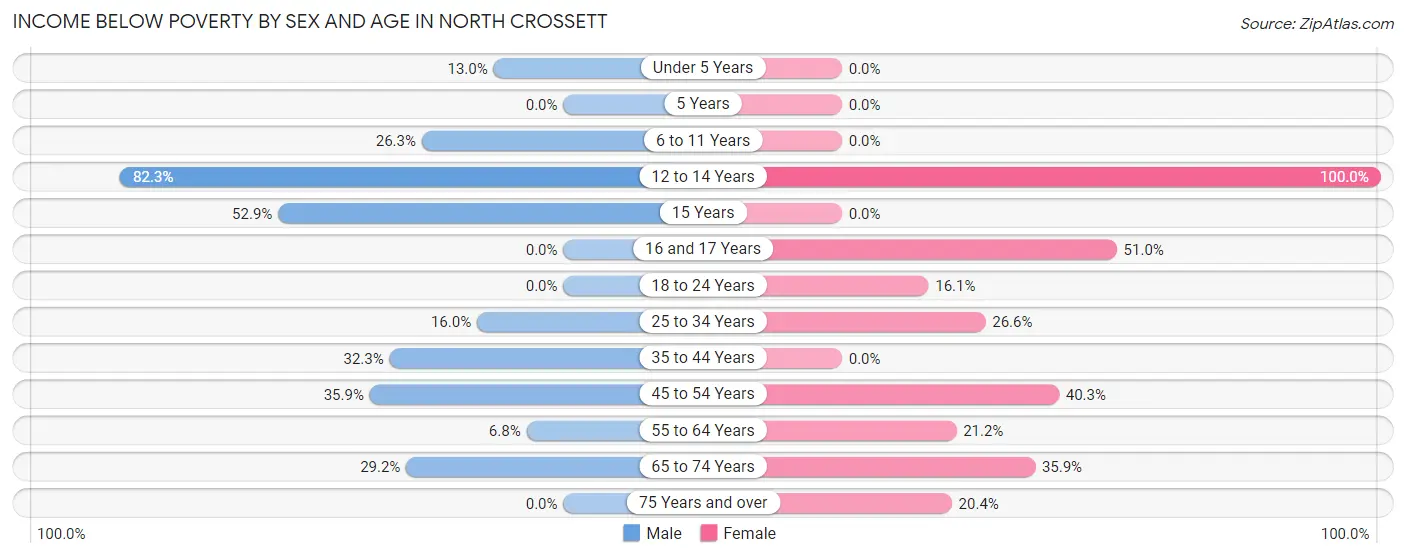
Income Below Poverty by Sex and Age in North Crossett
With 21.7% poverty level for males and 26.6% for females among the residents of North Crossett, 12 to 14 year old males and 12 to 14 year old females are the most vulnerable to poverty, with 79 males (82.3%) and 25 females (100.0%) in their respective age groups living below the poverty level.
| Age Bracket | Male | Female |
| Under 5 Years | 14 (13.0%) | 0 (0.0%) |
| 5 Years | 0 (0.0%) | 0 (0.0%) |
| 6 to 11 Years | 31 (26.3%) | 0 (0.0%) |
| 12 to 14 Years | 79 (82.3%) | 25 (100.0%) |
| 15 Years | 27 (52.9%) | 0 (0.0%) |
| 16 and 17 Years | 0 (0.0%) | 25 (51.0%) |
| 18 to 24 Years | 0 (0.0%) | 13 (16.1%) |
| 25 to 34 Years | 25 (16.0%) | 90 (26.6%) |
| 35 to 44 Years | 30 (32.3%) | 0 (0.0%) |
| 45 to 54 Years | 46 (35.9%) | 118 (40.3%) |
| 55 to 64 Years | 16 (6.8%) | 45 (21.2%) |
| 65 to 74 Years | 28 (29.2%) | 19 (35.8%) |
| 75 Years and over | 0 (0.0%) | 31 (20.4%) |
| Total | 296 (21.7%) | 366 (26.6%) |
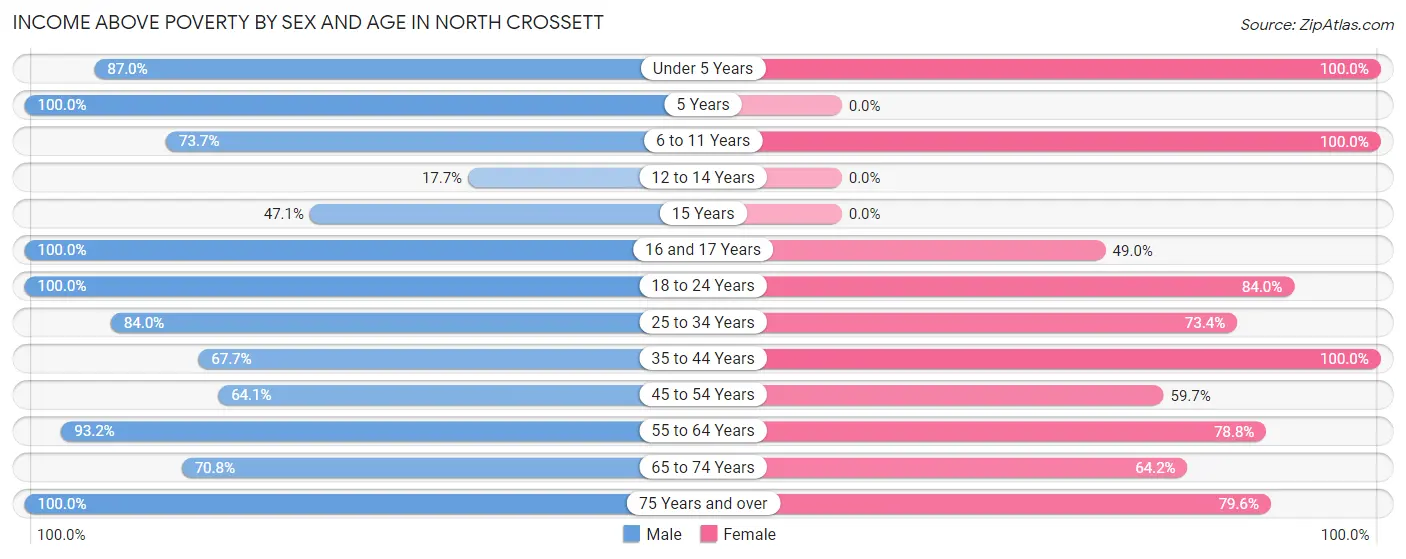
Income Above Poverty by Sex and Age in North Crossett
According to the poverty statistics in North Crossett, males aged 5 years and females aged under 5 years are the age groups that are most secure financially, with 100.0% of males and 100.0% of females in these age groups living above the poverty line.
| Age Bracket | Male | Female |
| Under 5 Years | 94 (87.0%) | 6 (100.0%) |
| 5 Years | 15 (100.0%) | 0 (0.0%) |
| 6 to 11 Years | 87 (73.7%) | 114 (100.0%) |
| 12 to 14 Years | 17 (17.7%) | 0 (0.0%) |
| 15 Years | 24 (47.1%) | 0 (0.0%) |
| 16 and 17 Years | 7 (100.0%) | 24 (49.0%) |
| 18 to 24 Years | 52 (100.0%) | 68 (84.0%) |
| 25 to 34 Years | 131 (84.0%) | 248 (73.4%) |
| 35 to 44 Years | 63 (67.7%) | 52 (100.0%) |
| 45 to 54 Years | 82 (64.1%) | 175 (59.7%) |
| 55 to 64 Years | 218 (93.2%) | 167 (78.8%) |
| 65 to 74 Years | 68 (70.8%) | 34 (64.1%) |
| 75 Years and over | 209 (100.0%) | 121 (79.6%) |
| Total | 1,067 (78.3%) | 1,009 (73.4%) |
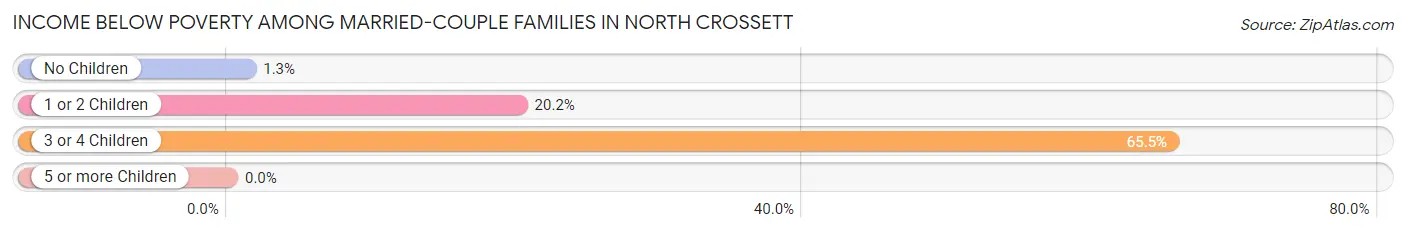
Income Below Poverty Among Married-Couple Families in North Crossett
The poverty statistics for married-couple families in North Crossett show that 10.2% or 47 of the total 463 families live below the poverty line. Families with 3 or 4 children have the highest poverty rate of 65.5%, comprising of 19 families. On the other hand, families with no children have the lowest poverty rate of 1.3%, which includes 4 families.
| Children | Above Poverty | Below Poverty |
| No Children | 311 (98.7%) | 4 (1.3%) |
| 1 or 2 Children | 95 (79.8%) | 24 (20.2%) |
| 3 or 4 Children | 10 (34.5%) | 19 (65.5%) |
| 5 or more Children | 0 (0.0%) | 0 (0.0%) |
| Total | 416 (89.8%) | 47 (10.2%) |
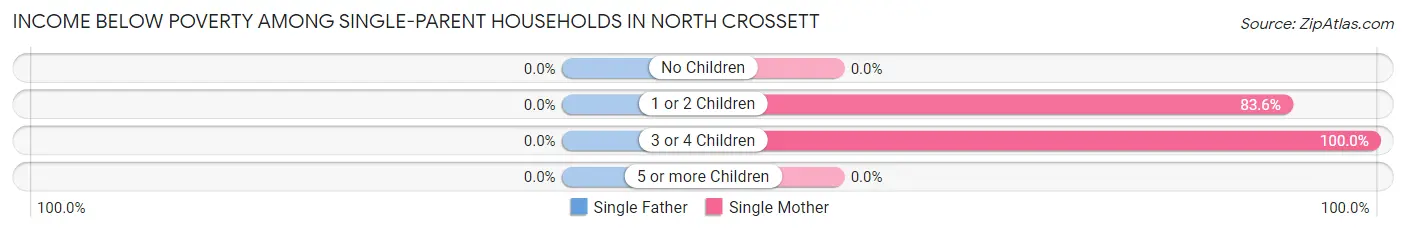
Income Below Poverty Among Single-Parent Households in North Crossett
| Children | Single Father | Single Mother |
| No Children | 0 (0.0%) | 0 (0.0%) |
| 1 or 2 Children | 0 (0.0%) | 51 (83.6%) |
| 3 or 4 Children | 0 (0.0%) | 12 (100.0%) |
| 5 or more Children | 0 (0.0%) | 0 (0.0%) |
| Total | 0 (0.0%) | 63 (67.0%) |
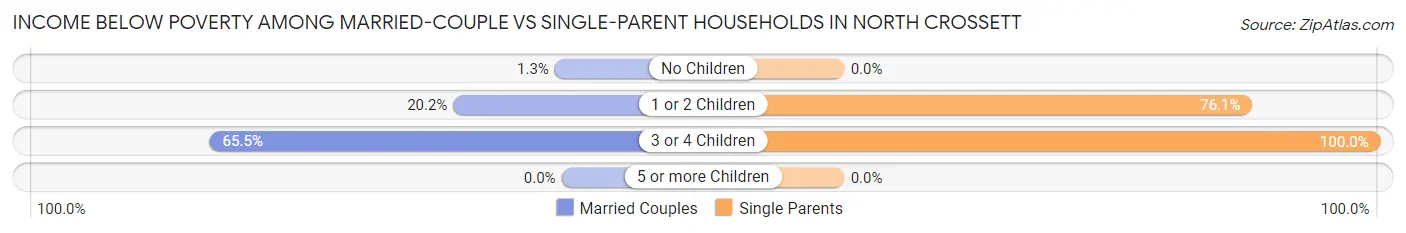
Income Below Poverty Among Married-Couple vs Single-Parent Households in North Crossett
The poverty data for North Crossett shows that 47 of the married-couple family households (10.2%) and 63 of the single-parent households (63.0%) are living below the poverty level. Within the married-couple family households, those with 3 or 4 children have the highest poverty rate, with 19 households (65.5%) falling below the poverty line. Among the single-parent households, those with 3 or 4 children have the highest poverty rate, with 12 household (100.0%) living below poverty.
| Children | Married-Couple Families | Single-Parent Households |
| No Children | 4 (1.3%) | 0 (0.0%) |
| 1 or 2 Children | 24 (20.2%) | 51 (76.1%) |
| 3 or 4 Children | 19 (65.5%) | 12 (100.0%) |
| 5 or more Children | 0 (0.0%) | 0 (0.0%) |
| Total | 47 (10.2%) | 63 (63.0%) |
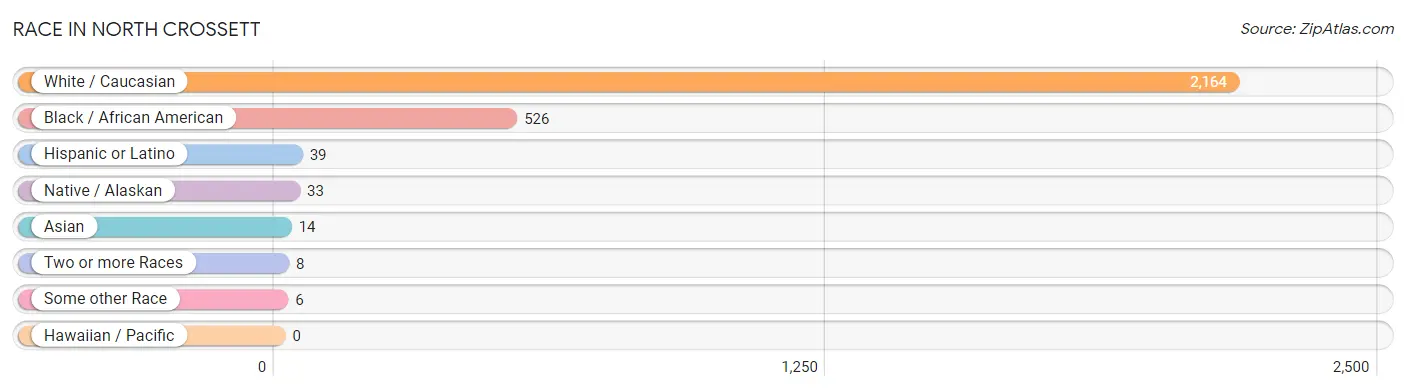
Race in North Crossett
The most populous races in North Crossett are White / Caucasian (2,164 | 78.7%), Black / African American (526 | 19.1%), and Hispanic or Latino (39 | 1.4%).
| Race | # Population | % Population |
| Asian | 14 | 0.5% |
| Black / African American | 526 | 19.1% |
| Hawaiian / Pacific | 0 | 0.0% |
| Hispanic or Latino | 39 | 1.4% |
| Native / Alaskan | 33 | 1.2% |
| White / Caucasian | 2,164 | 78.7% |
| Two or more Races | 8 | 0.3% |
| Some other Race | 6 | 0.2% |
| Total | 2,751 | 100.0% |
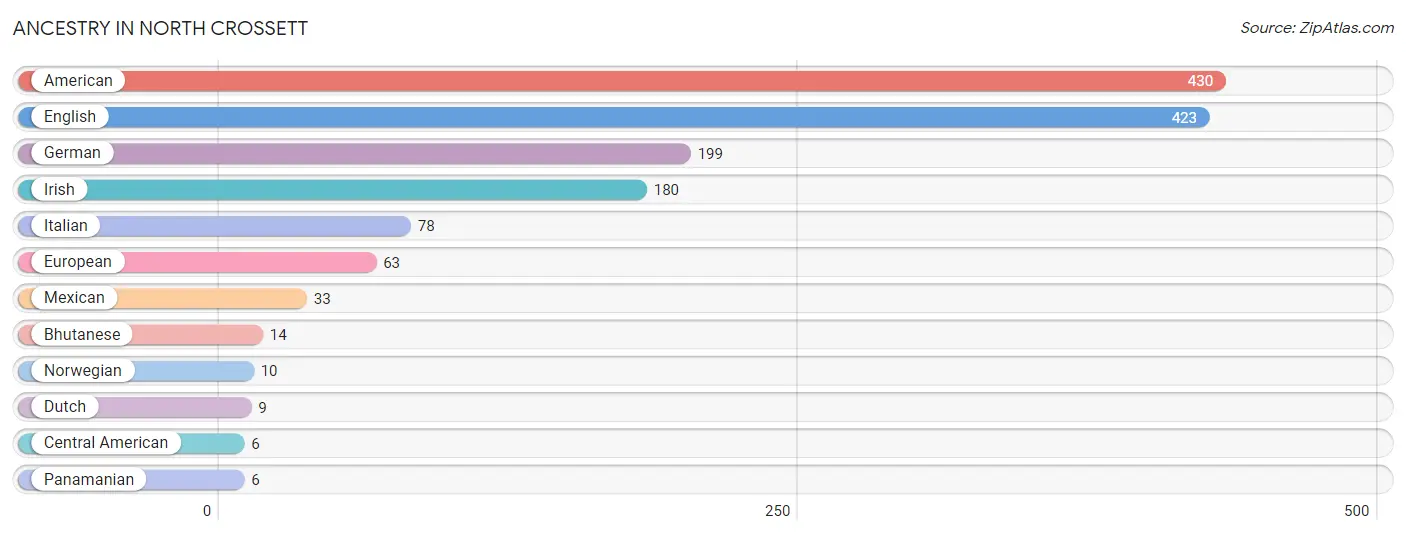
Ancestry in North Crossett
The most populous ancestries reported in North Crossett are American (430 | 15.6%), English (423 | 15.4%), German (199 | 7.2%), Irish (180 | 6.5%), and Italian (78 | 2.8%), together accounting for 47.6% of all North Crossett residents.
| Ancestry | # Population | % Population |
| American | 430 | 15.6% |
| Bhutanese | 14 | 0.5% |
| Central American | 6 | 0.2% |
| Dutch | 9 | 0.3% |
| English | 423 | 15.4% |
| European | 63 | 2.3% |
| German | 199 | 7.2% |
| Irish | 180 | 6.5% |
| Italian | 78 | 2.8% |
| Mexican | 33 | 1.2% |
| Norwegian | 10 | 0.4% |
| Panamanian | 6 | 0.2% | View All 12 Rows |
Immigrants in North Crossett
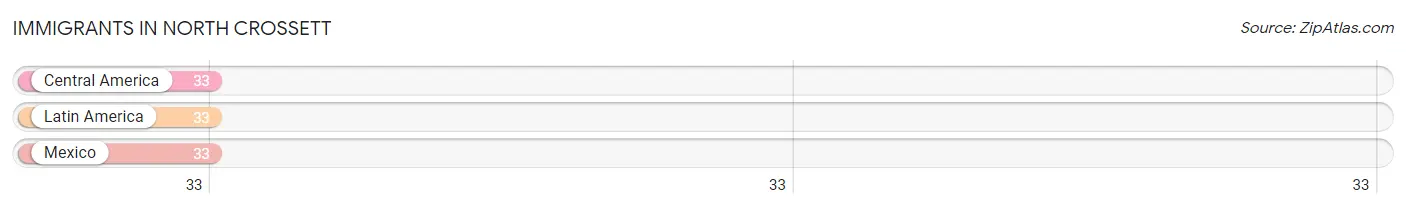
The most numerous immigrant groups reported in North Crossett came from Central America (33 | 1.2%), Latin America (33 | 1.2%), and Mexico (33 | 1.2%), together accounting for 3.6% of all North Crossett residents.
| Immigration Origin | # Population | % Population |
| Central America | 33 | 1.2% |
| Latin America | 33 | 1.2% |
| Mexico | 33 | 1.2% | View All 3 Rows |
Sex and Age in North Crossett
Sex and Age in North Crossett
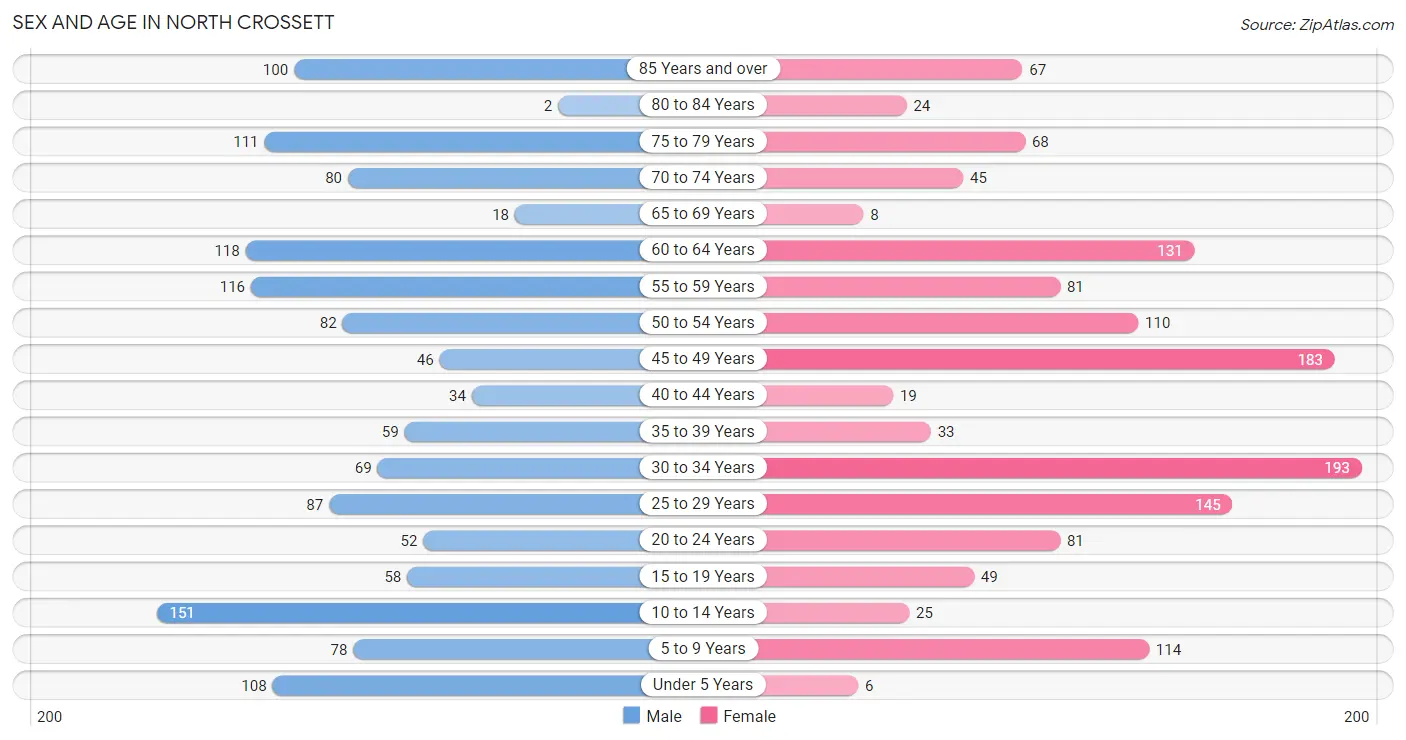
The most populous age groups in North Crossett are 10 to 14 Years (151 | 11.0%) for men and 30 to 34 Years (193 | 14.0%) for women.
| Age Bracket | Male | Female |
| Under 5 Years | 108 (7.9%) | 6 (0.4%) |
| 5 to 9 Years | 78 (5.7%) | 114 (8.3%) |
| 10 to 14 Years | 151 (11.0%) | 25 (1.8%) |
| 15 to 19 Years | 58 (4.2%) | 49 (3.5%) |
| 20 to 24 Years | 52 (3.8%) | 81 (5.9%) |
| 25 to 29 Years | 87 (6.4%) | 145 (10.5%) |
| 30 to 34 Years | 69 (5.0%) | 193 (14.0%) |
| 35 to 39 Years | 59 (4.3%) | 33 (2.4%) |
| 40 to 44 Years | 34 (2.5%) | 19 (1.4%) |
| 45 to 49 Years | 46 (3.4%) | 183 (13.2%) |
| 50 to 54 Years | 82 (6.0%) | 110 (8.0%) |
| 55 to 59 Years | 116 (8.5%) | 81 (5.9%) |
| 60 to 64 Years | 118 (8.6%) | 131 (9.5%) |
| 65 to 69 Years | 18 (1.3%) | 8 (0.6%) |
| 70 to 74 Years | 80 (5.8%) | 45 (3.3%) |
| 75 to 79 Years | 111 (8.1%) | 68 (4.9%) |
| 80 to 84 Years | 2 (0.2%) | 24 (1.7%) |
| 85 Years and over | 100 (7.3%) | 67 (4.9%) |
| Total | 1,369 (100.0%) | 1,382 (100.0%) |
Families and Households in North Crossett
Median Family Size in North Crossett
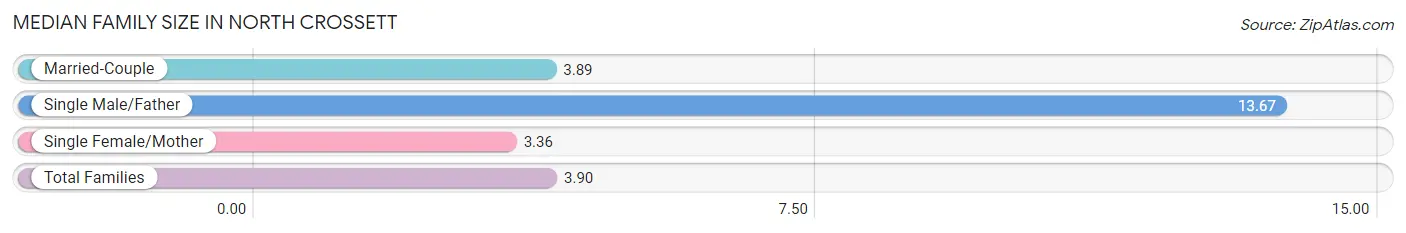
The median family size in North Crossett is 3.90 persons per family, with single male/father families (6 | 1.1%) accounting for the largest median family size of 13.67 persons per family. On the other hand, single female/mother families (94 | 16.7%) represent the smallest median family size with 3.36 persons per family.
| Family Type | # Families | Family Size |
| Married-Couple | 463 (82.2%) | 3.89 |
| Single Male/Father | 6 (1.1%) | 13.67 |
| Single Female/Mother | 94 (16.7%) | 3.36 |
| Total Families | 563 (100.0%) | 3.90 |
Median Household Size in North Crossett
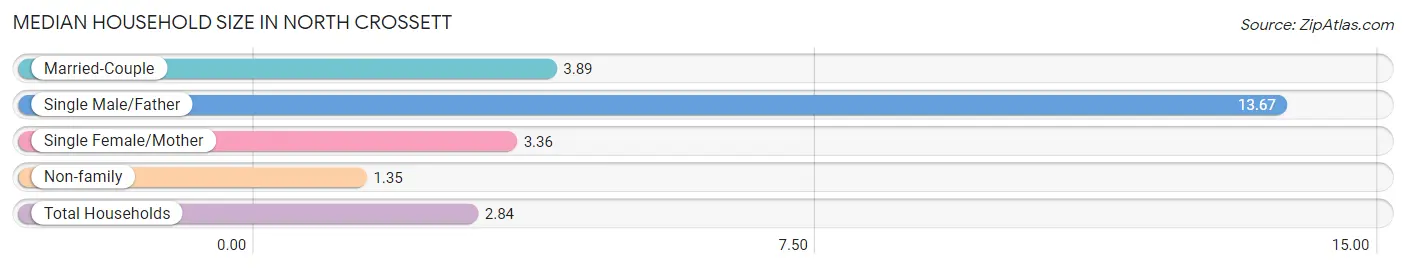
The median household size in North Crossett is 2.84 persons per household, with single male/father households (6 | 0.6%) accounting for the largest median household size of 13.67 persons per household. non-family households (402 | 41.7%) represent the smallest median household size with 1.35 persons per household.
| Household Type | # Households | Household Size |
| Married-Couple | 463 (48.0%) | 3.89 |
| Single Male/Father | 6 (0.6%) | 13.67 |
| Single Female/Mother | 94 (9.7%) | 3.36 |
| Non-family | 402 (41.7%) | 1.35 |
| Total Households | 965 (100.0%) | 2.84 |
Household Size by Marriage Status in North Crossett
Out of a total of 965 households in North Crossett, 563 (58.3%) are family households, while 402 (41.7%) are nonfamily households. The most numerous type of family households are 2-person households, comprising 271, and the most common type of nonfamily households are 1-person households, comprising 329.
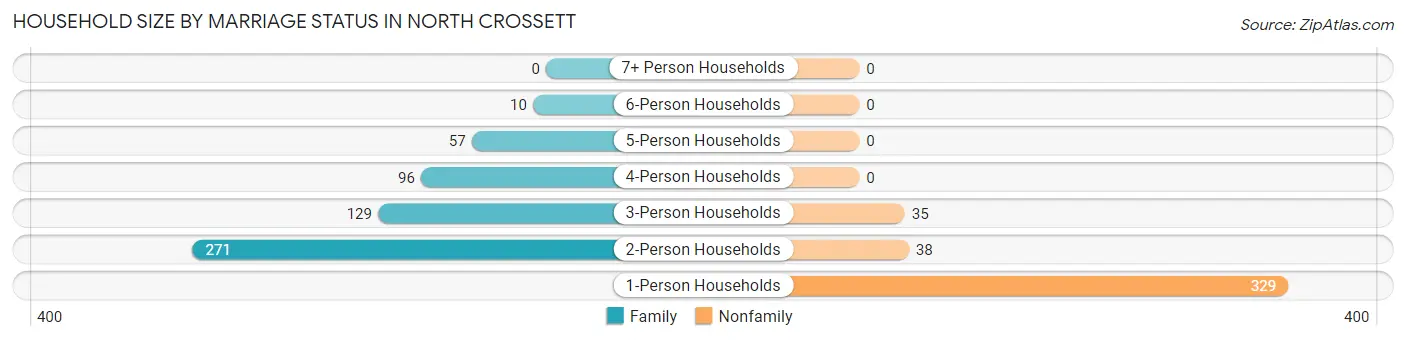
| Household Size | Family Households | Nonfamily Households |
| 1-Person Households | - | 329 (34.1%) |
| 2-Person Households | 271 (28.1%) | 38 (3.9%) |
| 3-Person Households | 129 (13.4%) | 35 (3.6%) |
| 4-Person Households | 96 (10.0%) | 0 (0.0%) |
| 5-Person Households | 57 (5.9%) | 0 (0.0%) |
| 6-Person Households | 10 (1.0%) | 0 (0.0%) |
| 7+ Person Households | 0 (0.0%) | 0 (0.0%) |
| Total | 563 (58.3%) | 402 (41.7%) |
Female Fertility in North Crossett
Fertility by Age in North Crossett
| Age Bracket | Women with Births | Births / 1,000 Women |
| 15 to 19 years | 0 (0.0%) | 0.0 |
| 20 to 34 years | 0 (0.0%) | 0.0 |
| 35 to 50 years | 0 (0.0%) | 0.0 |
| Total | 0 (0.0%) | 0.0 |
Fertility by Age by Marriage Status in North Crossett
| Age Bracket | Married | Unmarried |
| 15 to 19 years | 0 (0.0%) | 0 (0.0%) |
| 20 to 34 years | 0 (0.0%) | 0 (0.0%) |
| 35 to 50 years | 0 (0.0%) | 0 (0.0%) |
| Total | 0 (0.0%) | 0 (0.0%) |
Fertility by Education in North Crossett
| Educational Attainment | Women with Births | Births / 1,000 Women |
| Less than High School | 0 (0.0%) | 0.0 |
| High School Diploma | 0 (0.0%) | 0.0 |
| College or Associate's Degree | 0 (0.0%) | 0.0 |
| Bachelor's Degree | 0 (0.0%) | 0.0 |
| Graduate Degree | 0 (0.0%) | 0.0 |
| Total | 0 (0.0%) | 0.0 |
Fertility by Education by Marriage Status in North Crossett
| Educational Attainment | Married | Unmarried |
| Less than High School | 0 (0.0%) | 0 (0.0%) |
| High School Diploma | 0 (0.0%) | 0 (0.0%) |
| College or Associate's Degree | 0 (0.0%) | 0 (0.0%) |
| Bachelor's Degree | 0 (0.0%) | 0 (0.0%) |
| Graduate Degree | 0 (0.0%) | 0 (0.0%) |
| Total | 0 (0.0%) | 0 (0.0%) |
Employment Characteristics in North Crossett
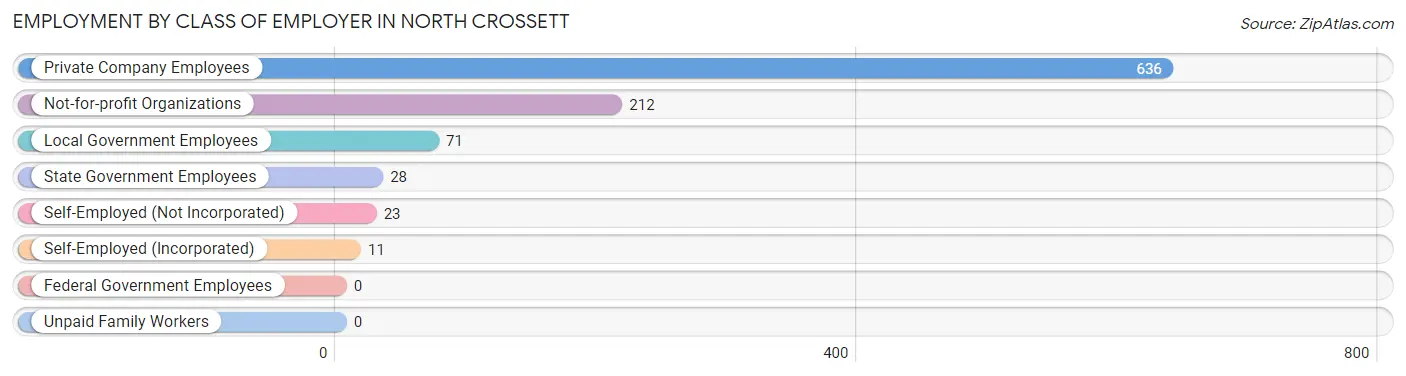
Employment by Class of Employer in North Crossett
Among the 981 employed individuals in North Crossett, private company employees (636 | 64.8%), not-for-profit organizations (212 | 21.6%), and local government employees (71 | 7.2%) make up the most common classes of employment.
| Employer Class | # Employees | % Employees |
| Private Company Employees | 636 | 64.8% |
| Self-Employed (Incorporated) | 11 | 1.1% |
| Self-Employed (Not Incorporated) | 23 | 2.3% |
| Not-for-profit Organizations | 212 | 21.6% |
| Local Government Employees | 71 | 7.2% |
| State Government Employees | 28 | 2.9% |
| Federal Government Employees | 0 | 0.0% |
| Unpaid Family Workers | 0 | 0.0% |
| Total | 981 | 100.0% |
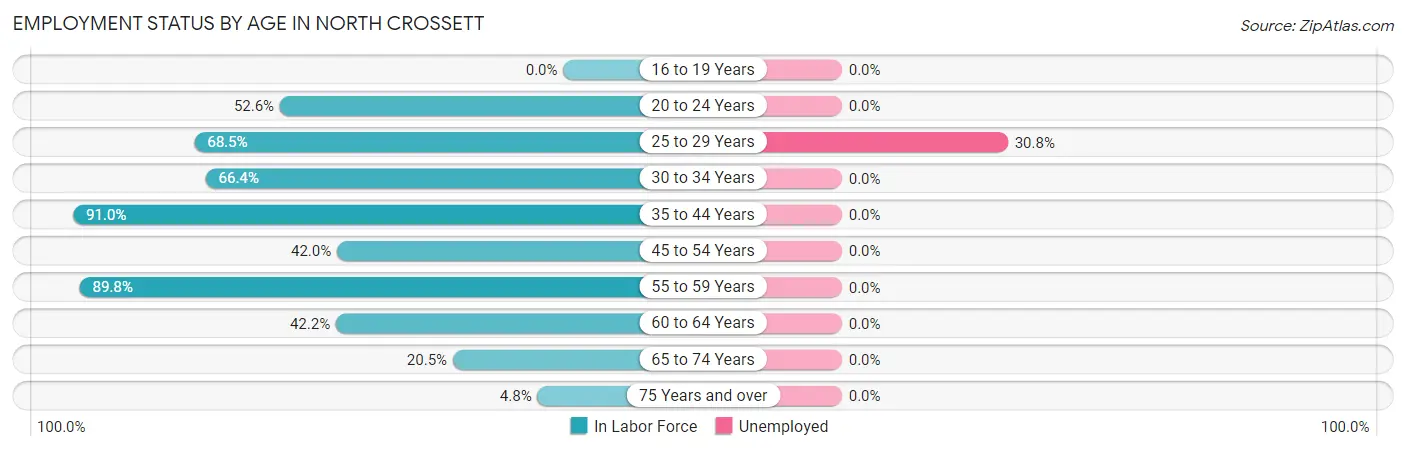
Employment Status by Age in North Crossett
According to the labor force statistics for North Crossett, out of the total population over 16 years of age (2,218), 47.0% or 1,042 individuals are in the labor force, with 4.7% or 49 of them unemployed. The age group with the highest labor force participation rate is 35 to 44 years, with 91.0% or 132 individuals in the labor force. Within the labor force, the 25 to 29 years age range has the highest percentage of unemployed individuals, with 30.8% or 49 of them being unemployed.
| Age Bracket | In Labor Force | Unemployed |
| 16 to 19 Years | 0 (0.0%) | 0 (0.0%) |
| 20 to 24 Years | 70 (52.6%) | 0 (0.0%) |
| 25 to 29 Years | 159 (68.5%) | 49 (30.8%) |
| 30 to 34 Years | 174 (66.4%) | 0 (0.0%) |
| 35 to 44 Years | 132 (91.0%) | 0 (0.0%) |
| 45 to 54 Years | 177 (42.0%) | 0 (0.0%) |
| 55 to 59 Years | 177 (89.8%) | 0 (0.0%) |
| 60 to 64 Years | 105 (42.2%) | 0 (0.0%) |
| 65 to 74 Years | 31 (20.5%) | 0 (0.0%) |
| 75 Years and over | 18 (4.8%) | 0 (0.0%) |
| Total | 1,042 (47.0%) | 49 (4.7%) |
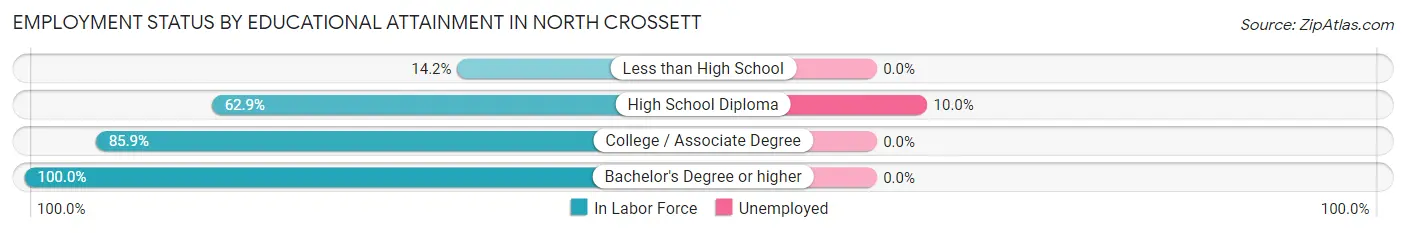
Employment Status by Educational Attainment in North Crossett
According to labor force statistics for North Crossett, 61.4% of individuals (925) out of the total population between 25 and 64 years of age (1,506) are in the labor force, with 5.3% or 49 of them being unemployed. The group with the highest labor force participation rate are those with the educational attainment of bachelor's degree or higher, with 100.0% or 82 individuals in the labor force. Within the labor force, individuals with high school diploma education have the highest percentage of unemployment, with 10.0% or 49 of them being unemployed.
| Educational Attainment | In Labor Force | Unemployed |
| Less than High School | 40 (14.2%) | 0 (0.0%) |
| High School Diploma | 492 (62.9%) | 78 (10.0%) |
| College / Associate Degree | 310 (85.9%) | 0 (0.0%) |
| Bachelor's Degree or higher | 82 (100.0%) | 0 (0.0%) |
| Total | 925 (61.4%) | 80 (5.3%) |
Employment Occupations by Sex in North Crossett
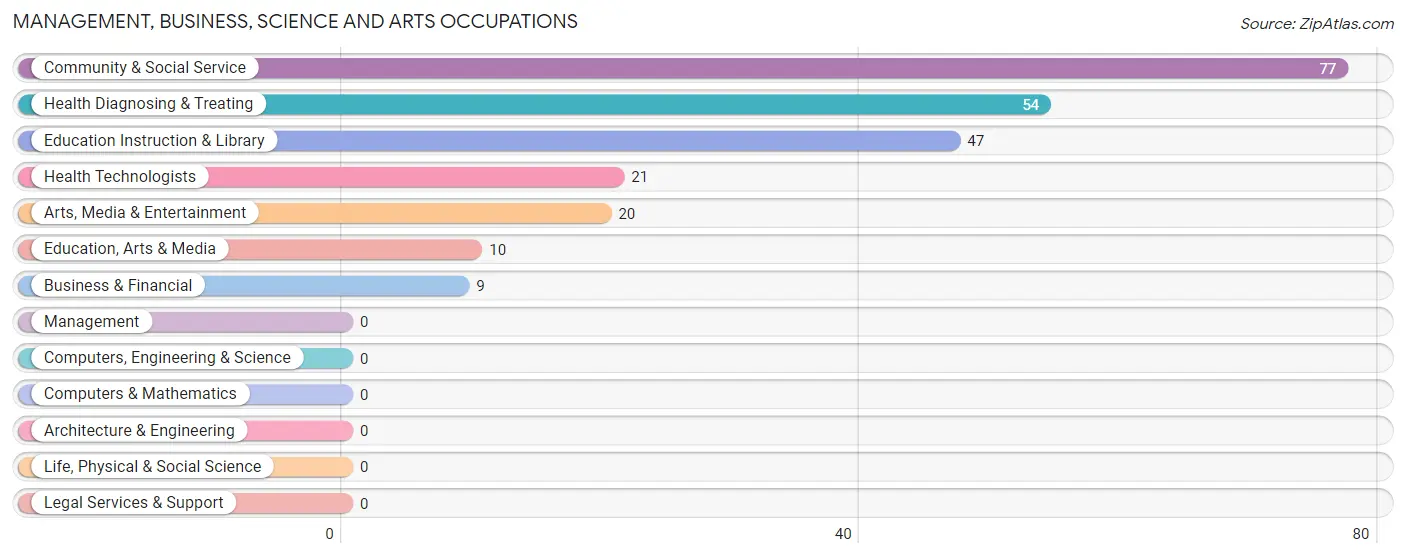
Management, Business, Science and Arts Occupations
The most common Management, Business, Science and Arts occupations in North Crossett are Community & Social Service (77 | 7.7%), Health Diagnosing & Treating (54 | 5.4%), Education Instruction & Library (47 | 4.7%), Health Technologists (21 | 2.1%), and Arts, Media & Entertainment (20 | 2.0%).
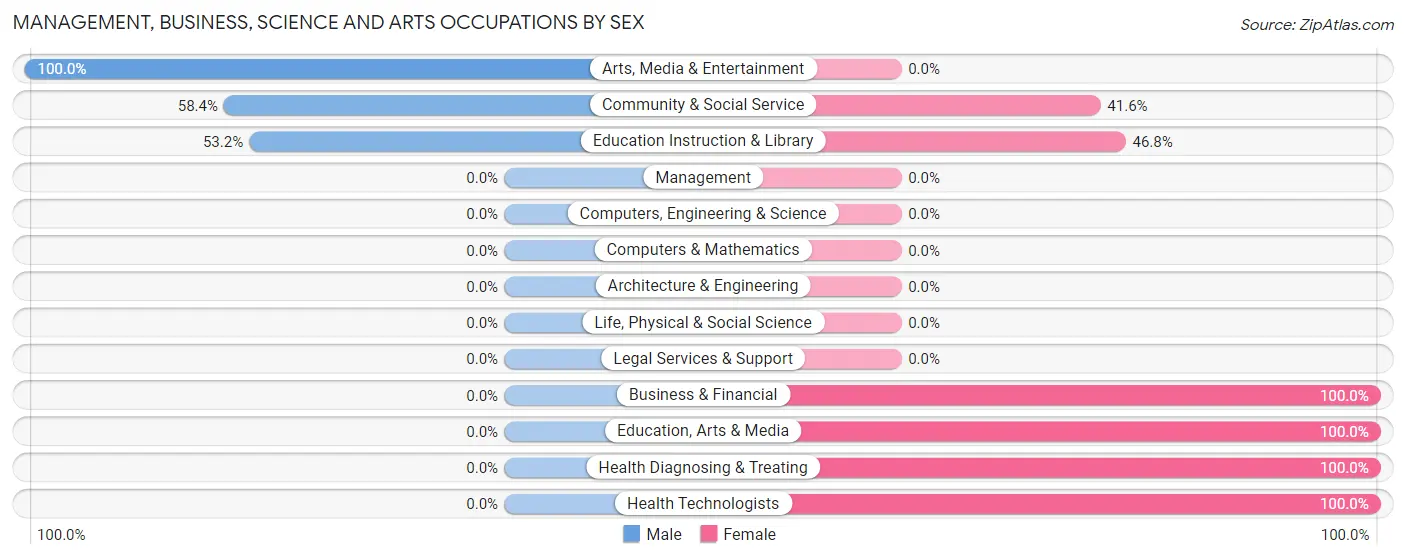
Management, Business, Science and Arts Occupations by Sex
Within the Management, Business, Science and Arts occupations in North Crossett, the most male-oriented occupations are Arts, Media & Entertainment (100.0%), Community & Social Service (58.4%), and Education Instruction & Library (53.2%), while the most female-oriented occupations are Business & Financial (100.0%), Education, Arts & Media (100.0%), and Health Diagnosing & Treating (100.0%).
| Occupation | Male | Female |
| Management | 0 (0.0%) | 0 (0.0%) |
| Business & Financial | 0 (0.0%) | 9 (100.0%) |
| Computers, Engineering & Science | 0 (0.0%) | 0 (0.0%) |
| Computers & Mathematics | 0 (0.0%) | 0 (0.0%) |
| Architecture & Engineering | 0 (0.0%) | 0 (0.0%) |
| Life, Physical & Social Science | 0 (0.0%) | 0 (0.0%) |
| Community & Social Service | 45 (58.4%) | 32 (41.6%) |
| Education, Arts & Media | 0 (0.0%) | 10 (100.0%) |
| Legal Services & Support | 0 (0.0%) | 0 (0.0%) |
| Education Instruction & Library | 25 (53.2%) | 22 (46.8%) |
| Arts, Media & Entertainment | 20 (100.0%) | 0 (0.0%) |
| Health Diagnosing & Treating | 0 (0.0%) | 54 (100.0%) |
| Health Technologists | 0 (0.0%) | 21 (100.0%) |
| Total (Category) | 45 (32.1%) | 95 (67.9%) |
| Total (Overall) | 433 (43.6%) | 561 (56.4%) |
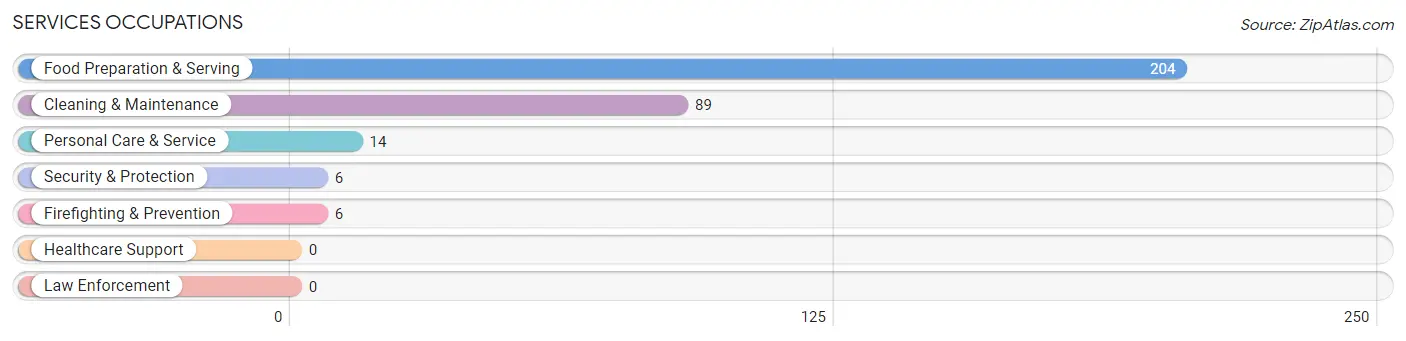
Services Occupations
The most common Services occupations in North Crossett are Food Preparation & Serving (204 | 20.5%), Cleaning & Maintenance (89 | 8.9%), Personal Care & Service (14 | 1.4%), Security & Protection (6 | 0.6%), and Firefighting & Prevention (6 | 0.6%).
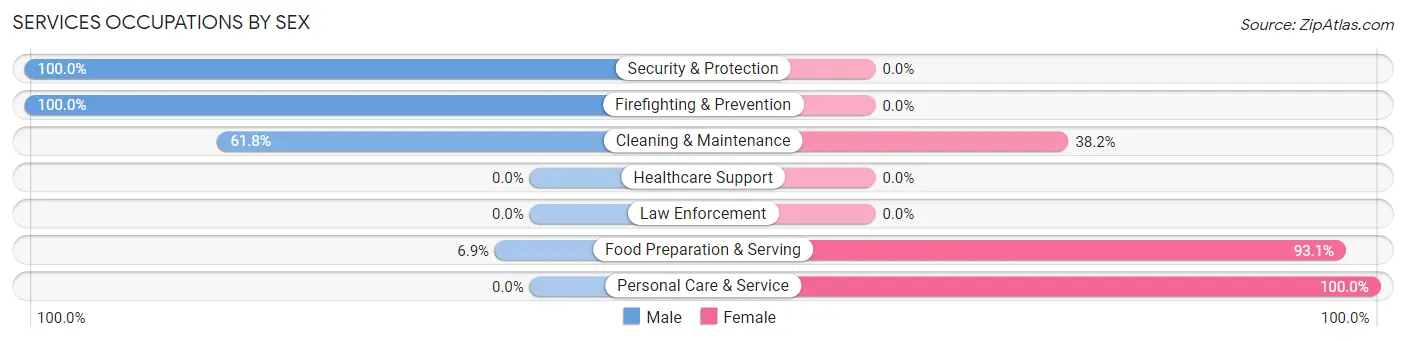
Services Occupations by Sex
Within the Services occupations in North Crossett, the most male-oriented occupations are Security & Protection (100.0%), Firefighting & Prevention (100.0%), and Cleaning & Maintenance (61.8%), while the most female-oriented occupations are Personal Care & Service (100.0%), Food Preparation & Serving (93.1%), and Cleaning & Maintenance (38.2%).
| Occupation | Male | Female |
| Healthcare Support | 0 (0.0%) | 0 (0.0%) |
| Security & Protection | 6 (100.0%) | 0 (0.0%) |
| Firefighting & Prevention | 6 (100.0%) | 0 (0.0%) |
| Law Enforcement | 0 (0.0%) | 0 (0.0%) |
| Food Preparation & Serving | 14 (6.9%) | 190 (93.1%) |
| Cleaning & Maintenance | 55 (61.8%) | 34 (38.2%) |
| Personal Care & Service | 0 (0.0%) | 14 (100.0%) |
| Total (Category) | 75 (24.0%) | 238 (76.0%) |
| Total (Overall) | 433 (43.6%) | 561 (56.4%) |
Sales and Office Occupations
The most common Sales and Office occupations in North Crossett are Sales & Related (79 | 8.0%), and Office & Administration (62 | 6.2%).
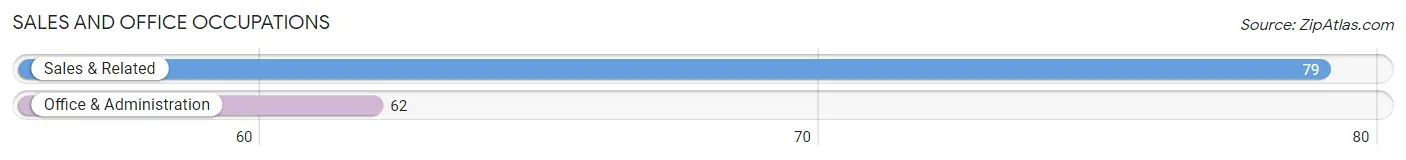
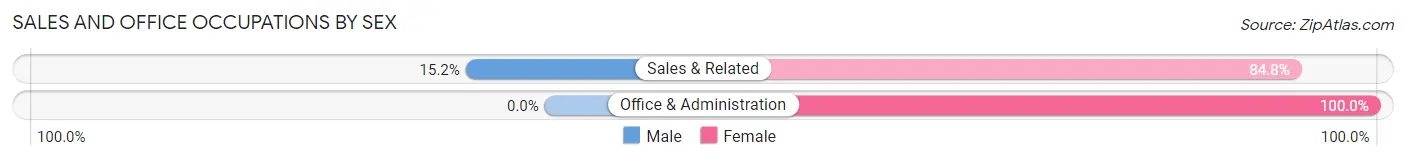
Sales and Office Occupations by Sex
| Occupation | Male | Female |
| Sales & Related | 12 (15.2%) | 67 (84.8%) |
| Office & Administration | 0 (0.0%) | 62 (100.0%) |
| Total (Category) | 12 (8.5%) | 129 (91.5%) |
| Total (Overall) | 433 (43.6%) | 561 (56.4%) |
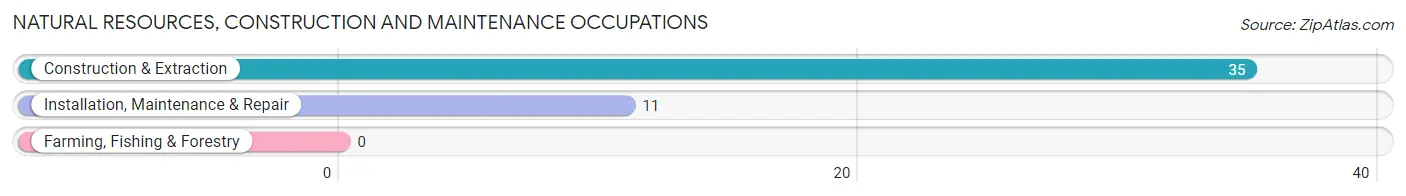
Natural Resources, Construction and Maintenance Occupations
The most common Natural Resources, Construction and Maintenance occupations in North Crossett are Construction & Extraction (35 | 3.5%), and Installation, Maintenance & Repair (11 | 1.1%).
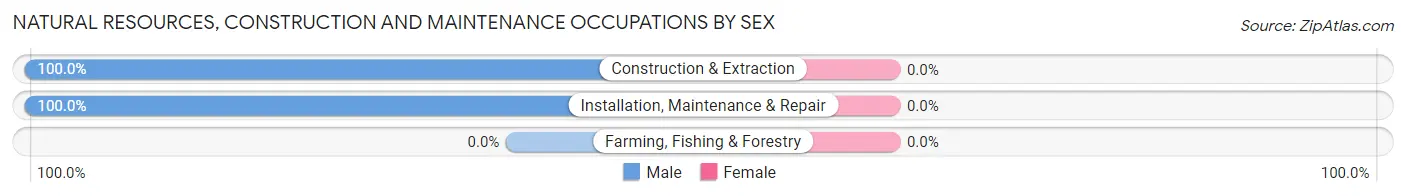
Natural Resources, Construction and Maintenance Occupations by Sex
| Occupation | Male | Female |
| Farming, Fishing & Forestry | 0 (0.0%) | 0 (0.0%) |
| Construction & Extraction | 35 (100.0%) | 0 (0.0%) |
| Installation, Maintenance & Repair | 11 (100.0%) | 0 (0.0%) |
| Total (Category) | 46 (100.0%) | 0 (0.0%) |
| Total (Overall) | 433 (43.6%) | 561 (56.4%) |
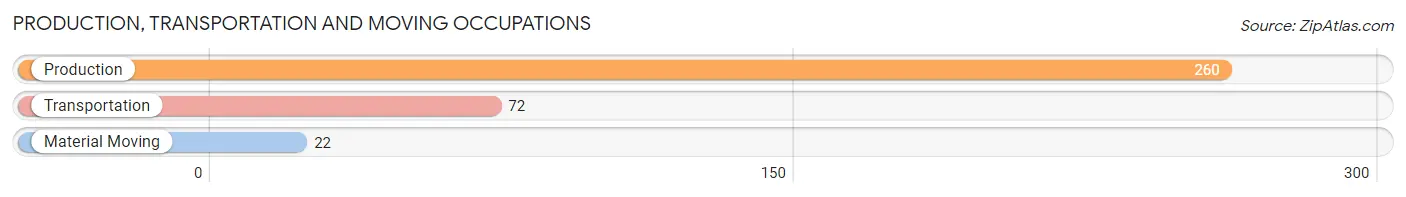
Production, Transportation and Moving Occupations
The most common Production, Transportation and Moving occupations in North Crossett are Production (260 | 26.2%), Transportation (72 | 7.2%), and Material Moving (22 | 2.2%).
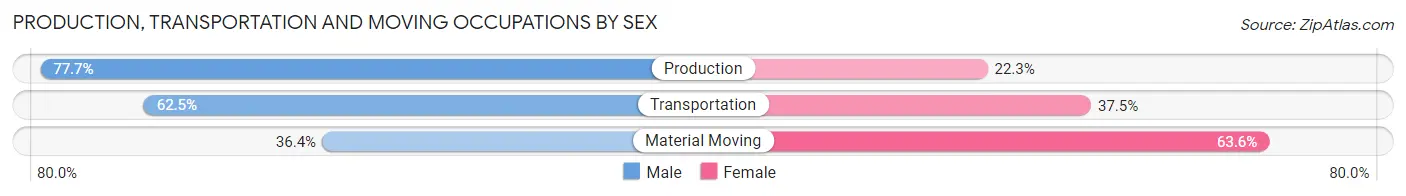
Production, Transportation and Moving Occupations by Sex
| Occupation | Male | Female |
| Production | 202 (77.7%) | 58 (22.3%) |
| Transportation | 45 (62.5%) | 27 (37.5%) |
| Material Moving | 8 (36.4%) | 14 (63.6%) |
| Total (Category) | 255 (72.0%) | 99 (28.0%) |
| Total (Overall) | 433 (43.6%) | 561 (56.4%) |
Employment Industries by Sex in North Crossett
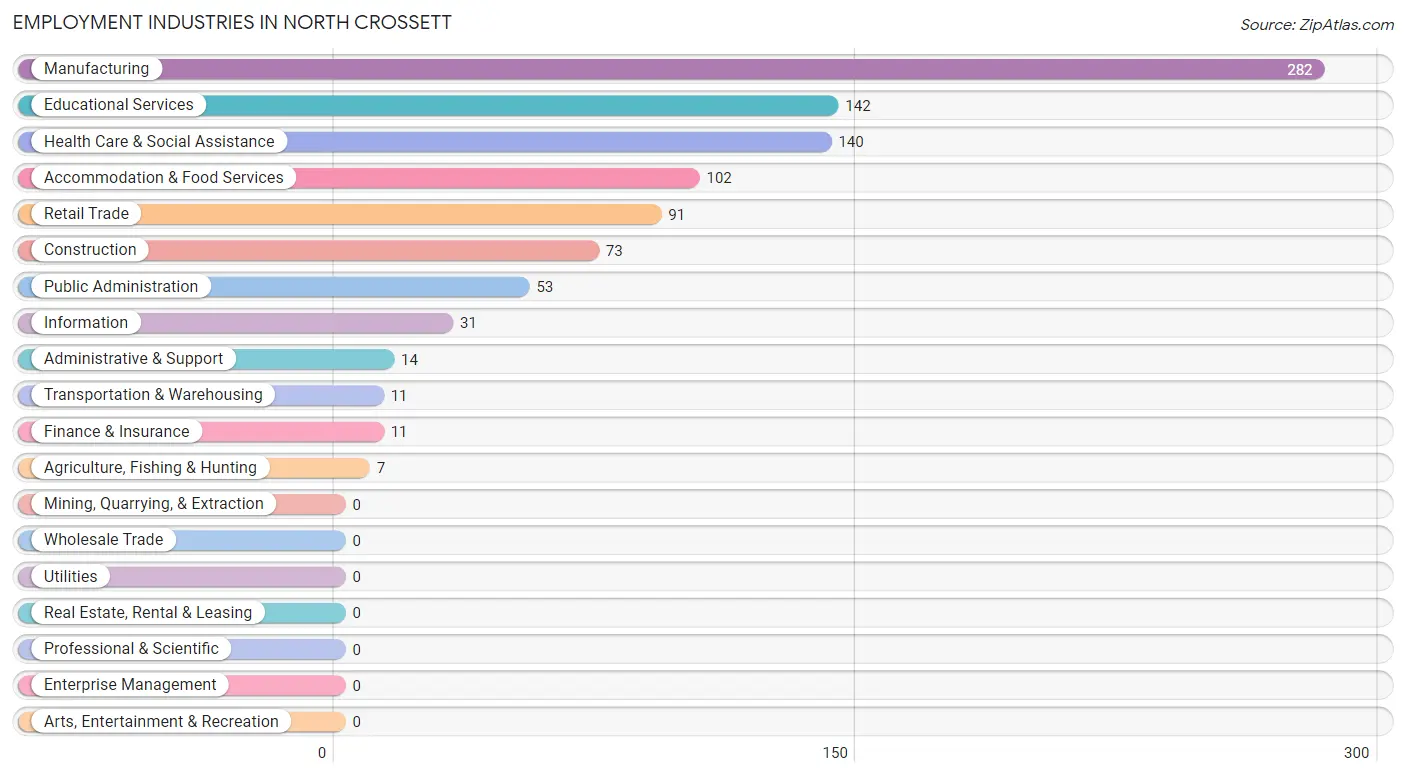
Employment Industries in North Crossett
The major employment industries in North Crossett include Manufacturing (282 | 28.4%), Educational Services (142 | 14.3%), Health Care & Social Assistance (140 | 14.1%), Accommodation & Food Services (102 | 10.3%), and Retail Trade (91 | 9.1%).
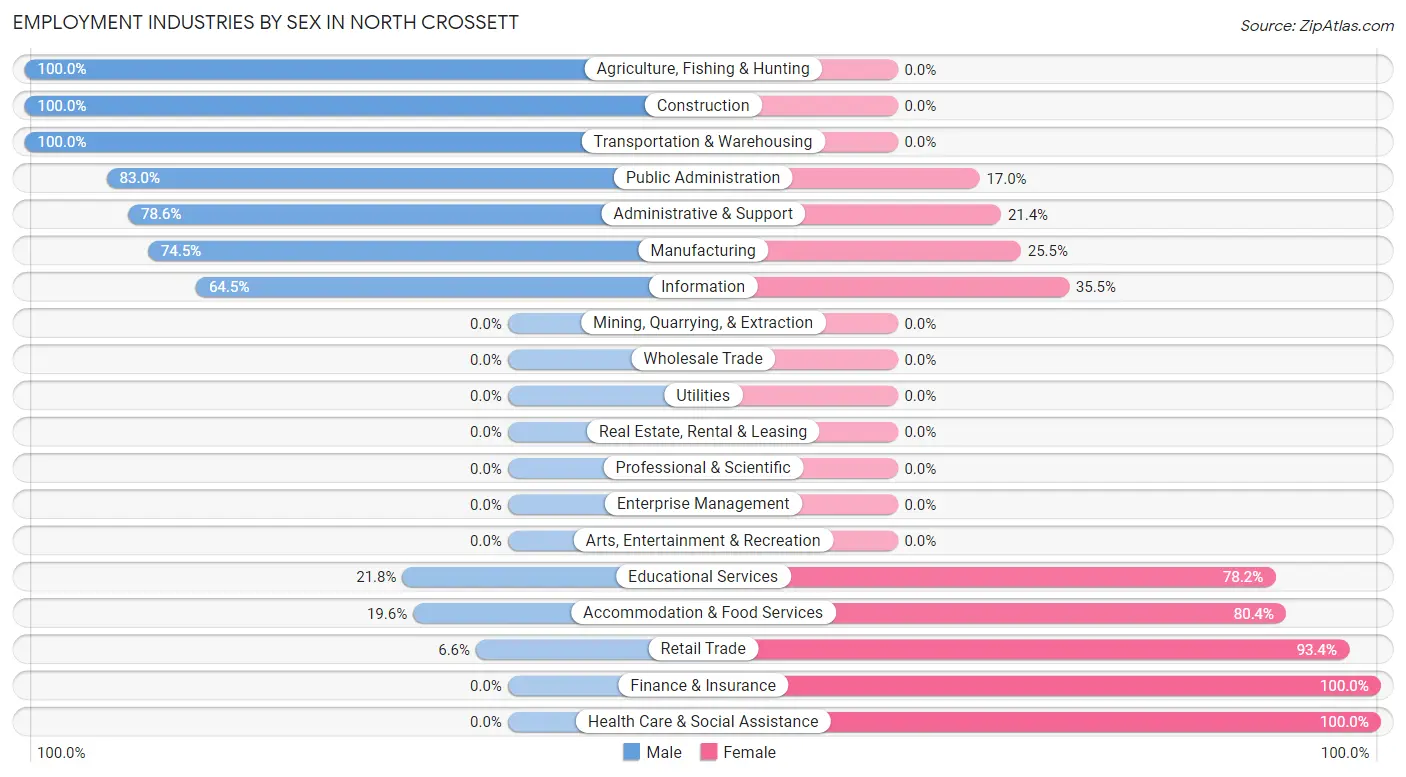
Employment Industries by Sex in North Crossett
The North Crossett industries that see more men than women are Agriculture, Fishing & Hunting (100.0%), Construction (100.0%), and Transportation & Warehousing (100.0%), whereas the industries that tend to have a higher number of women are Finance & Insurance (100.0%), Health Care & Social Assistance (100.0%), and Retail Trade (93.4%).
| Industry | Male | Female |
| Agriculture, Fishing & Hunting | 7 (100.0%) | 0 (0.0%) |
| Mining, Quarrying, & Extraction | 0 (0.0%) | 0 (0.0%) |
| Construction | 73 (100.0%) | 0 (0.0%) |
| Manufacturing | 210 (74.5%) | 72 (25.5%) |
| Wholesale Trade | 0 (0.0%) | 0 (0.0%) |
| Retail Trade | 6 (6.6%) | 85 (93.4%) |
| Transportation & Warehousing | 11 (100.0%) | 0 (0.0%) |
| Utilities | 0 (0.0%) | 0 (0.0%) |
| Information | 20 (64.5%) | 11 (35.5%) |
| Finance & Insurance | 0 (0.0%) | 11 (100.0%) |
| Real Estate, Rental & Leasing | 0 (0.0%) | 0 (0.0%) |
| Professional & Scientific | 0 (0.0%) | 0 (0.0%) |
| Enterprise Management | 0 (0.0%) | 0 (0.0%) |
| Administrative & Support | 11 (78.6%) | 3 (21.4%) |
| Educational Services | 31 (21.8%) | 111 (78.2%) |
| Health Care & Social Assistance | 0 (0.0%) | 140 (100.0%) |
| Arts, Entertainment & Recreation | 0 (0.0%) | 0 (0.0%) |
| Accommodation & Food Services | 20 (19.6%) | 82 (80.4%) |
| Public Administration | 44 (83.0%) | 9 (17.0%) |
| Total | 433 (43.6%) | 561 (56.4%) |
Education in North Crossett
School Enrollment in North Crossett
The most common levels of schooling among the 582 students in North Crossett are middle school (163 | 28.0%), elementary school (159 | 27.3%), and high school (89 | 15.3%).
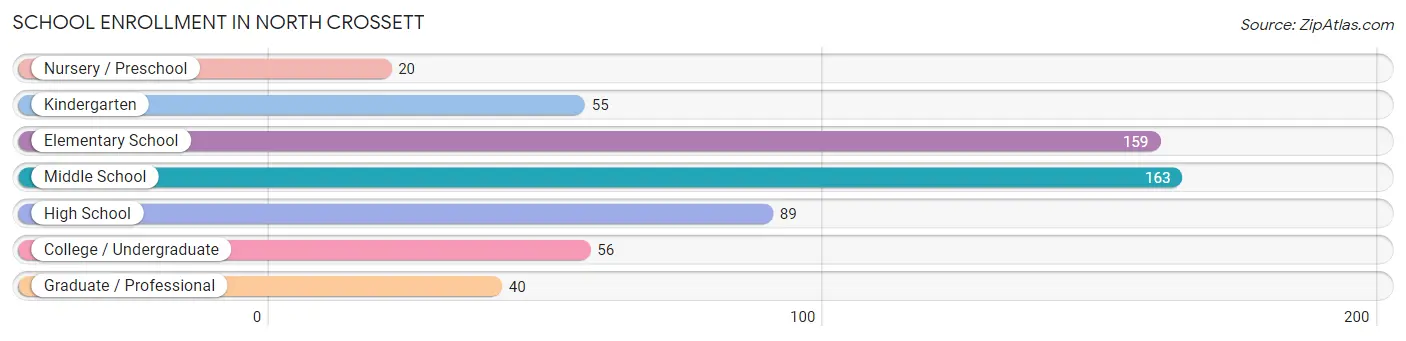
| School Level | # Students | % Students |
| Nursery / Preschool | 20 | 3.4% |
| Kindergarten | 55 | 9.5% |
| Elementary School | 159 | 27.3% |
| Middle School | 163 | 28.0% |
| High School | 89 | 15.3% |
| College / Undergraduate | 56 | 9.6% |
| Graduate / Professional | 40 | 6.9% |
| Total | 582 | 100.0% |
School Enrollment by Age by Funding Source in North Crossett
Out of a total of 582 students who are enrolled in schools in North Crossett, 38 (6.5%) attend a private institution, while the remaining 544 (93.5%) are enrolled in public schools. The age group of 20 to 24 year olds has the highest likelihood of being enrolled in private schools, with 38 (76.0% in the age bracket) enrolled. Conversely, the age group of 3 to 4 year olds has the lowest likelihood of being enrolled in a private school, with 9 (100.0% in the age bracket) attending a public institution.
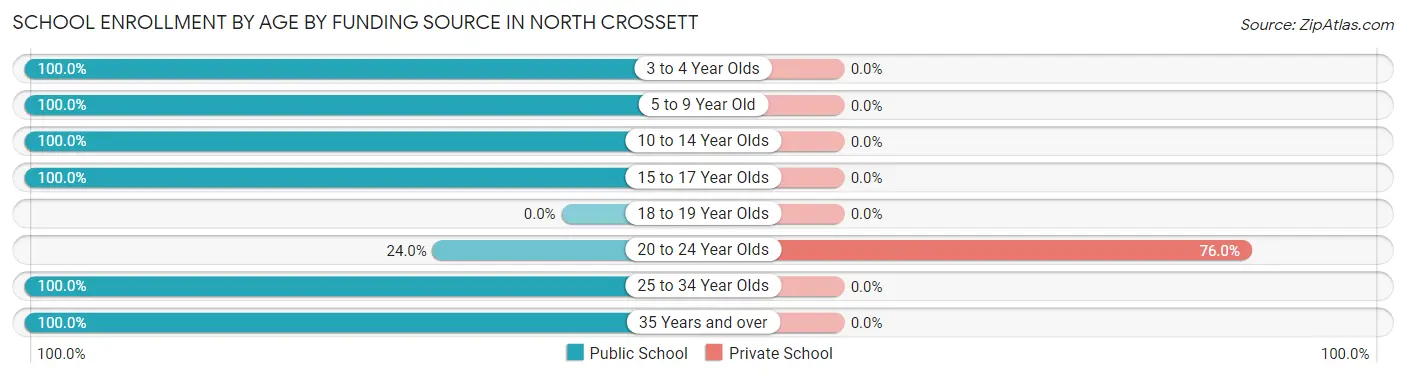
| Age Bracket | Public School | Private School |
| 3 to 4 Year Olds | 9 (100.0%) | 0 (0.0%) |
| 5 to 9 Year Old | 192 (100.0%) | 0 (0.0%) |
| 10 to 14 Year Olds | 169 (100.0%) | 0 (0.0%) |
| 15 to 17 Year Olds | 107 (100.0%) | 0 (0.0%) |
| 18 to 19 Year Olds | 0 (0.0%) | 0 (0.0%) |
| 20 to 24 Year Olds | 12 (24.0%) | 38 (76.0%) |
| 25 to 34 Year Olds | 42 (100.0%) | 0 (0.0%) |
| 35 Years and over | 13 (100.0%) | 0 (0.0%) |
| Total | 544 (93.5%) | 38 (6.5%) |
Educational Attainment by Field of Study in North Crossett
Business (46 | 43.4%), education (32 | 30.2%), liberal arts & history (11 | 10.4%), physical & health sciences (10 | 9.4%), and science & technology (7 | 6.6%) are the most common fields of study among 106 individuals in North Crossett who have obtained a bachelor's degree or higher.
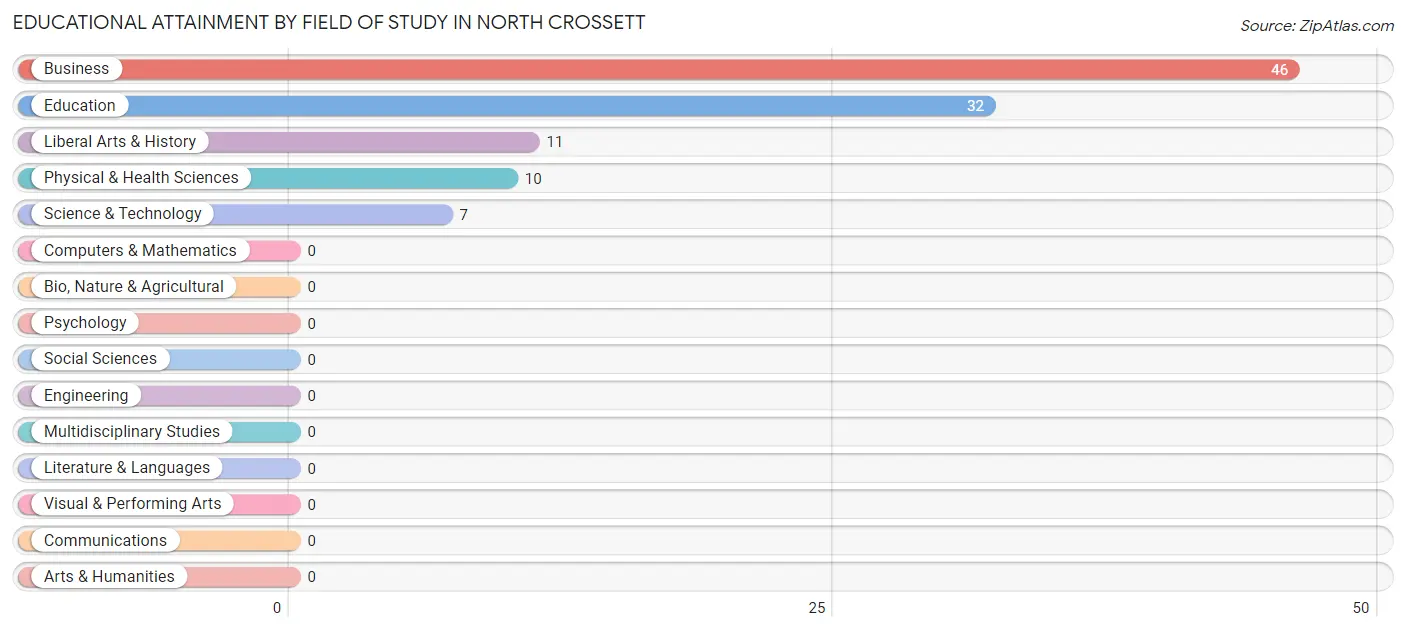
| Field of Study | # Graduates | % Graduates |
| Computers & Mathematics | 0 | 0.0% |
| Bio, Nature & Agricultural | 0 | 0.0% |
| Physical & Health Sciences | 10 | 9.4% |
| Psychology | 0 | 0.0% |
| Social Sciences | 0 | 0.0% |
| Engineering | 0 | 0.0% |
| Multidisciplinary Studies | 0 | 0.0% |
| Science & Technology | 7 | 6.6% |
| Business | 46 | 43.4% |
| Education | 32 | 30.2% |
| Literature & Languages | 0 | 0.0% |
| Liberal Arts & History | 11 | 10.4% |
| Visual & Performing Arts | 0 | 0.0% |
| Communications | 0 | 0.0% |
| Arts & Humanities | 0 | 0.0% |
| Total | 106 | 100.0% |
Transportation & Commute in North Crossett
Vehicle Availability by Sex in North Crossett
The most prevalent vehicle ownership categories in North Crossett are males with 1 vehicle (155, accounting for 35.8%) and females with 1 vehicle (126, making up 28.3%).
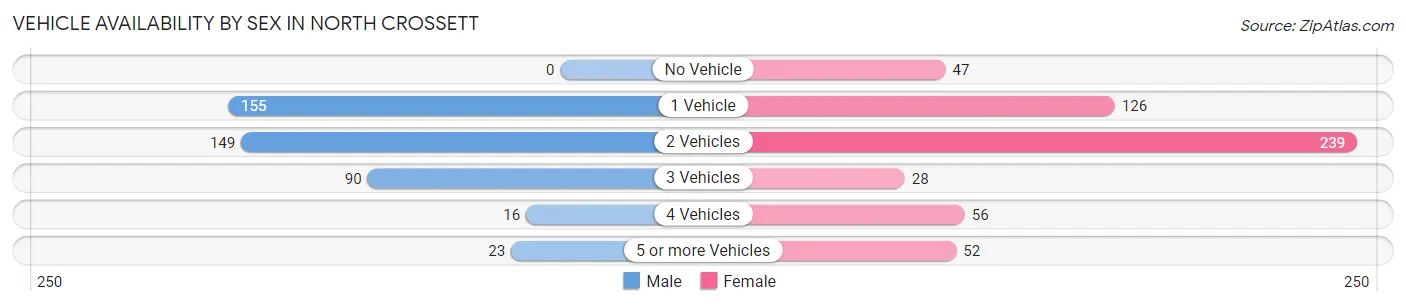
| Vehicles Available | Male | Female |
| No Vehicle | 0 (0.0%) | 47 (8.6%) |
| 1 Vehicle | 155 (35.8%) | 126 (23.0%) |
| 2 Vehicles | 149 (34.4%) | 239 (43.6%) |
| 3 Vehicles | 90 (20.8%) | 28 (5.1%) |
| 4 Vehicles | 16 (3.7%) | 56 (10.2%) |
| 5 or more Vehicles | 23 (5.3%) | 52 (9.5%) |
| Total | 433 (100.0%) | 548 (100.0%) |
Commute Time in North Crossett
The most frequently occuring commute durations in North Crossett are 5 to 9 minutes (315 commuters, 33.3%), 10 to 14 minutes (262 commuters, 27.7%), and 15 to 19 minutes (144 commuters, 15.2%).
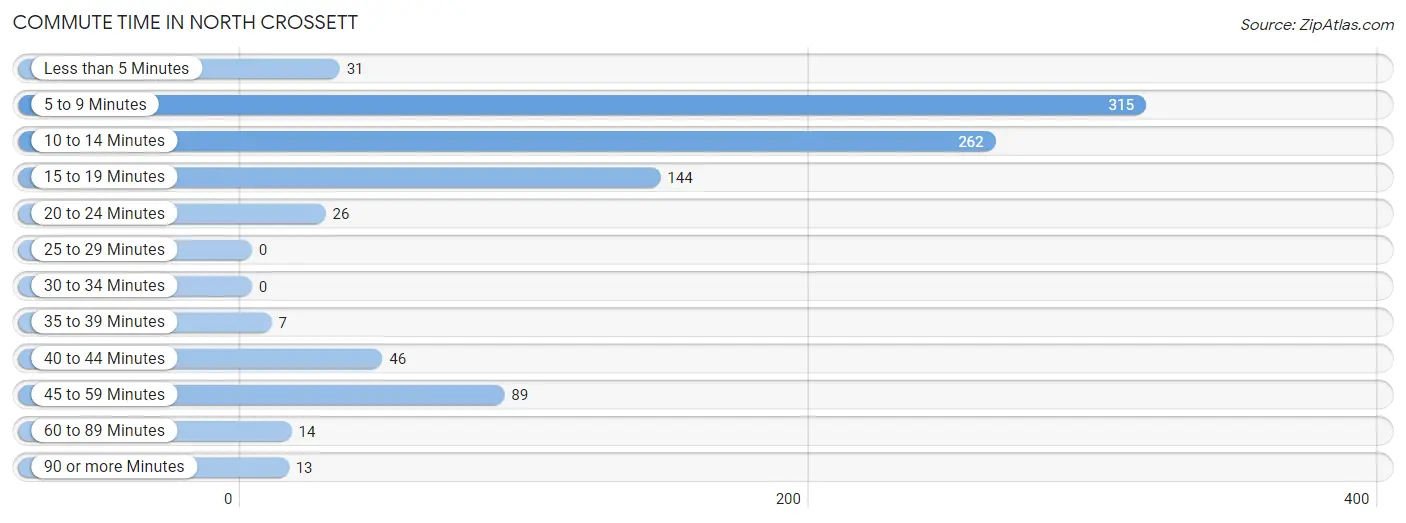
| Commute Time | # Commuters | % Commuters |
| Less than 5 Minutes | 31 | 3.3% |
| 5 to 9 Minutes | 315 | 33.3% |
| 10 to 14 Minutes | 262 | 27.7% |
| 15 to 19 Minutes | 144 | 15.2% |
| 20 to 24 Minutes | 26 | 2.8% |
| 25 to 29 Minutes | 0 | 0.0% |
| 30 to 34 Minutes | 0 | 0.0% |
| 35 to 39 Minutes | 7 | 0.7% |
| 40 to 44 Minutes | 46 | 4.9% |
| 45 to 59 Minutes | 89 | 9.4% |
| 60 to 89 Minutes | 14 | 1.5% |
| 90 or more Minutes | 13 | 1.4% |
Commute Time by Sex in North Crossett
The most common commute times in North Crossett are 10 to 14 minutes (150 commuters, 34.6%) for males and 5 to 9 minutes (207 commuters, 40.3%) for females.
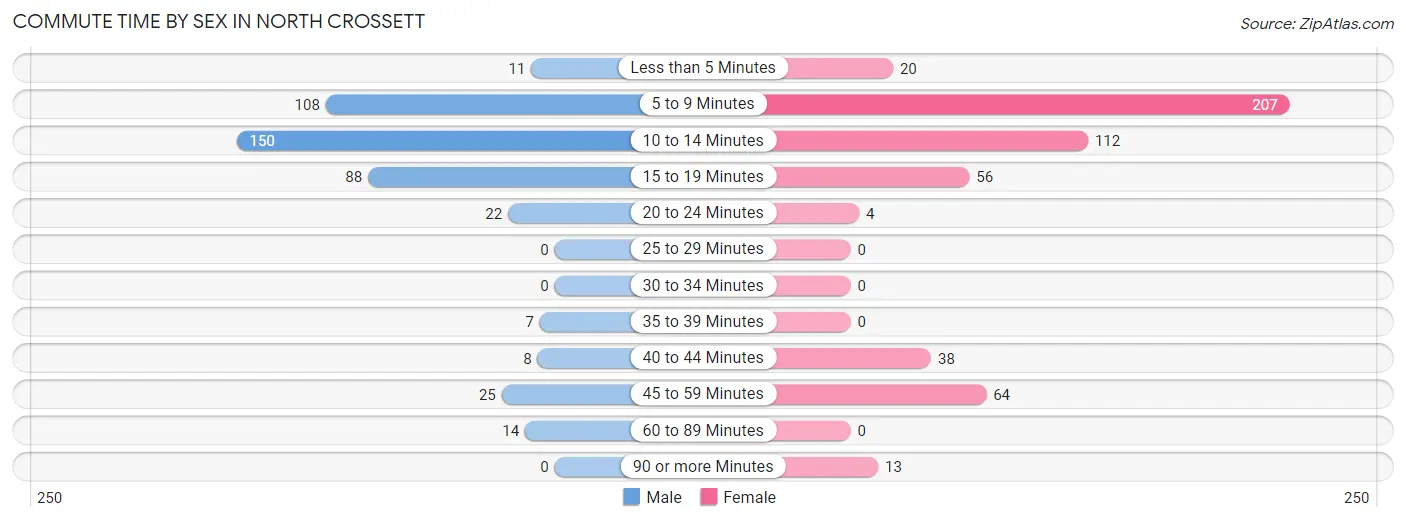
| Commute Time | Male | Female |
| Less than 5 Minutes | 11 (2.5%) | 20 (3.9%) |
| 5 to 9 Minutes | 108 (24.9%) | 207 (40.3%) |
| 10 to 14 Minutes | 150 (34.6%) | 112 (21.8%) |
| 15 to 19 Minutes | 88 (20.3%) | 56 (10.9%) |
| 20 to 24 Minutes | 22 (5.1%) | 4 (0.8%) |
| 25 to 29 Minutes | 0 (0.0%) | 0 (0.0%) |
| 30 to 34 Minutes | 0 (0.0%) | 0 (0.0%) |
| 35 to 39 Minutes | 7 (1.6%) | 0 (0.0%) |
| 40 to 44 Minutes | 8 (1.8%) | 38 (7.4%) |
| 45 to 59 Minutes | 25 (5.8%) | 64 (12.4%) |
| 60 to 89 Minutes | 14 (3.2%) | 0 (0.0%) |
| 90 or more Minutes | 0 (0.0%) | 13 (2.5%) |
Time of Departure to Work by Sex in North Crossett
The most frequent times of departure to work in North Crossett are 6:00 AM to 6:29 AM (103, 23.8%) for males and 6:00 AM to 6:29 AM (101, 19.7%) for females.
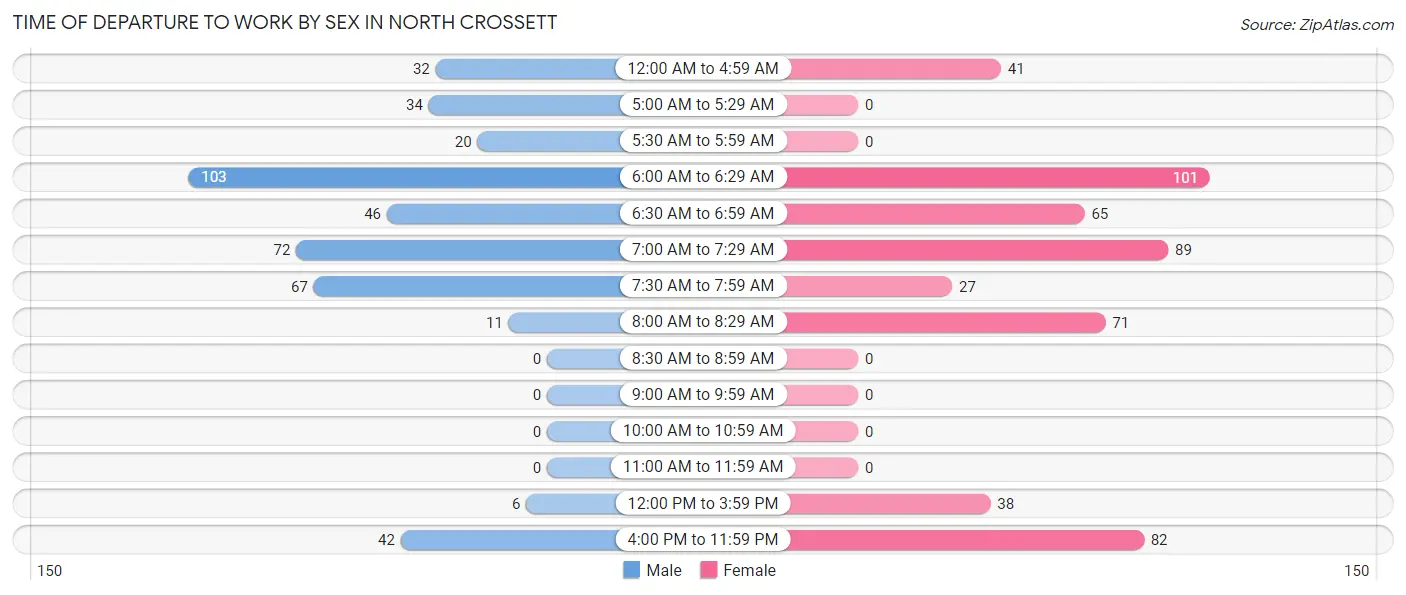
| Time of Departure | Male | Female |
| 12:00 AM to 4:59 AM | 32 (7.4%) | 41 (8.0%) |
| 5:00 AM to 5:29 AM | 34 (7.9%) | 0 (0.0%) |
| 5:30 AM to 5:59 AM | 20 (4.6%) | 0 (0.0%) |
| 6:00 AM to 6:29 AM | 103 (23.8%) | 101 (19.7%) |
| 6:30 AM to 6:59 AM | 46 (10.6%) | 65 (12.7%) |
| 7:00 AM to 7:29 AM | 72 (16.6%) | 89 (17.3%) |
| 7:30 AM to 7:59 AM | 67 (15.5%) | 27 (5.2%) |
| 8:00 AM to 8:29 AM | 11 (2.5%) | 71 (13.8%) |
| 8:30 AM to 8:59 AM | 0 (0.0%) | 0 (0.0%) |
| 9:00 AM to 9:59 AM | 0 (0.0%) | 0 (0.0%) |
| 10:00 AM to 10:59 AM | 0 (0.0%) | 0 (0.0%) |
| 11:00 AM to 11:59 AM | 0 (0.0%) | 0 (0.0%) |
| 12:00 PM to 3:59 PM | 6 (1.4%) | 38 (7.4%) |
| 4:00 PM to 11:59 PM | 42 (9.7%) | 82 (16.0%) |
| Total | 433 (100.0%) | 514 (100.0%) |
Housing Occupancy in North Crossett
Occupancy by Ownership in North Crossett
Of the total 965 dwellings in North Crossett, owner-occupied units account for 671 (69.5%), while renter-occupied units make up 294 (30.5%).
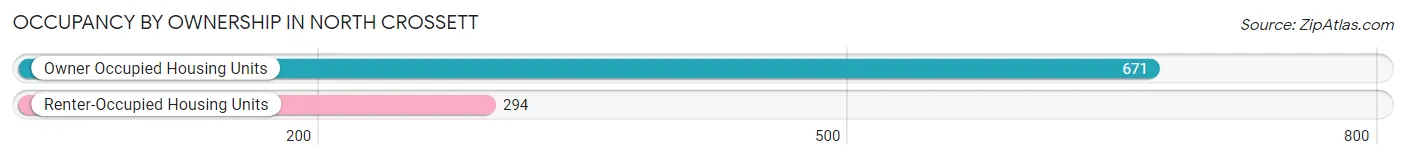
| Occupancy | # Housing Units | % Housing Units |
| Owner Occupied Housing Units | 671 | 69.5% |
| Renter-Occupied Housing Units | 294 | 30.5% |
| Total Occupied Housing Units | 965 | 100.0% |
Occupancy by Household Size in North Crossett
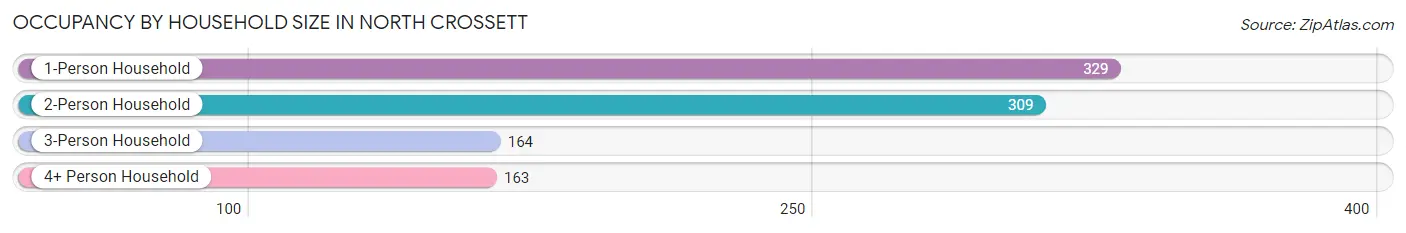
| Household Size | # Housing Units | % Housing Units |
| 1-Person Household | 329 | 34.1% |
| 2-Person Household | 309 | 32.0% |
| 3-Person Household | 164 | 17.0% |
| 4+ Person Household | 163 | 16.9% |
| Total Housing Units | 965 | 100.0% |
Occupancy by Ownership by Household Size in North Crossett
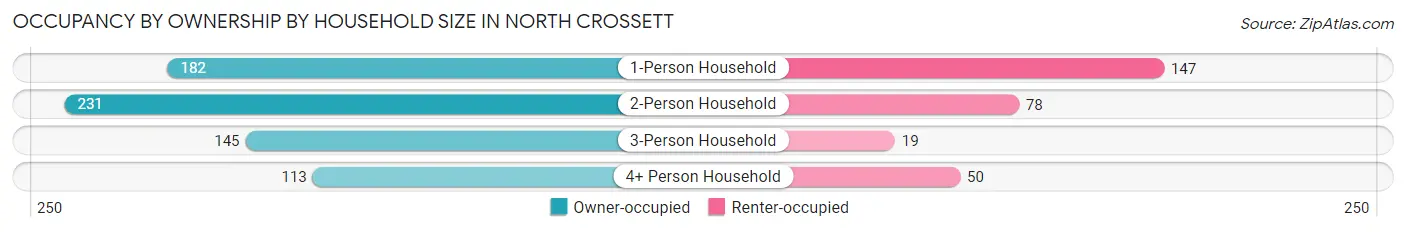
| Household Size | Owner-occupied | Renter-occupied |
| 1-Person Household | 182 (55.3%) | 147 (44.7%) |
| 2-Person Household | 231 (74.8%) | 78 (25.2%) |
| 3-Person Household | 145 (88.4%) | 19 (11.6%) |
| 4+ Person Household | 113 (69.3%) | 50 (30.7%) |
| Total Housing Units | 671 (69.5%) | 294 (30.5%) |
Occupancy by Educational Attainment in North Crossett
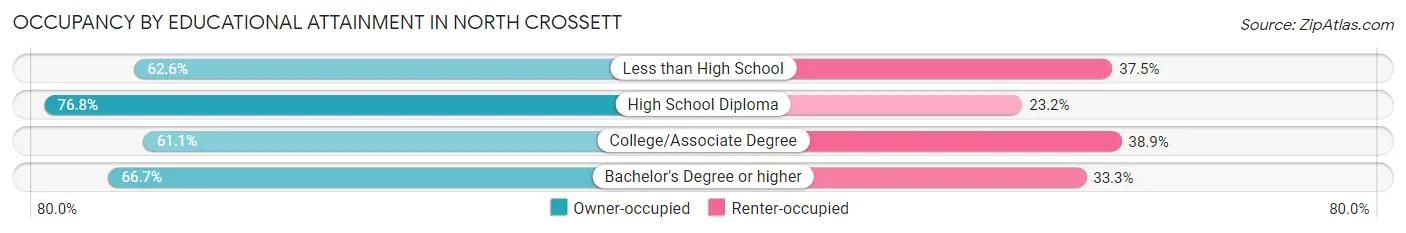
| Household Size | Owner-occupied | Renter-occupied |
| Less than High School | 152 (62.5%) | 91 (37.4%) |
| High School Diploma | 371 (76.8%) | 112 (23.2%) |
| College/Associate Degree | 124 (61.1%) | 79 (38.9%) |
| Bachelor's Degree or higher | 24 (66.7%) | 12 (33.3%) |
Occupancy by Age of Householder in North Crossett
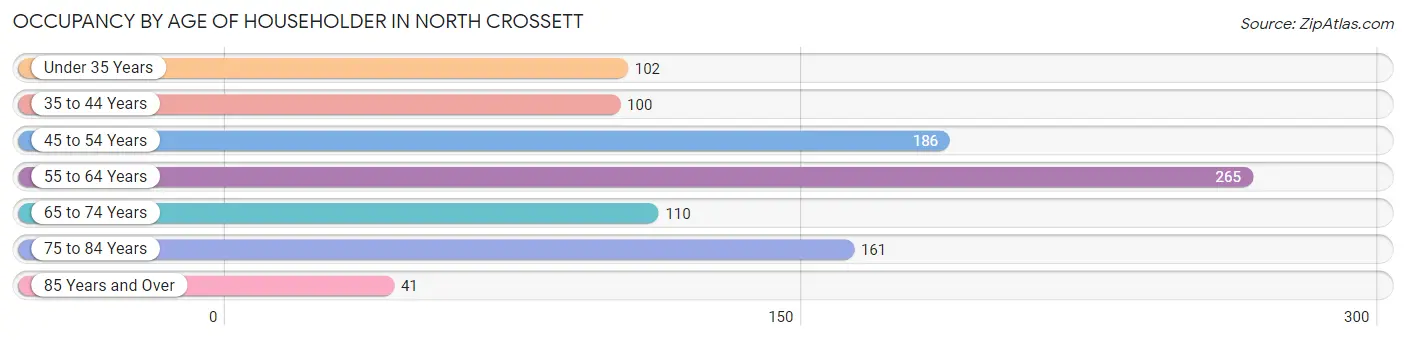
| Age Bracket | # Households | % Households |
| Under 35 Years | 102 | 10.6% |
| 35 to 44 Years | 100 | 10.4% |
| 45 to 54 Years | 186 | 19.3% |
| 55 to 64 Years | 265 | 27.5% |
| 65 to 74 Years | 110 | 11.4% |
| 75 to 84 Years | 161 | 16.7% |
| 85 Years and Over | 41 | 4.3% |
| Total | 965 | 100.0% |
Housing Finances in North Crossett
Median Income by Occupancy in North Crossett
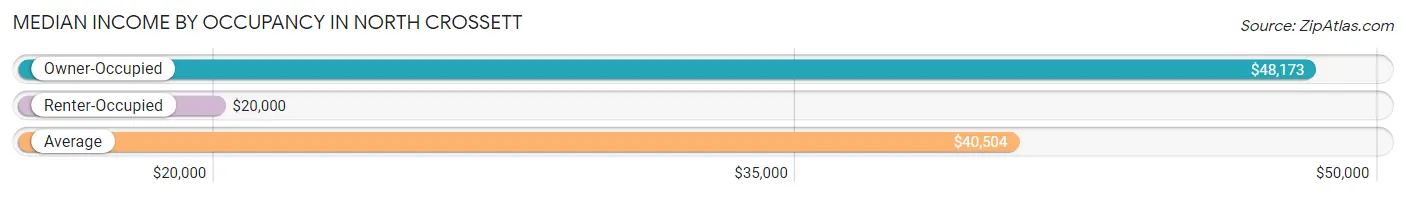
| Occupancy Type | # Households | Median Income |
| Owner-Occupied | 671 (69.5%) | $48,173 |
| Renter-Occupied | 294 (30.5%) | $20,000 |
| Average | 965 (100.0%) | $40,504 |
Occupancy by Householder Income Bracket in North Crossett
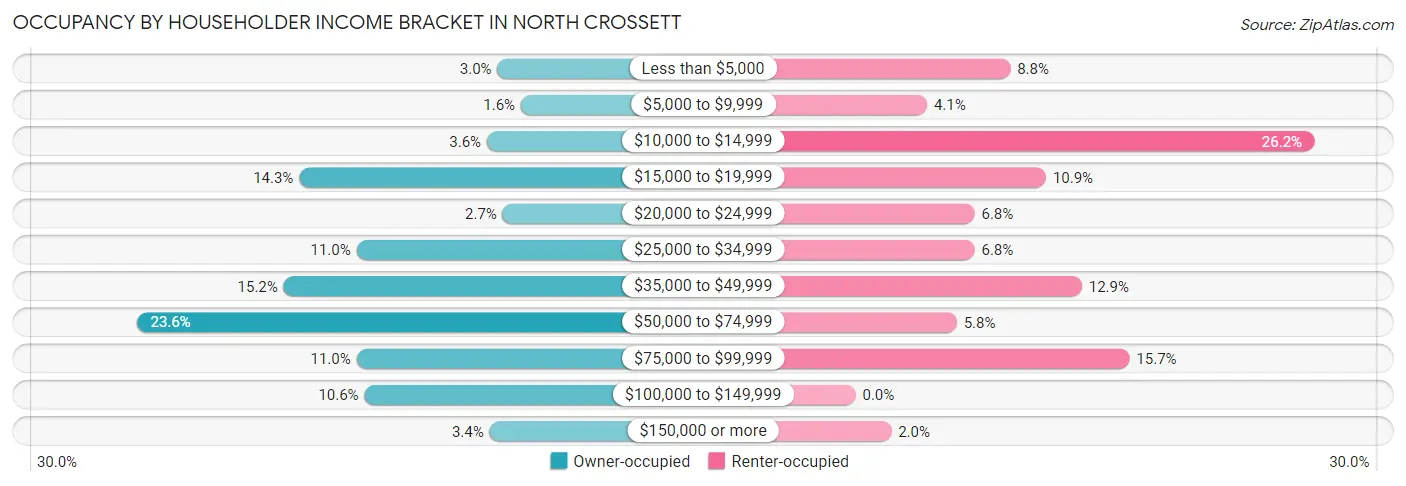
| Income Bracket | Owner-occupied | Renter-occupied |
| Less than $5,000 | 20 (3.0%) | 26 (8.8%) |
| $5,000 to $9,999 | 11 (1.6%) | 12 (4.1%) |
| $10,000 to $14,999 | 24 (3.6%) | 77 (26.2%) |
| $15,000 to $19,999 | 96 (14.3%) | 32 (10.9%) |
| $20,000 to $24,999 | 18 (2.7%) | 20 (6.8%) |
| $25,000 to $34,999 | 74 (11.0%) | 20 (6.8%) |
| $35,000 to $49,999 | 102 (15.2%) | 38 (12.9%) |
| $50,000 to $74,999 | 158 (23.5%) | 17 (5.8%) |
| $75,000 to $99,999 | 74 (11.0%) | 46 (15.7%) |
| $100,000 to $149,999 | 71 (10.6%) | 0 (0.0%) |
| $150,000 or more | 23 (3.4%) | 6 (2.0%) |
| Total | 671 (100.0%) | 294 (100.0%) |
Monthly Housing Cost Tiers in North Crossett
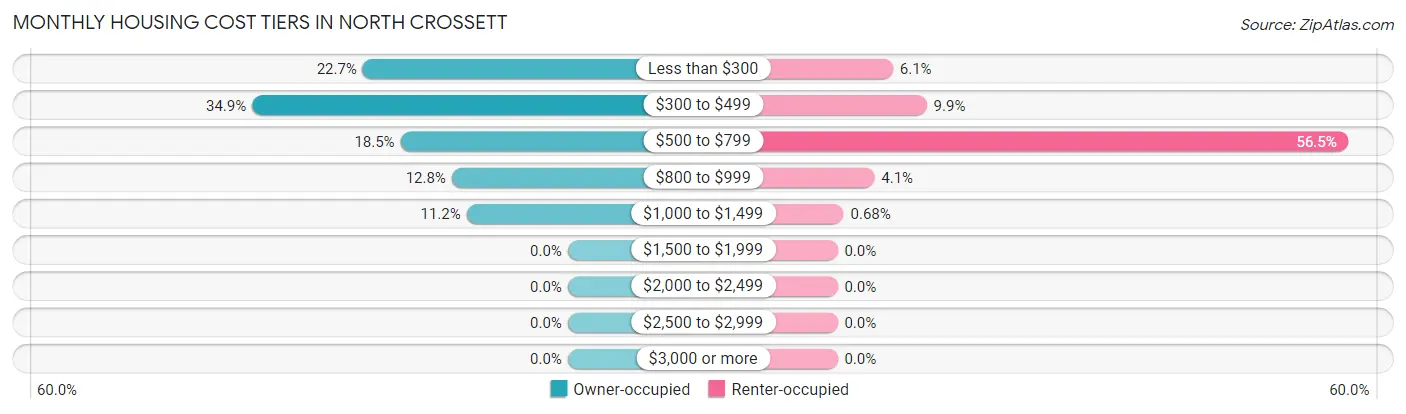
| Monthly Cost | Owner-occupied | Renter-occupied |
| Less than $300 | 152 (22.7%) | 18 (6.1%) |
| $300 to $499 | 234 (34.9%) | 29 (9.9%) |
| $500 to $799 | 124 (18.5%) | 166 (56.5%) |
| $800 to $999 | 86 (12.8%) | 12 (4.1%) |
| $1,000 to $1,499 | 75 (11.2%) | 2 (0.7%) |
| $1,500 to $1,999 | 0 (0.0%) | 0 (0.0%) |
| $2,000 to $2,499 | 0 (0.0%) | 0 (0.0%) |
| $2,500 to $2,999 | 0 (0.0%) | 0 (0.0%) |
| $3,000 or more | 0 (0.0%) | 0 (0.0%) |
| Total | 671 (100.0%) | 294 (100.0%) |
Physical Housing Characteristics in North Crossett
Housing Structures in North Crossett
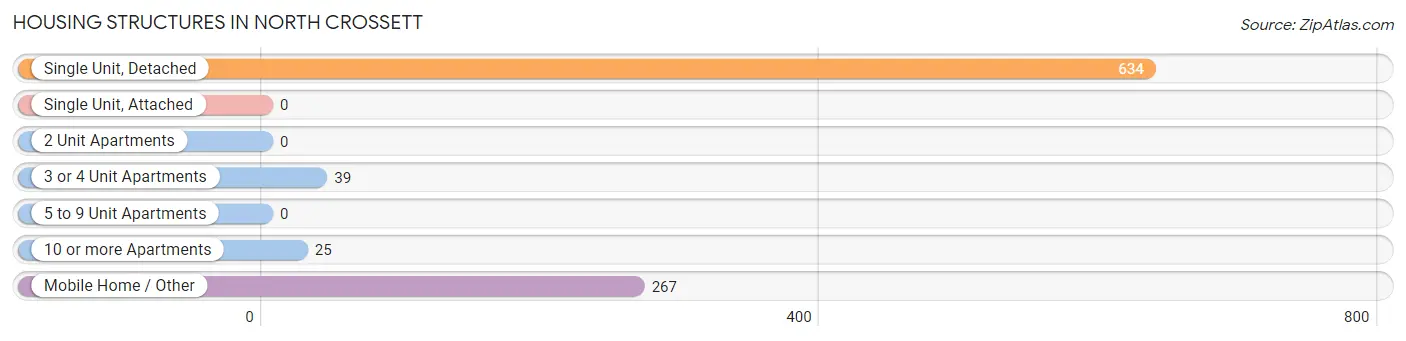
| Structure Type | # Housing Units | % Housing Units |
| Single Unit, Detached | 634 | 65.7% |
| Single Unit, Attached | 0 | 0.0% |
| 2 Unit Apartments | 0 | 0.0% |
| 3 or 4 Unit Apartments | 39 | 4.0% |
| 5 to 9 Unit Apartments | 0 | 0.0% |
| 10 or more Apartments | 25 | 2.6% |
| Mobile Home / Other | 267 | 27.7% |
| Total | 965 | 100.0% |
Housing Structures by Occupancy in North Crossett
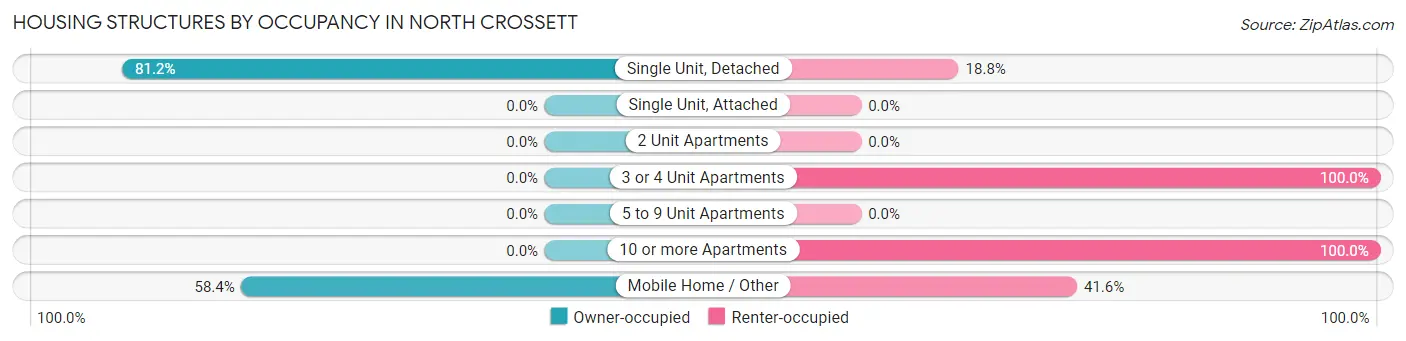
| Structure Type | Owner-occupied | Renter-occupied |
| Single Unit, Detached | 515 (81.2%) | 119 (18.8%) |
| Single Unit, Attached | 0 (0.0%) | 0 (0.0%) |
| 2 Unit Apartments | 0 (0.0%) | 0 (0.0%) |
| 3 or 4 Unit Apartments | 0 (0.0%) | 39 (100.0%) |
| 5 to 9 Unit Apartments | 0 (0.0%) | 0 (0.0%) |
| 10 or more Apartments | 0 (0.0%) | 25 (100.0%) |
| Mobile Home / Other | 156 (58.4%) | 111 (41.6%) |
| Total | 671 (69.5%) | 294 (30.5%) |
Housing Structures by Number of Rooms in North Crossett
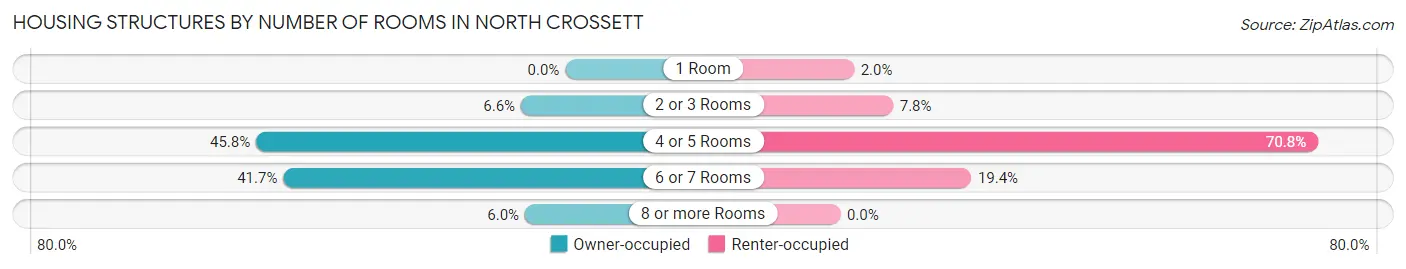
| Number of Rooms | Owner-occupied | Renter-occupied |
| 1 Room | 0 (0.0%) | 6 (2.0%) |
| 2 or 3 Rooms | 44 (6.6%) | 23 (7.8%) |
| 4 or 5 Rooms | 307 (45.8%) | 208 (70.8%) |
| 6 or 7 Rooms | 280 (41.7%) | 57 (19.4%) |
| 8 or more Rooms | 40 (6.0%) | 0 (0.0%) |
| Total | 671 (100.0%) | 294 (100.0%) |
Housing Structure by Heating Type in North Crossett
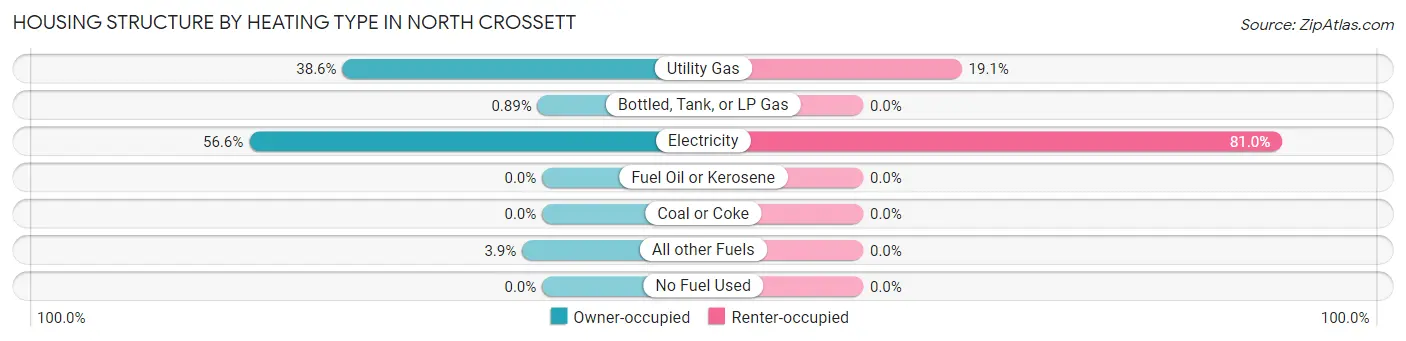
| Heating Type | Owner-occupied | Renter-occupied |
| Utility Gas | 259 (38.6%) | 56 (19.1%) |
| Bottled, Tank, or LP Gas | 6 (0.9%) | 0 (0.0%) |
| Electricity | 380 (56.6%) | 238 (80.9%) |
| Fuel Oil or Kerosene | 0 (0.0%) | 0 (0.0%) |
| Coal or Coke | 0 (0.0%) | 0 (0.0%) |
| All other Fuels | 26 (3.9%) | 0 (0.0%) |
| No Fuel Used | 0 (0.0%) | 0 (0.0%) |
| Total | 671 (100.0%) | 294 (100.0%) |
Household Vehicle Usage in North Crossett
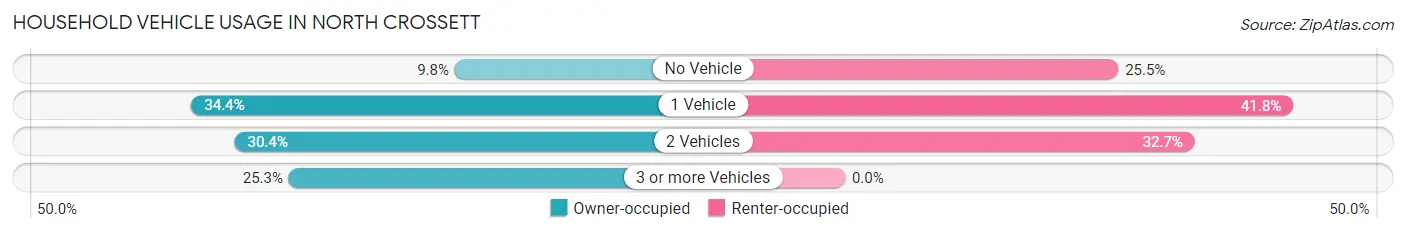
| Vehicles per Household | Owner-occupied | Renter-occupied |
| No Vehicle | 66 (9.8%) | 75 (25.5%) |
| 1 Vehicle | 231 (34.4%) | 123 (41.8%) |
| 2 Vehicles | 204 (30.4%) | 96 (32.7%) |
| 3 or more Vehicles | 170 (25.3%) | 0 (0.0%) |
| Total | 671 (100.0%) | 294 (100.0%) |
Real Estate & Mortgages in North Crossett
Real Estate and Mortgage Overview in North Crossett
| Characteristic | Without Mortgage | With Mortgage |
| Housing Units | 446 | 225 |
| Median Property Value | $55,300 | $83,600 |
| Median Household Income | $39,444 | $0 |
| Monthly Housing Costs | $354 | $0 |
| Real Estate Taxes | $436 | $32 |
Property Value by Mortgage Status in North Crossett
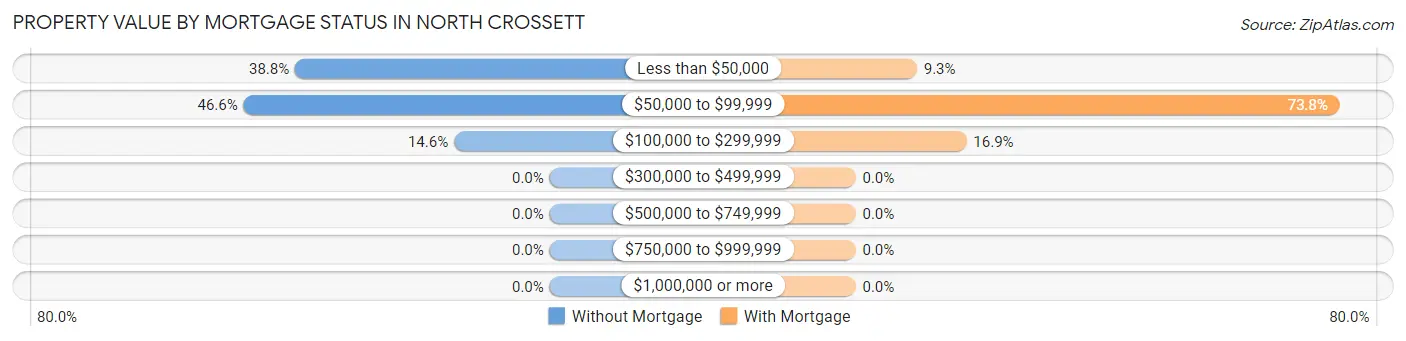
| Property Value | Without Mortgage | With Mortgage |
| Less than $50,000 | 173 (38.8%) | 21 (9.3%) |
| $50,000 to $99,999 | 208 (46.6%) | 166 (73.8%) |
| $100,000 to $299,999 | 65 (14.6%) | 38 (16.9%) |
| $300,000 to $499,999 | 0 (0.0%) | 0 (0.0%) |
| $500,000 to $749,999 | 0 (0.0%) | 0 (0.0%) |
| $750,000 to $999,999 | 0 (0.0%) | 0 (0.0%) |
| $1,000,000 or more | 0 (0.0%) | 0 (0.0%) |
| Total | 446 (100.0%) | 225 (100.0%) |
Household Income by Mortgage Status in North Crossett
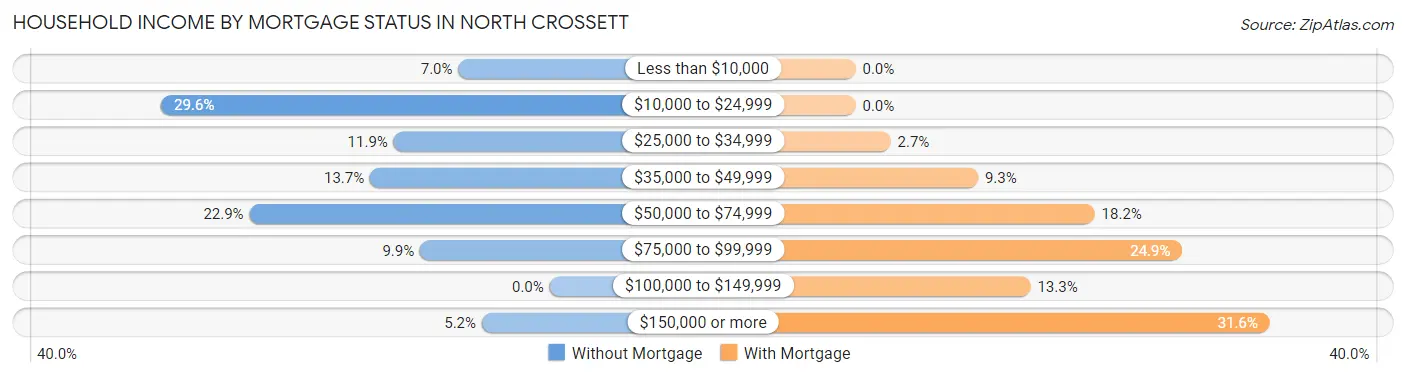
| Household Income | Without Mortgage | With Mortgage |
| Less than $10,000 | 31 (7.0%) | 0 (0.0%) |
| $10,000 to $24,999 | 132 (29.6%) | 0 (0.0%) |
| $25,000 to $34,999 | 53 (11.9%) | 6 (2.7%) |
| $35,000 to $49,999 | 61 (13.7%) | 21 (9.3%) |
| $50,000 to $74,999 | 102 (22.9%) | 41 (18.2%) |
| $75,000 to $99,999 | 44 (9.9%) | 56 (24.9%) |
| $100,000 to $149,999 | 0 (0.0%) | 30 (13.3%) |
| $150,000 or more | 23 (5.2%) | 71 (31.6%) |
| Total | 446 (100.0%) | 225 (100.0%) |
Property Value to Household Income Ratio in North Crossett
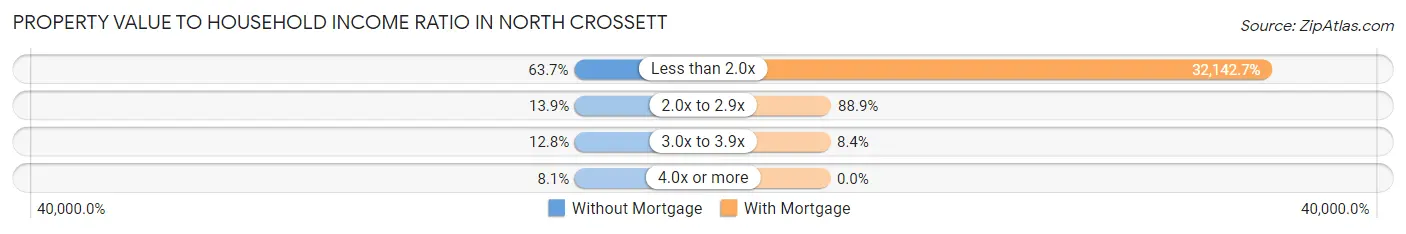
| Value-to-Income Ratio | Without Mortgage | With Mortgage |
| Less than 2.0x | 284 (63.7%) | 72,321 (32,142.7%) |
| 2.0x to 2.9x | 62 (13.9%) | 200 (88.9%) |
| 3.0x to 3.9x | 57 (12.8%) | 19 (8.4%) |
| 4.0x or more | 36 (8.1%) | 0 (0.0%) |
| Total | 446 (100.0%) | 225 (100.0%) |
Real Estate Taxes by Mortgage Status in North Crossett
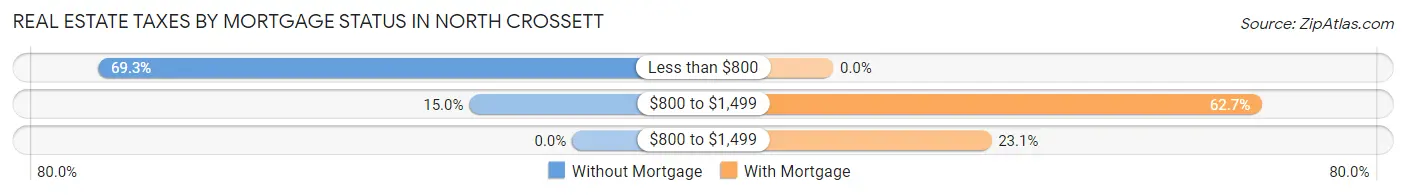
| Property Taxes | Without Mortgage | With Mortgage |
| Less than $800 | 309 (69.3%) | 0 (0.0%) |
| $800 to $1,499 | 67 (15.0%) | 141 (62.7%) |
| $800 to $1,499 | 0 (0.0%) | 52 (23.1%) |
| Total | 446 (100.0%) | 225 (100.0%) |
Health & Disability in North Crossett
Health Insurance Coverage by Age in North Crossett
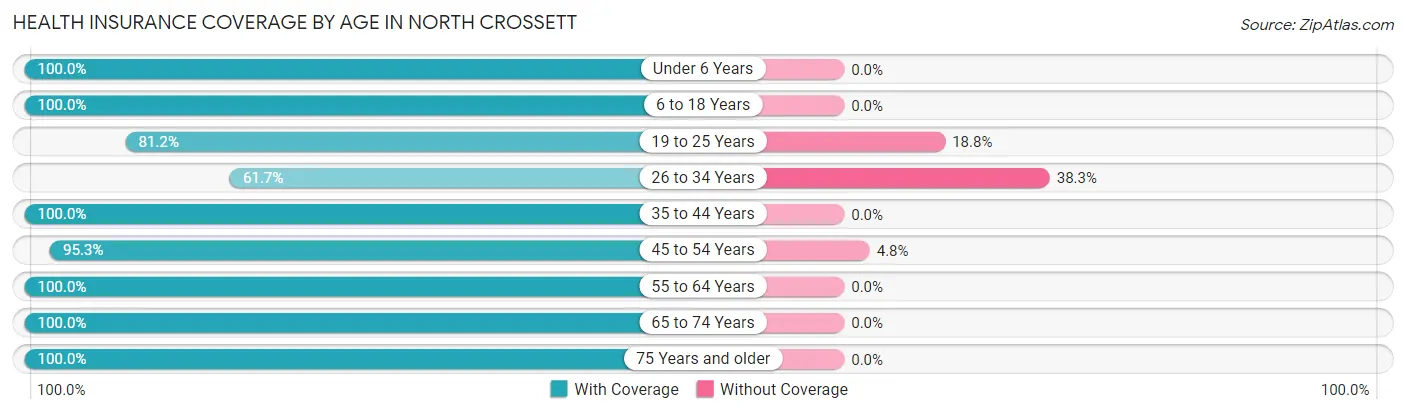
| Age Bracket | With Coverage | Without Coverage |
| Under 6 Years | 129 (100.0%) | 0 (0.0%) |
| 6 to 18 Years | 460 (100.0%) | 0 (0.0%) |
| 19 to 25 Years | 151 (81.2%) | 35 (18.8%) |
| 26 to 34 Years | 272 (61.7%) | 169 (38.3%) |
| 35 to 44 Years | 145 (100.0%) | 0 (0.0%) |
| 45 to 54 Years | 401 (95.3%) | 20 (4.8%) |
| 55 to 64 Years | 446 (100.0%) | 0 (0.0%) |
| 65 to 74 Years | 149 (100.0%) | 0 (0.0%) |
| 75 Years and older | 361 (100.0%) | 0 (0.0%) |
| Total | 2,514 (91.8%) | 224 (8.2%) |
Health Insurance Coverage by Citizenship Status in North Crossett
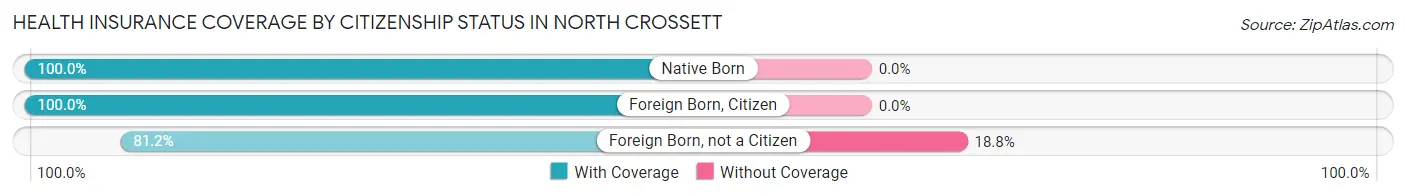
| Citizenship Status | With Coverage | Without Coverage |
| Native Born | 129 (100.0%) | 0 (0.0%) |
| Foreign Born, Citizen | 460 (100.0%) | 0 (0.0%) |
| Foreign Born, not a Citizen | 151 (81.2%) | 35 (18.8%) |
Health Insurance Coverage by Household Income in North Crossett
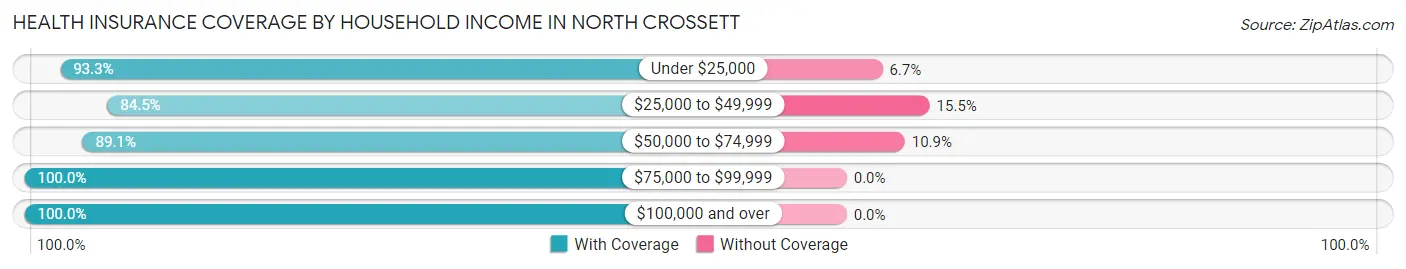
| Household Income | With Coverage | Without Coverage |
| Under $25,000 | 559 (93.3%) | 40 (6.7%) |
| $25,000 to $49,999 | 653 (84.5%) | 120 (15.5%) |
| $50,000 to $74,999 | 525 (89.1%) | 64 (10.9%) |
| $75,000 to $99,999 | 333 (100.0%) | 0 (0.0%) |
| $100,000 and over | 444 (100.0%) | 0 (0.0%) |
Public vs Private Health Insurance Coverage by Age in North Crossett
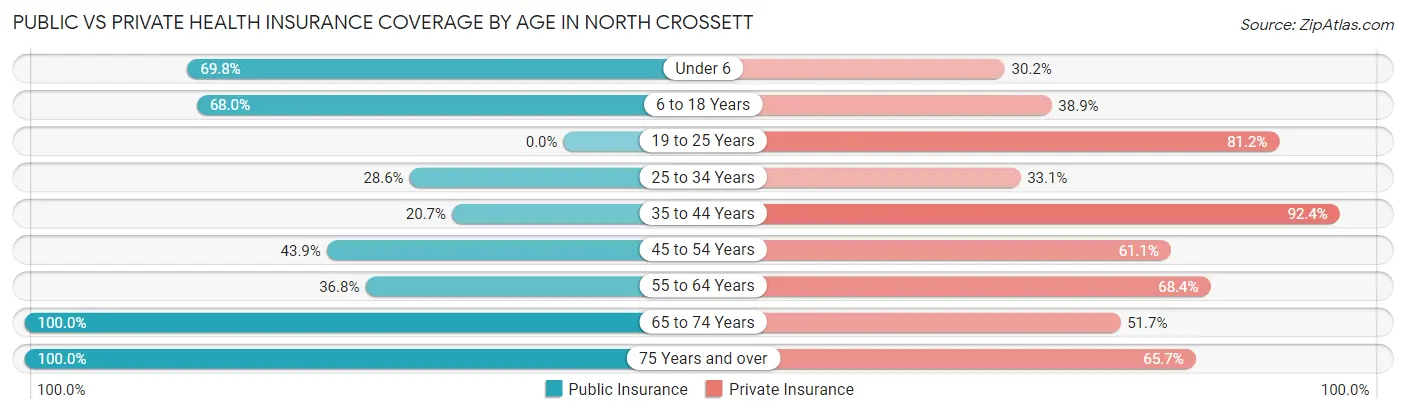
| Age Bracket | Public Insurance | Private Insurance |
| Under 6 | 90 (69.8%) | 39 (30.2%) |
| 6 to 18 Years | 313 (68.0%) | 179 (38.9%) |
| 19 to 25 Years | 0 (0.0%) | 151 (81.2%) |
| 25 to 34 Years | 126 (28.6%) | 146 (33.1%) |
| 35 to 44 Years | 30 (20.7%) | 134 (92.4%) |
| 45 to 54 Years | 185 (43.9%) | 257 (61.1%) |
| 55 to 64 Years | 164 (36.8%) | 305 (68.4%) |
| 65 to 74 Years | 149 (100.0%) | 77 (51.7%) |
| 75 Years and over | 361 (100.0%) | 237 (65.6%) |
| Total | 1,418 (51.8%) | 1,525 (55.7%) |
Disability Status by Sex by Age in North Crossett
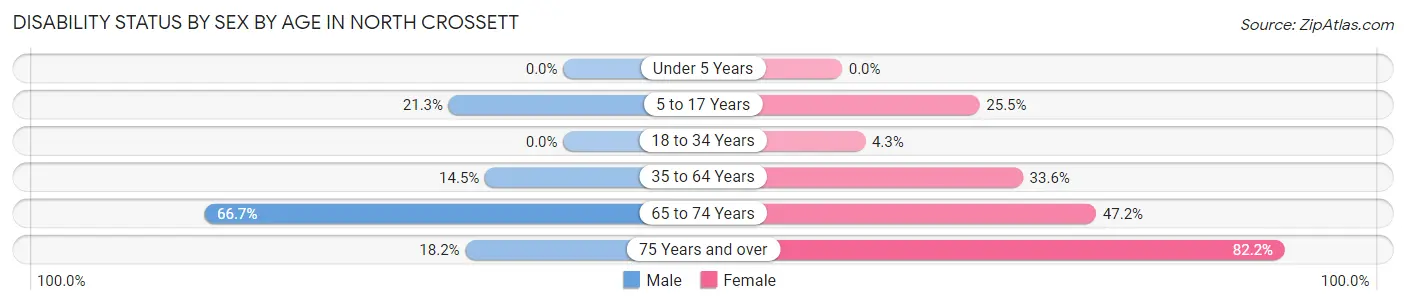
| Age Bracket | Male | Female |
| Under 5 Years | 0 (0.0%) | 0 (0.0%) |
| 5 to 17 Years | 61 (21.2%) | 48 (25.5%) |
| 18 to 34 Years | 0 (0.0%) | 18 (4.3%) |
| 35 to 64 Years | 66 (14.5%) | 187 (33.6%) |
| 65 to 74 Years | 64 (66.7%) | 25 (47.2%) |
| 75 Years and over | 38 (18.2%) | 125 (82.2%) |
Disability Class by Sex by Age in North Crossett
Disability Class: Hearing Difficulty
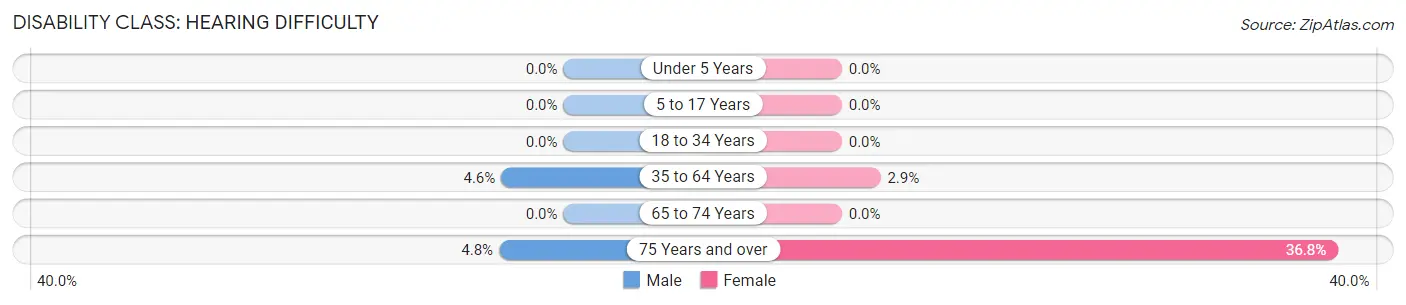
| Age Bracket | Male | Female |
| Under 5 Years | 0 (0.0%) | 0 (0.0%) |
| 5 to 17 Years | 0 (0.0%) | 0 (0.0%) |
| 18 to 34 Years | 0 (0.0%) | 0 (0.0%) |
| 35 to 64 Years | 21 (4.6%) | 16 (2.9%) |
| 65 to 74 Years | 0 (0.0%) | 0 (0.0%) |
| 75 Years and over | 10 (4.8%) | 56 (36.8%) |
Disability Class: Vision Difficulty
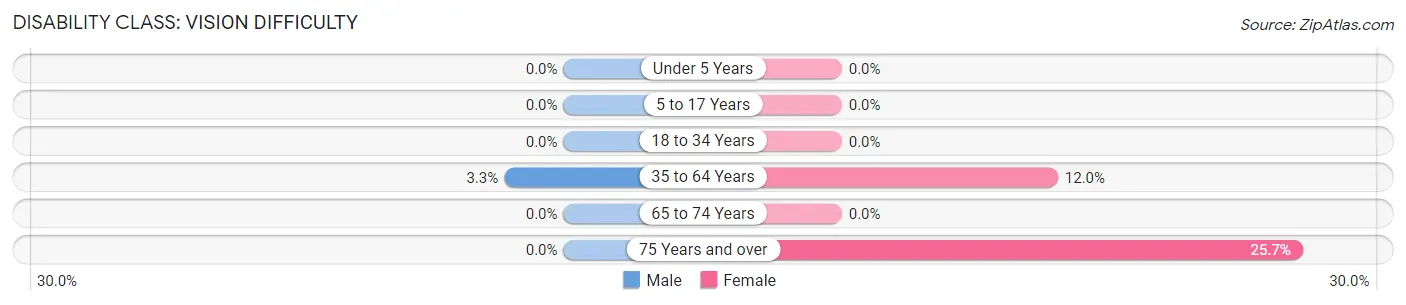
| Age Bracket | Male | Female |
| Under 5 Years | 0 (0.0%) | 0 (0.0%) |
| 5 to 17 Years | 0 (0.0%) | 0 (0.0%) |
| 18 to 34 Years | 0 (0.0%) | 0 (0.0%) |
| 35 to 64 Years | 15 (3.3%) | 67 (12.0%) |
| 65 to 74 Years | 0 (0.0%) | 0 (0.0%) |
| 75 Years and over | 0 (0.0%) | 39 (25.7%) |
Disability Class: Cognitive Difficulty
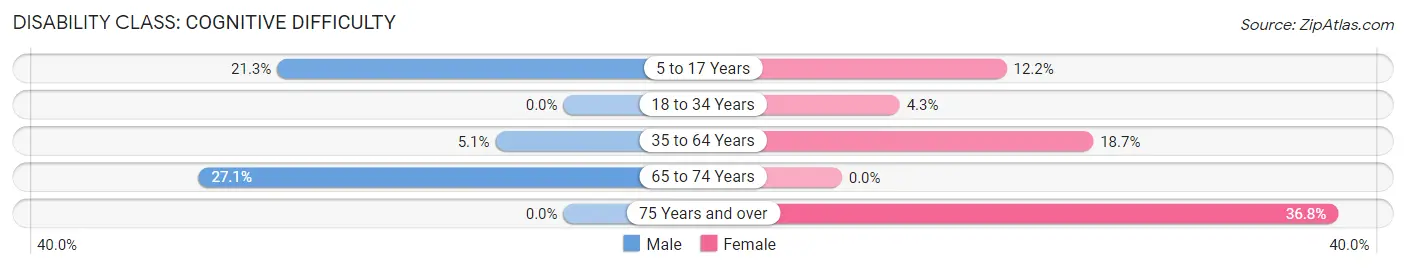
| Age Bracket | Male | Female |
| 5 to 17 Years | 61 (21.2%) | 23 (12.2%) |
| 18 to 34 Years | 0 (0.0%) | 18 (4.3%) |
| 35 to 64 Years | 23 (5.1%) | 104 (18.7%) |
| 65 to 74 Years | 26 (27.1%) | 0 (0.0%) |
| 75 Years and over | 0 (0.0%) | 56 (36.8%) |
Disability Class: Ambulatory Difficulty
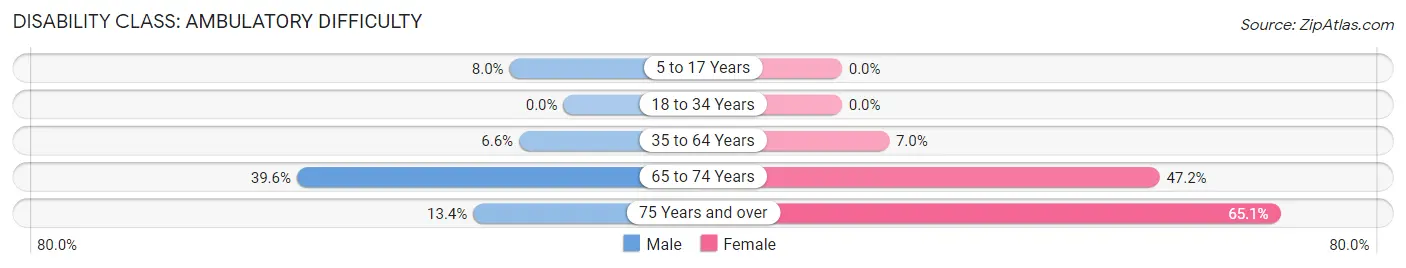
| Age Bracket | Male | Female |
| 5 to 17 Years | 23 (8.0%) | 0 (0.0%) |
| 18 to 34 Years | 0 (0.0%) | 0 (0.0%) |
| 35 to 64 Years | 30 (6.6%) | 39 (7.0%) |
| 65 to 74 Years | 38 (39.6%) | 25 (47.2%) |
| 75 Years and over | 28 (13.4%) | 99 (65.1%) |
Disability Class: Self-Care Difficulty
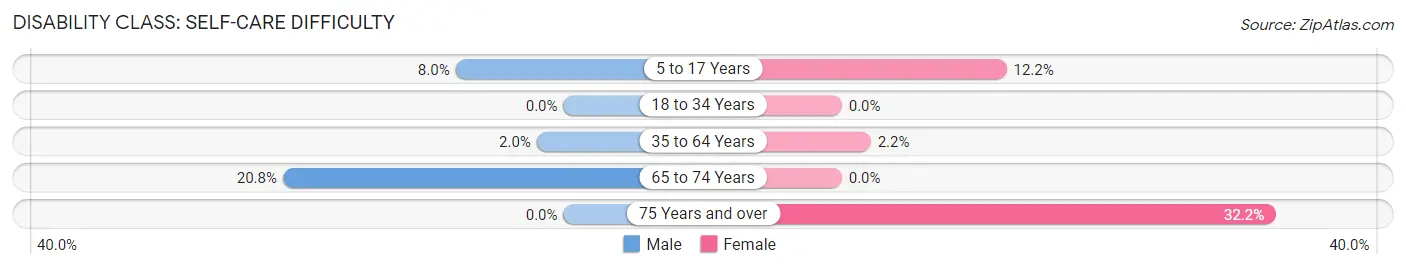
| Age Bracket | Male | Female |
| 5 to 17 Years | 23 (8.0%) | 23 (12.2%) |
| 18 to 34 Years | 0 (0.0%) | 0 (0.0%) |
| 35 to 64 Years | 9 (2.0%) | 12 (2.1%) |
| 65 to 74 Years | 20 (20.8%) | 0 (0.0%) |
| 75 Years and over | 0 (0.0%) | 49 (32.2%) |
Technology Access in North Crossett
Computing Device Access in North Crossett
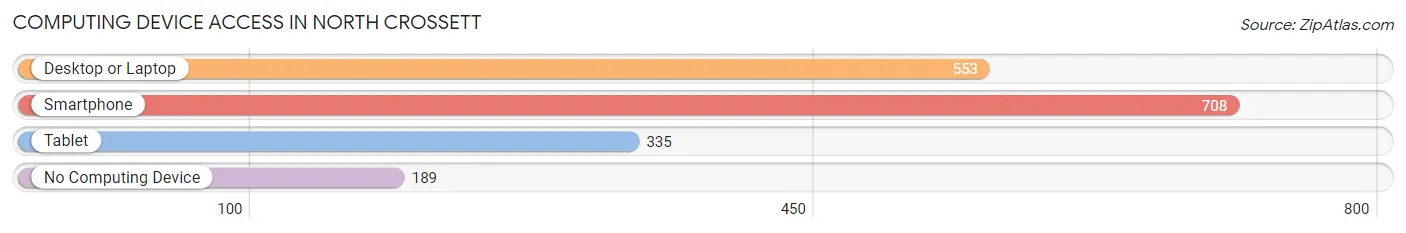
| Device Type | # Households | % Households |
| Desktop or Laptop | 553 | 57.3% |
| Smartphone | 708 | 73.4% |
| Tablet | 335 | 34.7% |
| No Computing Device | 189 | 19.6% |
| Total | 965 | 100.0% |
Internet Access in North Crossett
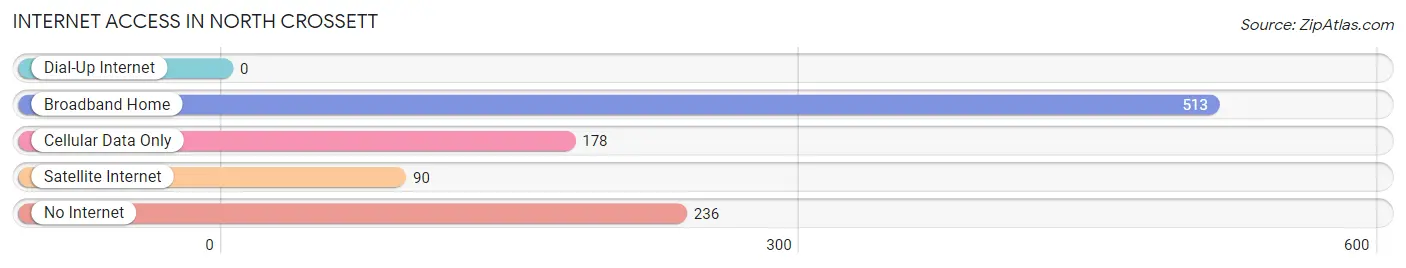
| Internet Type | # Households | % Households |
| Dial-Up Internet | 0 | 0.0% |
| Broadband Home | 513 | 53.2% |
| Cellular Data Only | 178 | 18.4% |
| Satellite Internet | 90 | 9.3% |
| No Internet | 236 | 24.5% |
| Total | 965 | 100.0% |
North Crossett Summary
Crossett, Arkansas is a small town located in Ashley County in the southeastern corner of the state. It is situated on the banks of the Saline River, approximately 30 miles south of Pine Bluff and 40 miles north of El Dorado. The town was founded in 1883 by the Crossett Lumber Company, which was owned by the Crossett family. The company was one of the largest lumber producers in the South and was responsible for the development of the town.
Crossett has a population of approximately 5,000 people and is the county seat of Ashley County. The town is home to a variety of businesses, including a hospital, a bank, a grocery store, a post office, and several restaurants. The town is also home to a number of churches, including the First United Methodist Church, the First Baptist Church, and the Church of Christ.
Crossett is located in the Arkansas Delta, an area of flat, fertile land that is known for its agricultural production. The town is surrounded by cotton, soybean, and rice fields, as well as timberland. The town is also home to a number of manufacturing plants, including a paper mill, a wood products plant, and a chemical plant.
Crossett has a humid subtropical climate, with hot, humid summers and mild winters. The average annual temperature is around 65 degrees Fahrenheit, and the average annual precipitation is around 48 inches.
The economy of Crossett is largely based on agriculture and manufacturing. The town is home to a number of agricultural businesses, including cotton gins, grain elevators, and feed mills. The town is also home to a number of manufacturing plants, including a paper mill, a wood products plant, and a chemical plant.
The population of Crossett is predominantly white, with a small African American population. The median household income in Crossett is around $30,000, and the median home value is around $90,000. The town has a low unemployment rate, and the poverty rate is below the national average.
Crossett is served by the Ashley County School District, which includes four elementary schools, one middle school, and one high school. The town is also home to a number of private schools, including the Crossett Christian Academy and the Crossett Academy of Arts and Sciences.
Crossett is a small town with a rich history and a bright future. The town is home to a variety of businesses, churches, and schools, and the economy is largely based on agriculture and manufacturing. The town is also home to a diverse population, with a median household income and home value that are both below the national average.
Common Questions
What is Per Capita Income in North Crossett?
Per Capita income in North Crossett is $20,191.
What is the Median Family Income in North Crossett?
Median Family Income in North Crossett is $42,303.
What is the Median Household income in North Crossett?
Median Household Income in North Crossett is $40,504.
What is Income or Wage Gap in North Crossett?
Income or Wage Gap in North Crossett is 53.2%.
Women in North Crossett earn 46.8 cents for every dollar earned by a man.
What is Family Income Deficit in North Crossett?
Family Income Deficit in North Crossett is $7,734.
Families that are below poverty line in North Crossett earn $7,734 less on average than the poverty threshold level.
What is Inequality or Gini Index in North Crossett?
Inequality or Gini Index in North Crossett is 0.42.
What is the Total Population of North Crossett?
Total Population of North Crossett is 2,751.
What is the Total Male Population of North Crossett?
Total Male Population of North Crossett is 1,369.
What is the Total Female Population of North Crossett?
Total Female Population of North Crossett is 1,382.
What is the Ratio of Males per 100 Females in North Crossett?
There are 99.06 Males per 100 Females in North Crossett.
What is the Ratio of Females per 100 Males in North Crossett?
There are 100.95 Females per 100 Males in North Crossett.
What is the Median Population Age in North Crossett?
Median Population Age in North Crossett is 45.7 Years.
What is the Average Family Size in North Crossett
Average Family Size in North Crossett is 3.9 People.
What is the Average Household Size in North Crossett
Average Household Size in North Crossett is 2.8 People.
How Large is the Labor Force in North Crossett?
There are 1,042 People in the Labor Forcein in North Crossett.
What is the Percentage of People in the Labor Force in North Crossett?
47.0% of People are in the Labor Force in North Crossett.
What is the Unemployment Rate in North Crossett?
Unemployment Rate in North Crossett is 4.7%.