Ozan, AR Map & Demographics
Ozan Map
Ozan Overview
$32,070
PER CAPITA INCOME
$82,000
AVG FAMILY INCOME
$62,500
AVG HOUSEHOLD INCOME
58.0%
WAGE / INCOME GAP [ % ]
42.0¢/ $1
WAGE / INCOME GAP [ $ ]
0.27
INEQUALITY / GINI INDEX
79
TOTAL POPULATION
26
MALE POPULATION
53
FEMALE POPULATION
49.06
MALES / 100 FEMALES
203.85
FEMALES / 100 MALES
63.1
MEDIAN AGE
2.5
AVG FAMILY SIZE
1.9
AVG HOUSEHOLD SIZE
51
LABOR FORCE [ PEOPLE ]
65.4%
PERCENT IN LABOR FORCE
Ozan Zip Codes
Ozan Area Codes
Income in Ozan
Income Overview in Ozan
Per Capita Income in Ozan is $32,070, while median incomes of families and households are $82,000 and $62,500 respectively.
| Characteristic | Number | Measure |
| Per Capita Income | 79 | $32,070 |
| Median Family Income | 24 | $82,000 |
| Mean Family Income | 24 | $74,508 |
| Median Household Income | 42 | $62,500 |
| Mean Household Income | 42 | $56,698 |
| Income Deficit | 24 | $0 |
| Wage / Income Gap (%) | 79 | 58.02% |
| Wage / Income Gap ($) | 79 | 41.98¢ per $1 |
| Gini / Inequality Index | 79 | 0.27 |
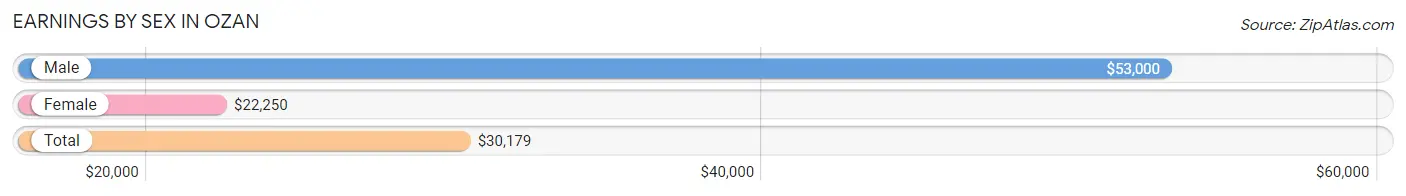
Earnings by Sex in Ozan
Average Earnings in Ozan are $30,179, $53,000 for men and $22,250 for women, a difference of 58.0%.
| Sex | Number | Average Earnings |
| Male | 20 (35.1%) | $53,000 |
| Female | 37 (64.9%) | $22,250 |
| Total | 57 (100.0%) | $30,179 |
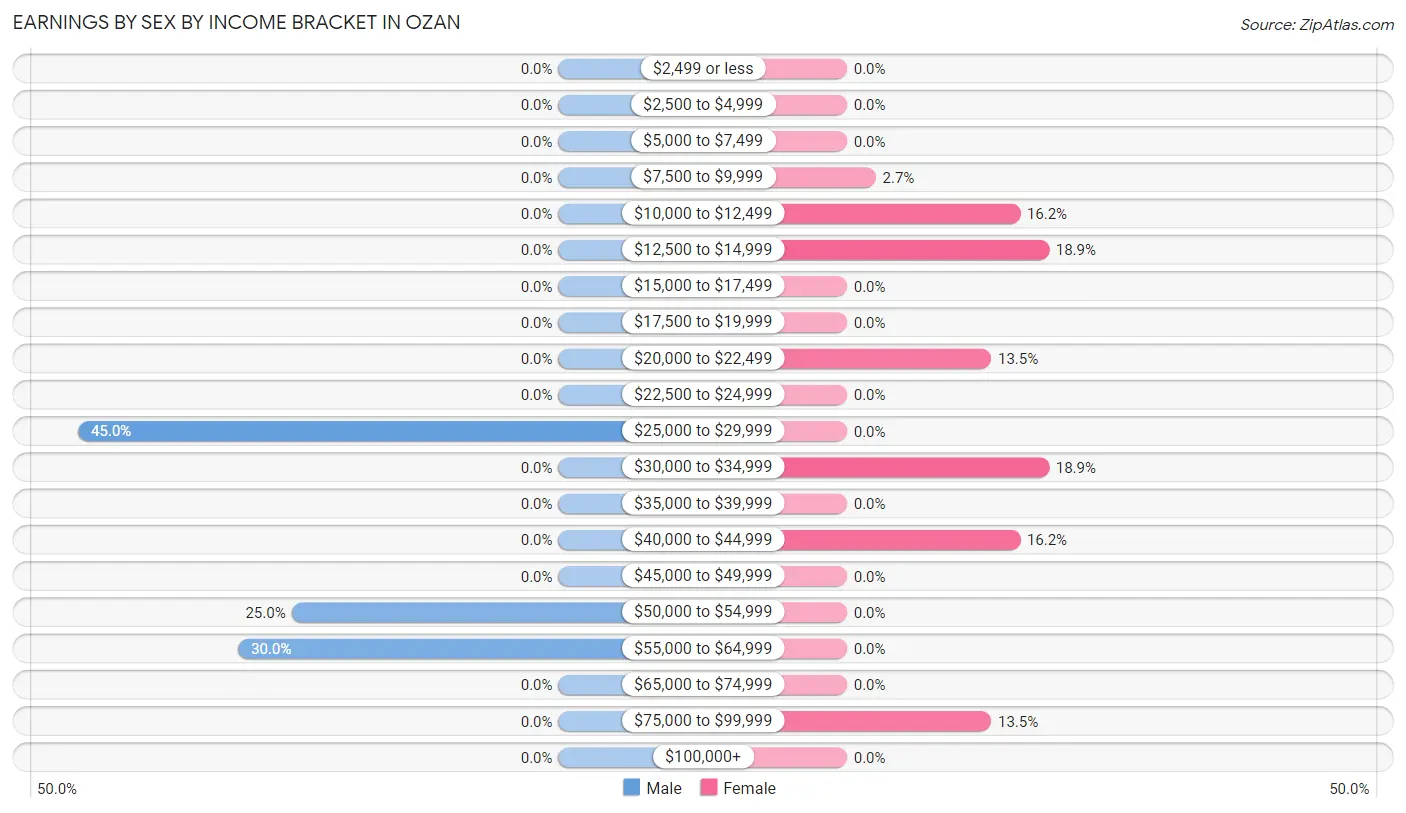
Earnings by Sex by Income Bracket in Ozan
The most common earnings brackets in Ozan are $25,000 to $29,999 for men (9 | 45.0%) and $12,500 to $14,999 for women (7 | 18.9%).
| Income | Male | Female |
| $2,499 or less | 0 (0.0%) | 0 (0.0%) |
| $2,500 to $4,999 | 0 (0.0%) | 0 (0.0%) |
| $5,000 to $7,499 | 0 (0.0%) | 0 (0.0%) |
| $7,500 to $9,999 | 0 (0.0%) | 1 (2.7%) |
| $10,000 to $12,499 | 0 (0.0%) | 6 (16.2%) |
| $12,500 to $14,999 | 0 (0.0%) | 7 (18.9%) |
| $15,000 to $17,499 | 0 (0.0%) | 0 (0.0%) |
| $17,500 to $19,999 | 0 (0.0%) | 0 (0.0%) |
| $20,000 to $22,499 | 0 (0.0%) | 5 (13.5%) |
| $22,500 to $24,999 | 0 (0.0%) | 0 (0.0%) |
| $25,000 to $29,999 | 9 (45.0%) | 0 (0.0%) |
| $30,000 to $34,999 | 0 (0.0%) | 7 (18.9%) |
| $35,000 to $39,999 | 0 (0.0%) | 0 (0.0%) |
| $40,000 to $44,999 | 0 (0.0%) | 6 (16.2%) |
| $45,000 to $49,999 | 0 (0.0%) | 0 (0.0%) |
| $50,000 to $54,999 | 5 (25.0%) | 0 (0.0%) |
| $55,000 to $64,999 | 6 (30.0%) | 0 (0.0%) |
| $65,000 to $74,999 | 0 (0.0%) | 0 (0.0%) |
| $75,000 to $99,999 | 0 (0.0%) | 5 (13.5%) |
| $100,000+ | 0 (0.0%) | 0 (0.0%) |
| Total | 20 (100.0%) | 37 (100.0%) |
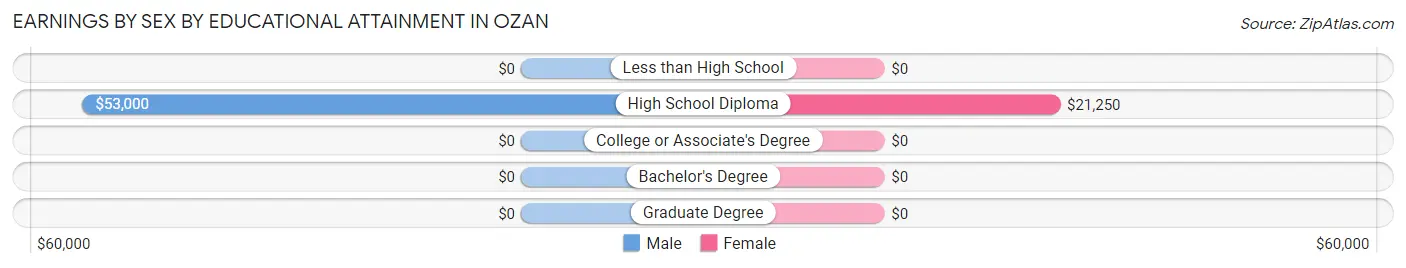
Earnings by Sex by Educational Attainment in Ozan
Average earnings in Ozan are $53,000 for men and $32,143 for women, a difference of 39.4%. Men with an educational attainment of high school diploma enjoy the highest average annual earnings of $53,000, while those with high school diploma education earn the least with $53,000. Women with an educational attainment of high school diploma earn the most with the average annual earnings of $21,250, while those with high school diploma education have the smallest earnings of $21,250.
| Educational Attainment | Male Income | Female Income |
| Less than High School | - | - |
| High School Diploma | $53,000 | $21,250 |
| College or Associate's Degree | - | - |
| Bachelor's Degree | - | - |
| Graduate Degree | - | - |
| Total | $53,000 | $32,143 |
Family Income in Ozan
Family Income Brackets in Ozan
According to the Ozan family income data, there are 16 families falling into the $75,000 to $99,999 income range, which is the most common income bracket and makes up 66.7% of all families.
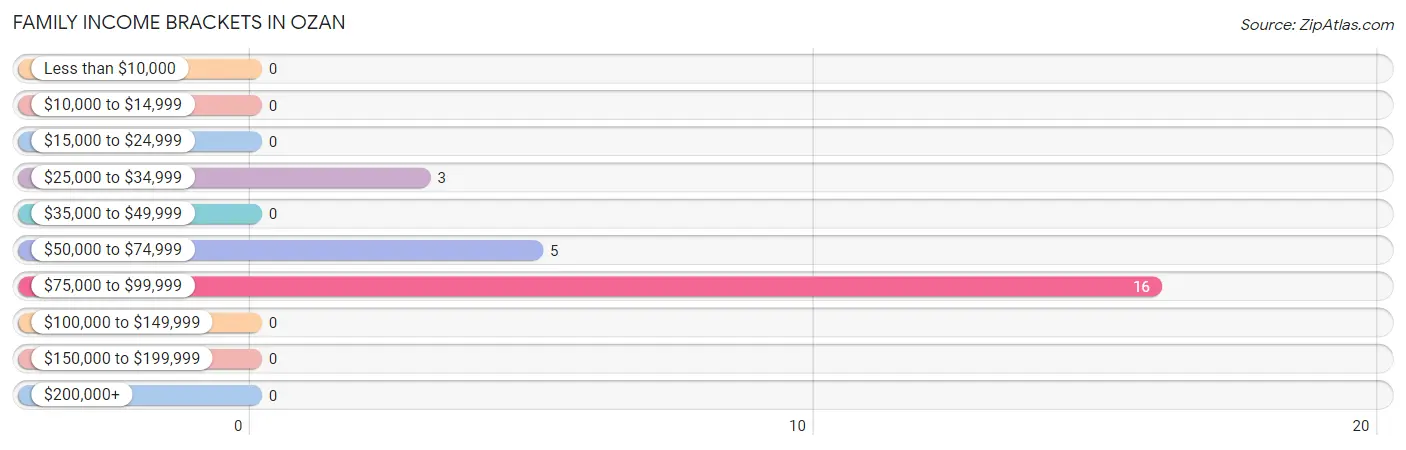
| Income Bracket | # Families | % Families |
| Less than $10,000 | 0 | 0.0% |
| $10,000 to $14,999 | 0 | 0.0% |
| $15,000 to $24,999 | 0 | 0.0% |
| $25,000 to $34,999 | 3 | 12.5% |
| $35,000 to $49,999 | 0 | 0.0% |
| $50,000 to $74,999 | 5 | 20.8% |
| $75,000 to $99,999 | 16 | 66.7% |
| $100,000 to $149,999 | 0 | 0.0% |
| $150,000 to $199,999 | 0 | 0.0% |
| $200,000+ | 0 | 0.0% |
Family Income by Famaliy Size in Ozan
2-person families (19 | 79.2%) account for the highest median family income in Ozan with $85,625 per family, while 2-person families (19 | 79.2%) have the highest median income of $42,812 per family member.
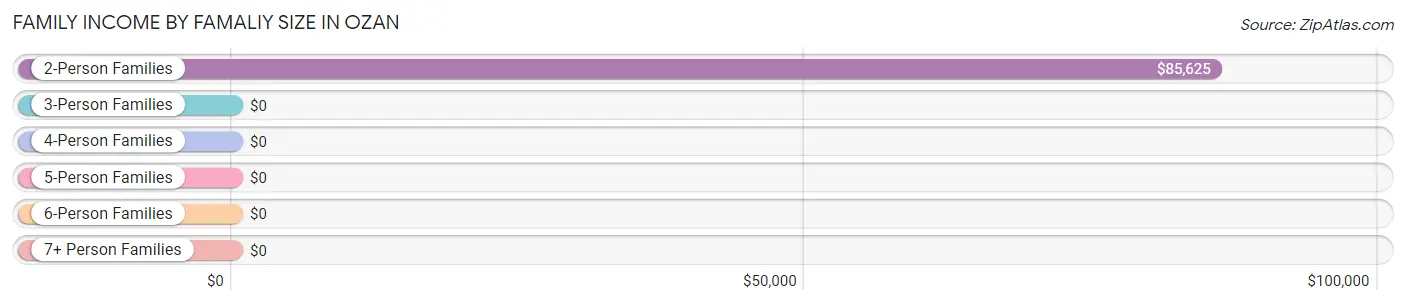
| Income Bracket | # Families | Median Income |
| 2-Person Families | 19 (79.2%) | $85,625 |
| 3-Person Families | 5 (20.8%) | $0 |
| 4-Person Families | 0 (0.0%) | $0 |
| 5-Person Families | 0 (0.0%) | $0 |
| 6-Person Families | 0 (0.0%) | $0 |
| 7+ Person Families | 0 (0.0%) | $0 |
| Total | 24 (100.0%) | $82,000 |
Family Income by Number of Earners in Ozan
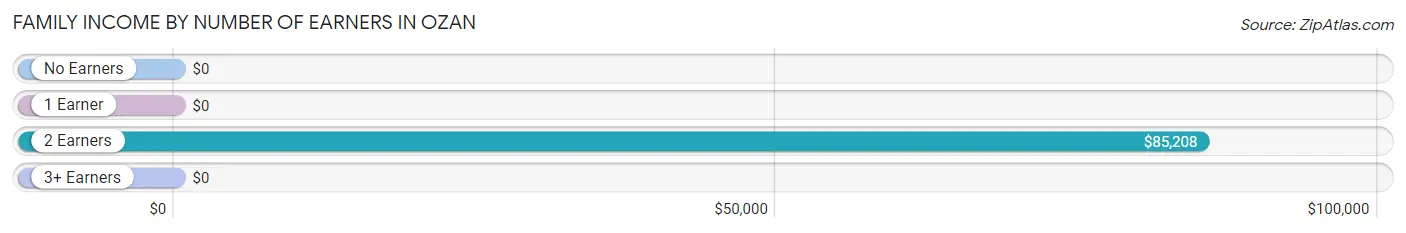
| Number of Earners | # Families | Median Income |
| No Earners | 2 (8.3%) | $0 |
| 1 Earner | 1 (4.2%) | $0 |
| 2 Earners | 21 (87.5%) | $85,208 |
| 3+ Earners | 0 (0.0%) | $0 |
| Total | 24 (100.0%) | $82,000 |
Household Income in Ozan
Household Income Brackets in Ozan
With 16 households falling in the category, the $75,000 to $99,999 income range is the most frequent in Ozan, accounting for 38.1% of all households.
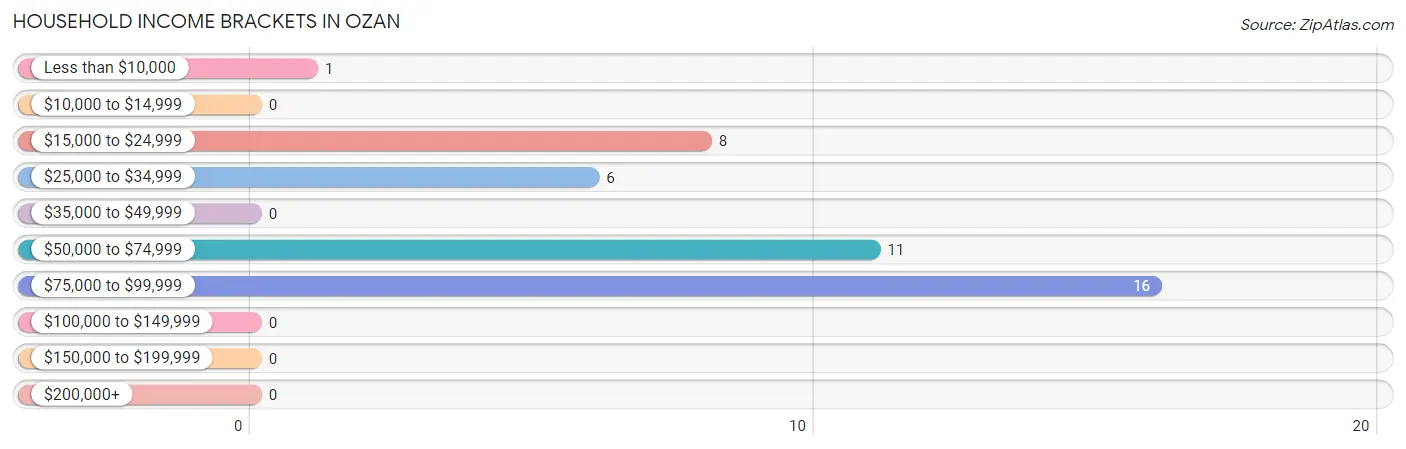
| Income Bracket | # Households | % Households |
| Less than $10,000 | 1 | 2.4% |
| $10,000 to $14,999 | 0 | 0.0% |
| $15,000 to $24,999 | 8 | 19.0% |
| $25,000 to $34,999 | 6 | 14.3% |
| $35,000 to $49,999 | 0 | 0.0% |
| $50,000 to $74,999 | 11 | 26.2% |
| $75,000 to $99,999 | 16 | 38.1% |
| $100,000 to $149,999 | 0 | 0.0% |
| $150,000 to $199,999 | 0 | 0.0% |
| $200,000+ | 0 | 0.0% |
Household Income by Householder Age in Ozan
The median household income in Ozan is $62,500, with the highest median household income of $82,000 found in the 45 to 64 years age bracket for the primary householder. A total of 12 households (28.6%) fall into this category.
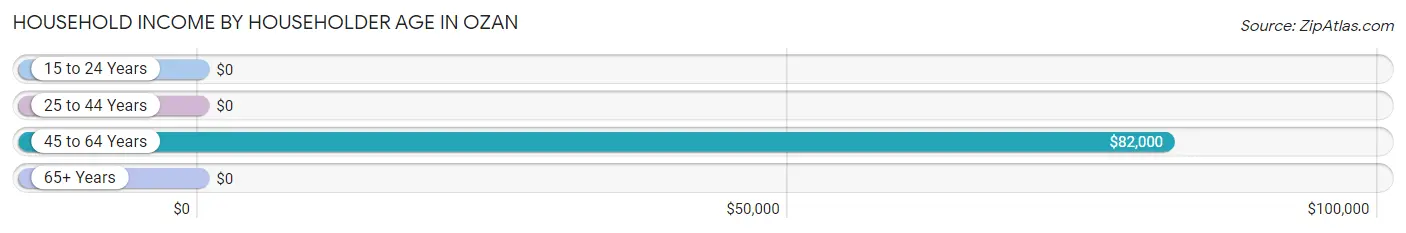
| Income Bracket | # Households | Median Income |
| 15 to 24 Years | 0 (0.0%) | $0 |
| 25 to 44 Years | 6 (14.3%) | $0 |
| 45 to 64 Years | 12 (28.6%) | $82,000 |
| 65+ Years | 24 (57.1%) | $0 |
| Total | 42 (100.0%) | $62,500 |
Poverty in Ozan
Income Below Poverty by Sex and Age in Ozan
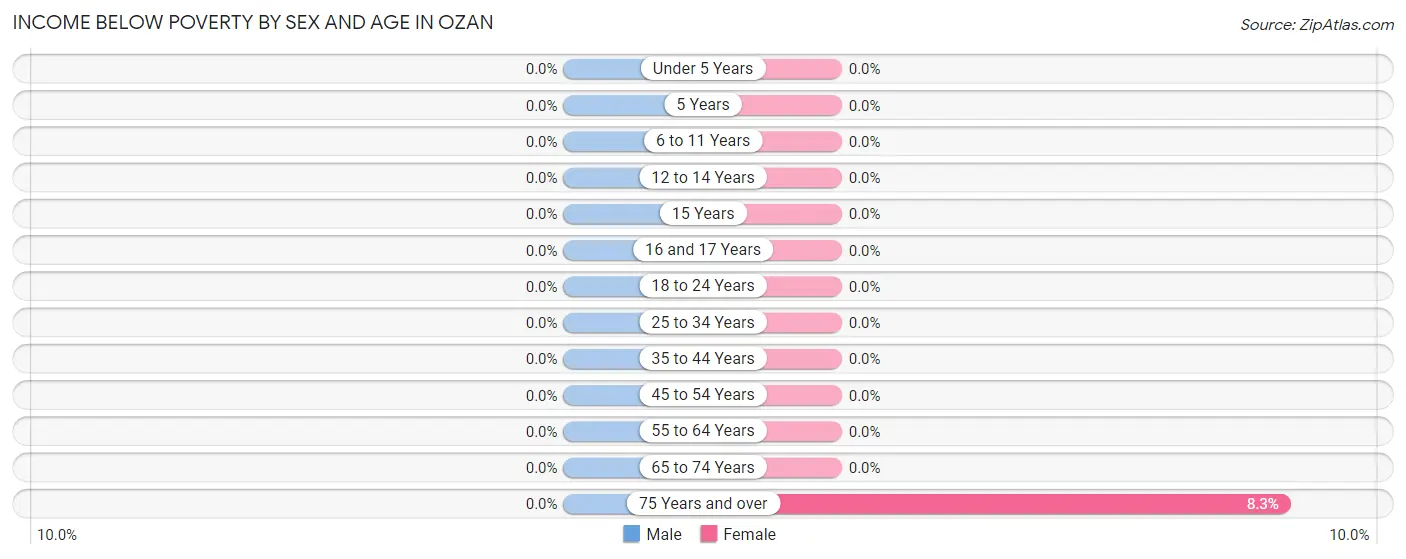
| Age Bracket | Male | Female |
| Under 5 Years | 0 (0.0%) | 0 (0.0%) |
| 5 Years | 0 (0.0%) | 0 (0.0%) |
| 6 to 11 Years | 0 (0.0%) | 0 (0.0%) |
| 12 to 14 Years | 0 (0.0%) | 0 (0.0%) |
| 15 Years | 0 (0.0%) | 0 (0.0%) |
| 16 and 17 Years | 0 (0.0%) | 0 (0.0%) |
| 18 to 24 Years | 0 (0.0%) | 0 (0.0%) |
| 25 to 34 Years | 0 (0.0%) | 0 (0.0%) |
| 35 to 44 Years | 0 (0.0%) | 0 (0.0%) |
| 45 to 54 Years | 0 (0.0%) | 0 (0.0%) |
| 55 to 64 Years | 0 (0.0%) | 0 (0.0%) |
| 65 to 74 Years | 0 (0.0%) | 0 (0.0%) |
| 75 Years and over | 0 (0.0%) | 1 (8.3%) |
| Total | 0 (0.0%) | 1 (1.9%) |
Income Above Poverty by Sex and Age in Ozan
According to the poverty statistics in Ozan, males aged 35 to 44 years and females aged 15 years are the age groups that are most secure financially, with 100.0% of males and 100.0% of females in these age groups living above the poverty line.
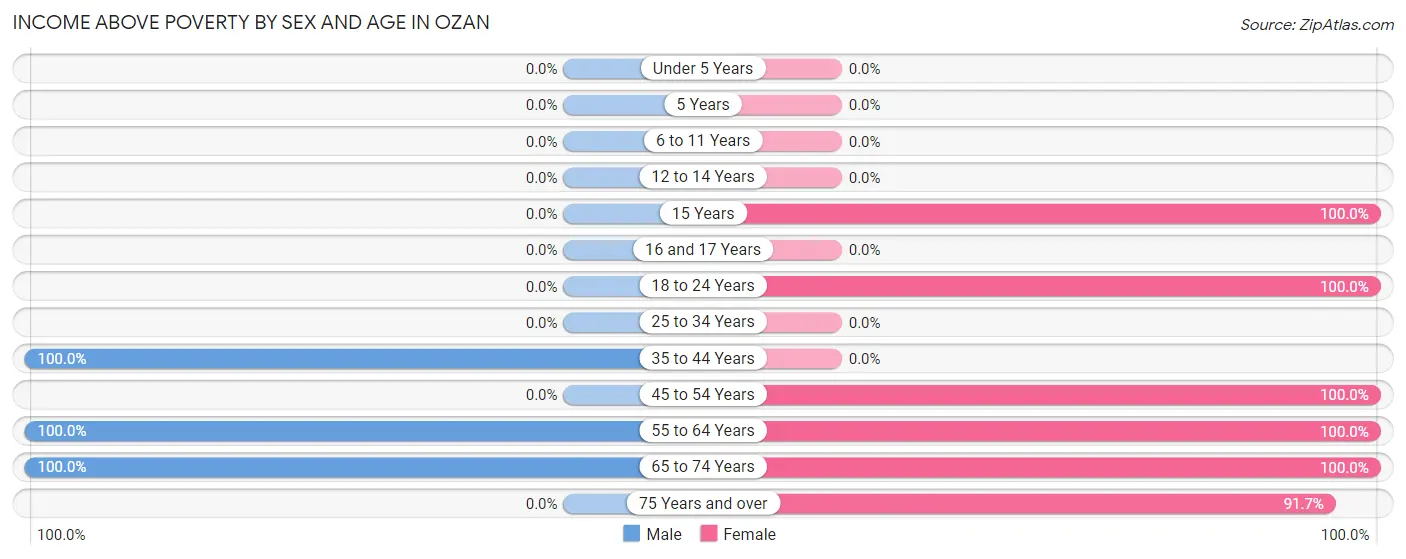
| Age Bracket | Male | Female |
| Under 5 Years | 0 (0.0%) | 0 (0.0%) |
| 5 Years | 0 (0.0%) | 0 (0.0%) |
| 6 to 11 Years | 0 (0.0%) | 0 (0.0%) |
| 12 to 14 Years | 0 (0.0%) | 0 (0.0%) |
| 15 Years | 0 (0.0%) | 1 (100.0%) |
| 16 and 17 Years | 0 (0.0%) | 0 (0.0%) |
| 18 to 24 Years | 0 (0.0%) | 13 (100.0%) |
| 25 to 34 Years | 0 (0.0%) | 0 (0.0%) |
| 35 to 44 Years | 6 (100.0%) | 0 (0.0%) |
| 45 to 54 Years | 0 (0.0%) | 14 (100.0%) |
| 55 to 64 Years | 10 (100.0%) | 2 (100.0%) |
| 65 to 74 Years | 10 (100.0%) | 11 (100.0%) |
| 75 Years and over | 0 (0.0%) | 11 (91.7%) |
| Total | 26 (100.0%) | 52 (98.1%) |
Income Below Poverty Among Married-Couple Families in Ozan
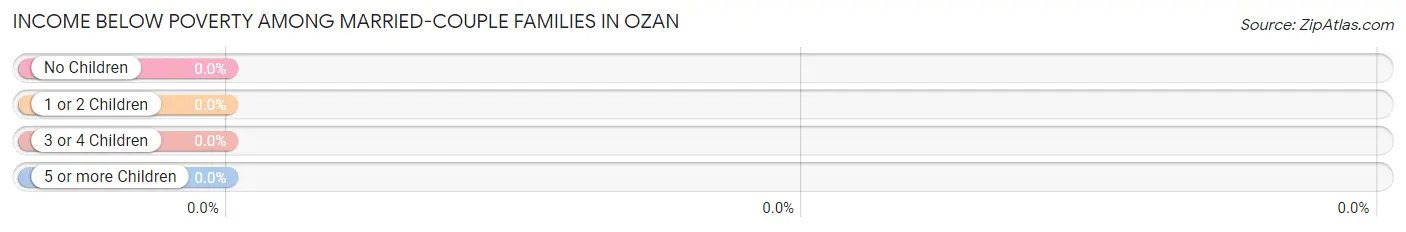
| Children | Above Poverty | Below Poverty |
| No Children | 16 (100.0%) | 0 (0.0%) |
| 1 or 2 Children | 0 (0.0%) | 0 (0.0%) |
| 3 or 4 Children | 0 (0.0%) | 0 (0.0%) |
| 5 or more Children | 0 (0.0%) | 0 (0.0%) |
| Total | 16 (100.0%) | 0 (0.0%) |
Income Below Poverty Among Single-Parent Households in Ozan
| Children | Single Father | Single Mother |
| No Children | 0 (0.0%) | 0 (0.0%) |
| 1 or 2 Children | 0 (0.0%) | 0 (0.0%) |
| 3 or 4 Children | 0 (0.0%) | 0 (0.0%) |
| 5 or more Children | 0 (0.0%) | 0 (0.0%) |
| Total | 0 (0.0%) | 0 (0.0%) |
Income Below Poverty Among Married-Couple vs Single-Parent Households in Ozan
| Children | Married-Couple Families | Single-Parent Households |
| No Children | 0 (0.0%) | 0 (0.0%) |
| 1 or 2 Children | 0 (0.0%) | 0 (0.0%) |
| 3 or 4 Children | 0 (0.0%) | 0 (0.0%) |
| 5 or more Children | 0 (0.0%) | 0 (0.0%) |
| Total | 0 (0.0%) | 0 (0.0%) |
Race in Ozan
The most populous races in Ozan are Black / African American (51 | 64.6%), White / Caucasian (27 | 34.2%), and Hispanic or Latino (1 | 1.3%).
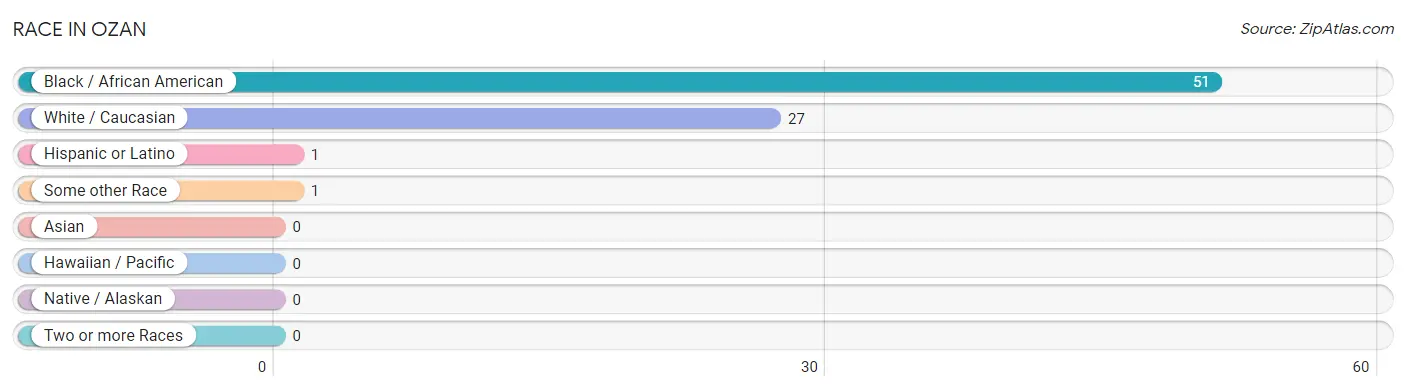
| Race | # Population | % Population |
| Asian | 0 | 0.0% |
| Black / African American | 51 | 64.6% |
| Hawaiian / Pacific | 0 | 0.0% |
| Hispanic or Latino | 1 | 1.3% |
| Native / Alaskan | 0 | 0.0% |
| White / Caucasian | 27 | 34.2% |
| Two or more Races | 0 | 0.0% |
| Some other Race | 1 | 1.3% |
| Total | 79 | 100.0% |
Ancestry in Ozan
The most populous ancestries reported in Ozan are German (13 | 16.5%), English (2 | 2.5%), Irish (2 | 2.5%), French (1 | 1.3%), and Mexican (1 | 1.3%), together accounting for 24.1% of all Ozan residents.
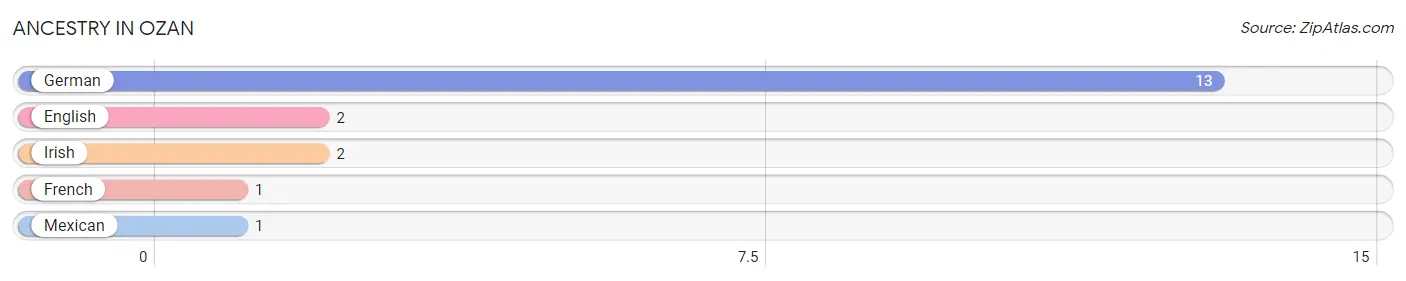
| Ancestry | # Population | % Population |
| English | 2 | 2.5% |
| French | 1 | 1.3% |
| German | 13 | 16.5% |
| Irish | 2 | 2.5% |
| Mexican | 1 | 1.3% | View All 5 Rows |
Immigrants in Ozan

| Immigration Origin | # Population | % Population | View All 0 Rows |
Sex and Age in Ozan
Sex and Age in Ozan
The most populous age groups in Ozan are 65 to 69 Years (10 | 38.5%) for men and 20 to 24 Years (13 | 24.5%) for women.
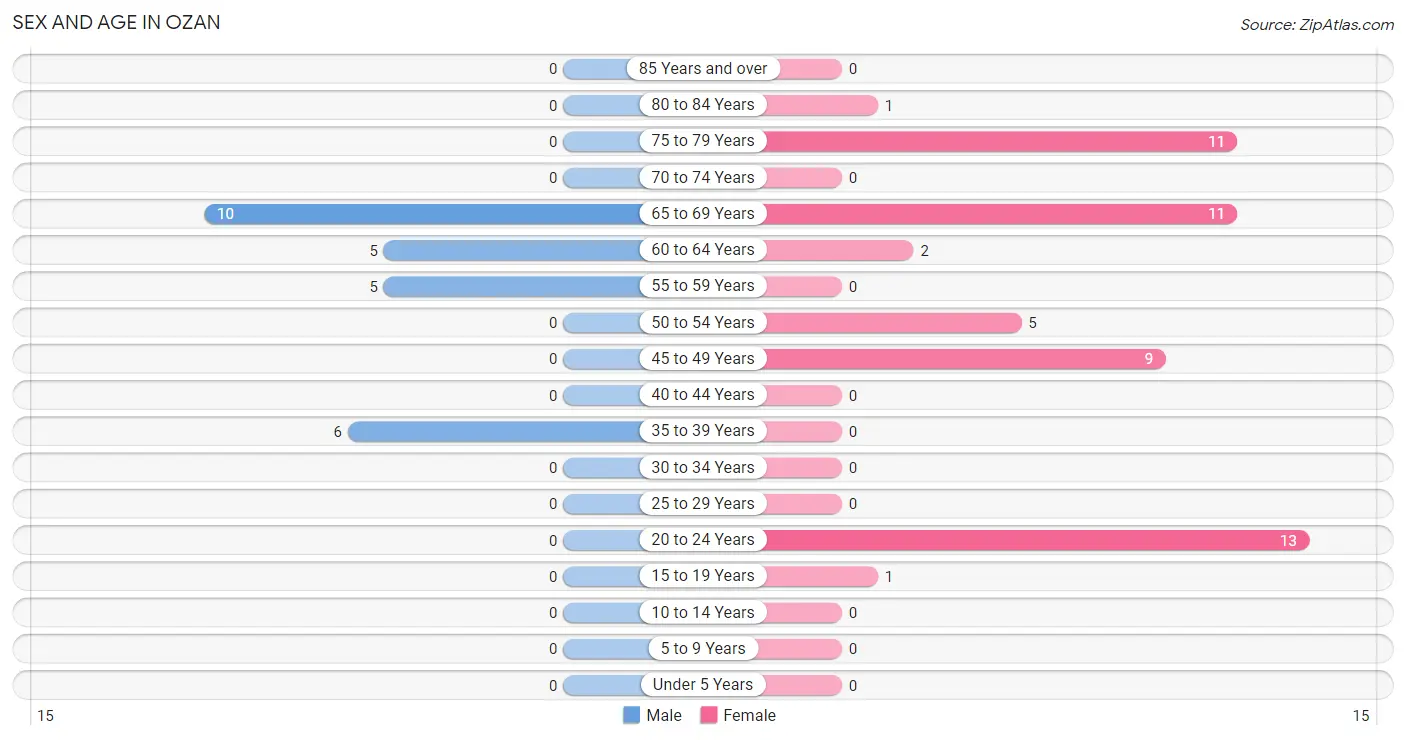
| Age Bracket | Male | Female |
| Under 5 Years | 0 (0.0%) | 0 (0.0%) |
| 5 to 9 Years | 0 (0.0%) | 0 (0.0%) |
| 10 to 14 Years | 0 (0.0%) | 0 (0.0%) |
| 15 to 19 Years | 0 (0.0%) | 1 (1.9%) |
| 20 to 24 Years | 0 (0.0%) | 13 (24.5%) |
| 25 to 29 Years | 0 (0.0%) | 0 (0.0%) |
| 30 to 34 Years | 0 (0.0%) | 0 (0.0%) |
| 35 to 39 Years | 6 (23.1%) | 0 (0.0%) |
| 40 to 44 Years | 0 (0.0%) | 0 (0.0%) |
| 45 to 49 Years | 0 (0.0%) | 9 (17.0%) |
| 50 to 54 Years | 0 (0.0%) | 5 (9.4%) |
| 55 to 59 Years | 5 (19.2%) | 0 (0.0%) |
| 60 to 64 Years | 5 (19.2%) | 2 (3.8%) |
| 65 to 69 Years | 10 (38.5%) | 11 (20.7%) |
| 70 to 74 Years | 0 (0.0%) | 0 (0.0%) |
| 75 to 79 Years | 0 (0.0%) | 11 (20.7%) |
| 80 to 84 Years | 0 (0.0%) | 1 (1.9%) |
| 85 Years and over | 0 (0.0%) | 0 (0.0%) |
| Total | 26 (100.0%) | 53 (100.0%) |
Families and Households in Ozan
Median Family Size in Ozan
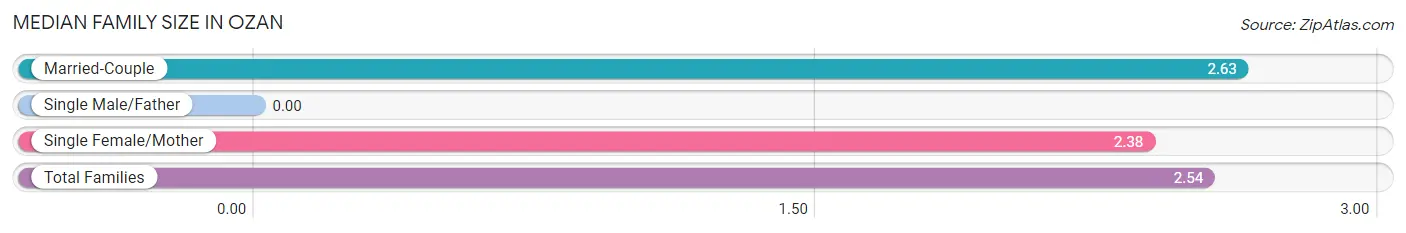
| Family Type | # Families | Family Size |
| Married-Couple | 16 (66.7%) | 2.63 |
| Single Male/Father | 0 (0.0%) | - |
| Single Female/Mother | 8 (33.3%) | 2.38 |
| Total Families | 24 (100.0%) | 2.54 |
Median Household Size in Ozan
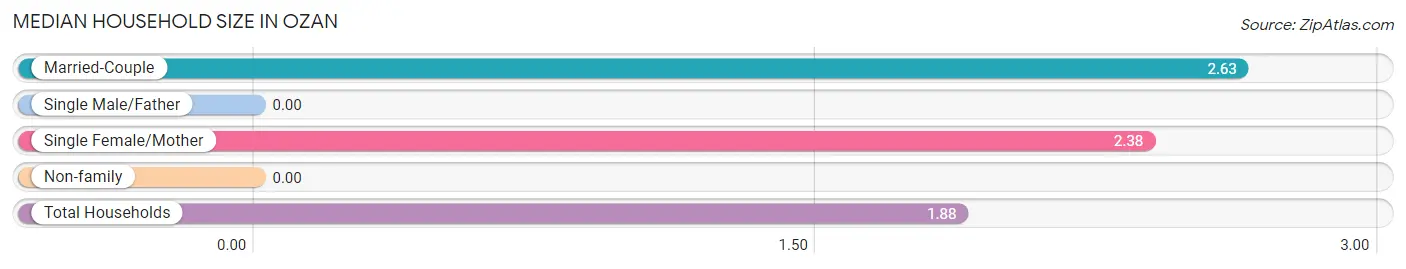
| Household Type | # Households | Household Size |
| Married-Couple | 16 (38.1%) | 2.63 |
| Single Male/Father | 0 (0.0%) | - |
| Single Female/Mother | 8 (19.1%) | 2.38 |
| Non-family | 18 (42.9%) | - |
| Total Households | 42 (100.0%) | 1.88 |
Household Size by Marriage Status in Ozan
Out of a total of 42 households in Ozan, 24 (57.1%) are family households, while 18 (42.9%) are nonfamily households. The most numerous type of family households are 2-person households, comprising 19, and the most common type of nonfamily households are 1-person households, comprising 18.
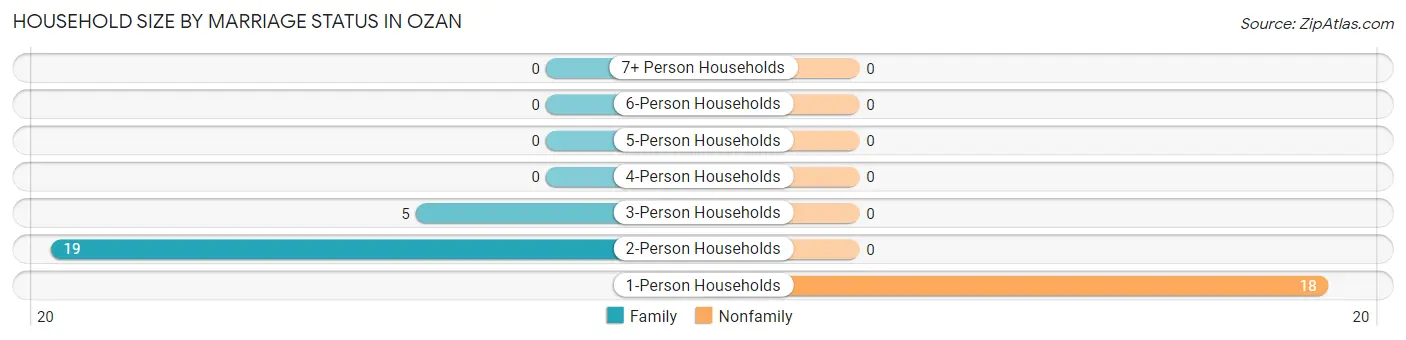
| Household Size | Family Households | Nonfamily Households |
| 1-Person Households | - | 18 (42.9%) |
| 2-Person Households | 19 (45.2%) | 0 (0.0%) |
| 3-Person Households | 5 (11.9%) | 0 (0.0%) |
| 4-Person Households | 0 (0.0%) | 0 (0.0%) |
| 5-Person Households | 0 (0.0%) | 0 (0.0%) |
| 6-Person Households | 0 (0.0%) | 0 (0.0%) |
| 7+ Person Households | 0 (0.0%) | 0 (0.0%) |
| Total | 24 (57.1%) | 18 (42.9%) |
Female Fertility in Ozan
Fertility by Age in Ozan
| Age Bracket | Women with Births | Births / 1,000 Women |
| 15 to 19 years | 0 (0.0%) | 0.0 |
| 20 to 34 years | 0 (0.0%) | 0.0 |
| 35 to 50 years | 0 (0.0%) | 0.0 |
| Total | 0 (0.0%) | 0.0 |
Fertility by Age by Marriage Status in Ozan
| Age Bracket | Married | Unmarried |
| 15 to 19 years | 0 (0.0%) | 0 (0.0%) |
| 20 to 34 years | 0 (0.0%) | 0 (0.0%) |
| 35 to 50 years | 0 (0.0%) | 0 (0.0%) |
| Total | 0 (0.0%) | 0 (0.0%) |
Fertility by Education in Ozan
| Educational Attainment | Women with Births | Births / 1,000 Women |
| Less than High School | 0 (0.0%) | 0.0 |
| High School Diploma | 0 (0.0%) | 0.0 |
| College or Associate's Degree | 0 (0.0%) | 0.0 |
| Bachelor's Degree | 0 (0.0%) | 0.0 |
| Graduate Degree | 0 (0.0%) | 0.0 |
| Total | 0 (0.0%) | 0.0 |
Fertility by Education by Marriage Status in Ozan
| Educational Attainment | Married | Unmarried |
| Less than High School | 0 (0.0%) | 0 (0.0%) |
| High School Diploma | 0 (0.0%) | 0 (0.0%) |
| College or Associate's Degree | 0 (0.0%) | 0 (0.0%) |
| Bachelor's Degree | 0 (0.0%) | 0 (0.0%) |
| Graduate Degree | 0 (0.0%) | 0 (0.0%) |
| Total | 0 (0.0%) | 0 (0.0%) |
Employment Characteristics in Ozan
Employment by Class of Employer in Ozan
Among the 39 employed individuals in Ozan, private company employees (30 | 76.9%), and state government employees (9 | 23.1%) make up the most common classes of employment.
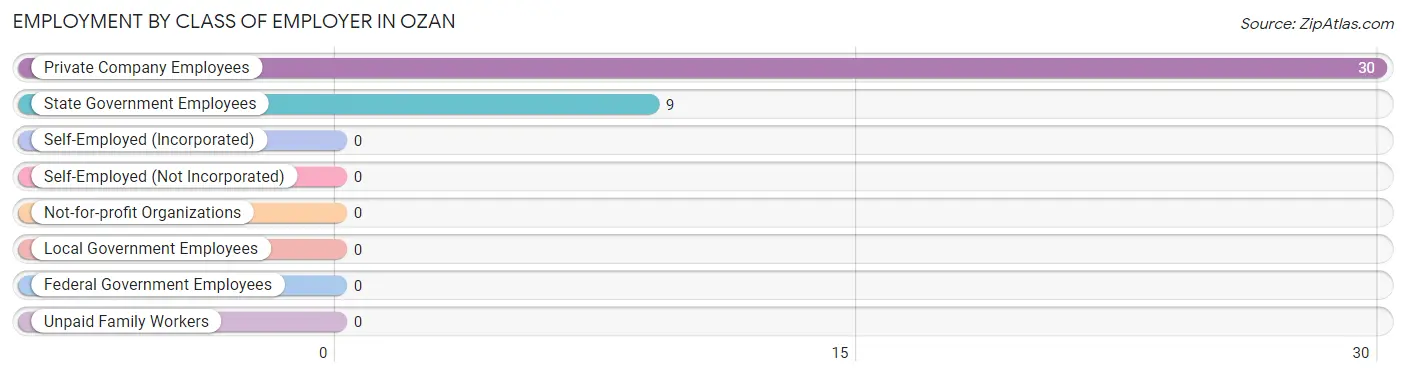
| Employer Class | # Employees | % Employees |
| Private Company Employees | 30 | 76.9% |
| Self-Employed (Incorporated) | 0 | 0.0% |
| Self-Employed (Not Incorporated) | 0 | 0.0% |
| Not-for-profit Organizations | 0 | 0.0% |
| Local Government Employees | 0 | 0.0% |
| State Government Employees | 9 | 23.1% |
| Federal Government Employees | 0 | 0.0% |
| Unpaid Family Workers | 0 | 0.0% |
| Total | 39 | 100.0% |
Employment Status by Age in Ozan
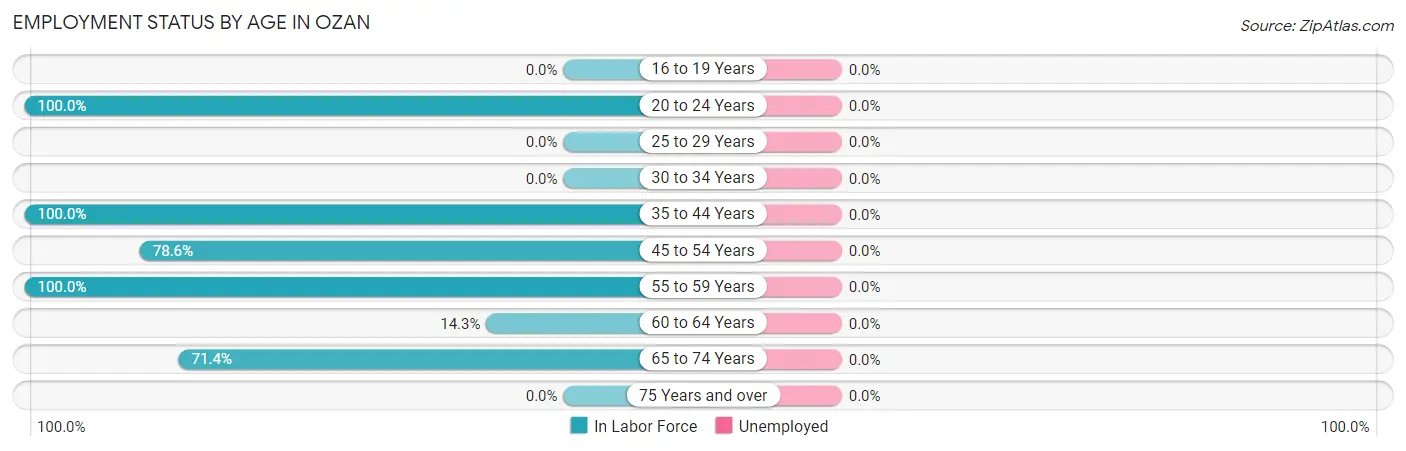
| Age Bracket | In Labor Force | Unemployed |
| 16 to 19 Years | 0 (0.0%) | 0 (0.0%) |
| 20 to 24 Years | 13 (100.0%) | 0 (0.0%) |
| 25 to 29 Years | 0 (0.0%) | 0 (0.0%) |
| 30 to 34 Years | 0 (0.0%) | 0 (0.0%) |
| 35 to 44 Years | 6 (100.0%) | 0 (0.0%) |
| 45 to 54 Years | 11 (78.6%) | 0 (0.0%) |
| 55 to 59 Years | 5 (100.0%) | 0 (0.0%) |
| 60 to 64 Years | 1 (14.3%) | 0 (0.0%) |
| 65 to 74 Years | 15 (71.4%) | 0 (0.0%) |
| 75 Years and over | 0 (0.0%) | 0 (0.0%) |
| Total | 51 (65.4%) | 0 (0.0%) |
Employment Status by Educational Attainment in Ozan
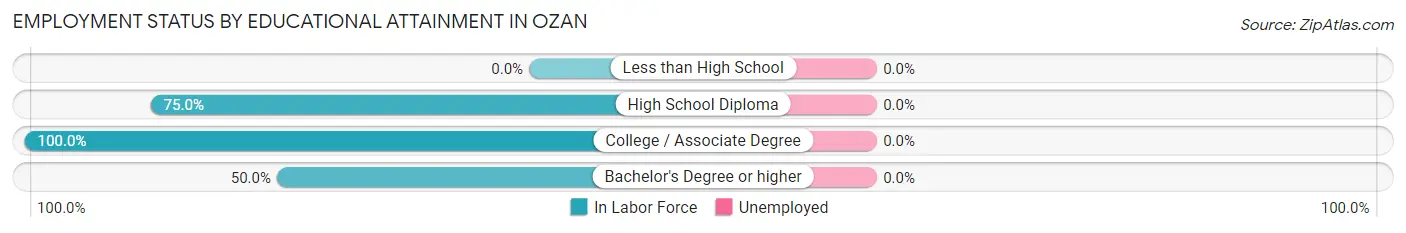
| Educational Attainment | In Labor Force | Unemployed |
| Less than High School | 0 (0.0%) | 0 (0.0%) |
| High School Diploma | 12 (75.0%) | 0 (0.0%) |
| College / Associate Degree | 6 (100.0%) | 0 (0.0%) |
| Bachelor's Degree or higher | 5 (50.0%) | 0 (0.0%) |
| Total | 23 (71.9%) | 0 (0.0%) |
Employment Occupations by Sex in Ozan
Management, Business, Science and Arts Occupations
The most common Management, Business, Science and Arts occupations in Ozan are Health Diagnosing & Treating (5 | 9.8%), Health Technologists (5 | 9.8%), and Business & Financial (1 | 2.0%).
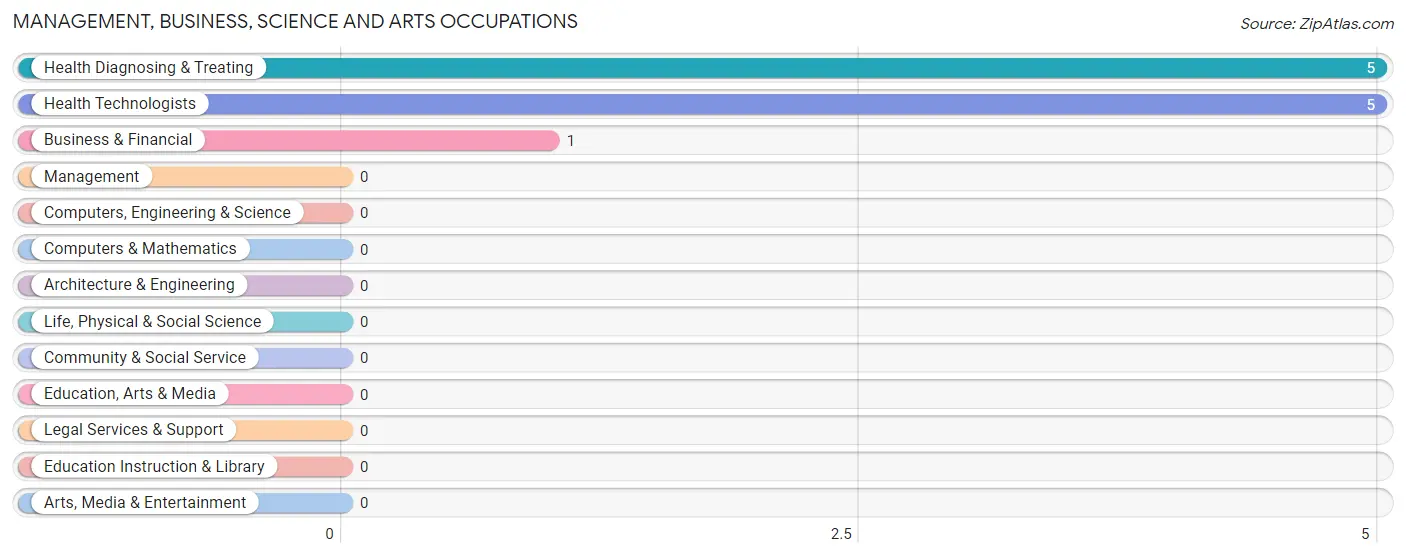
Management, Business, Science and Arts Occupations by Sex
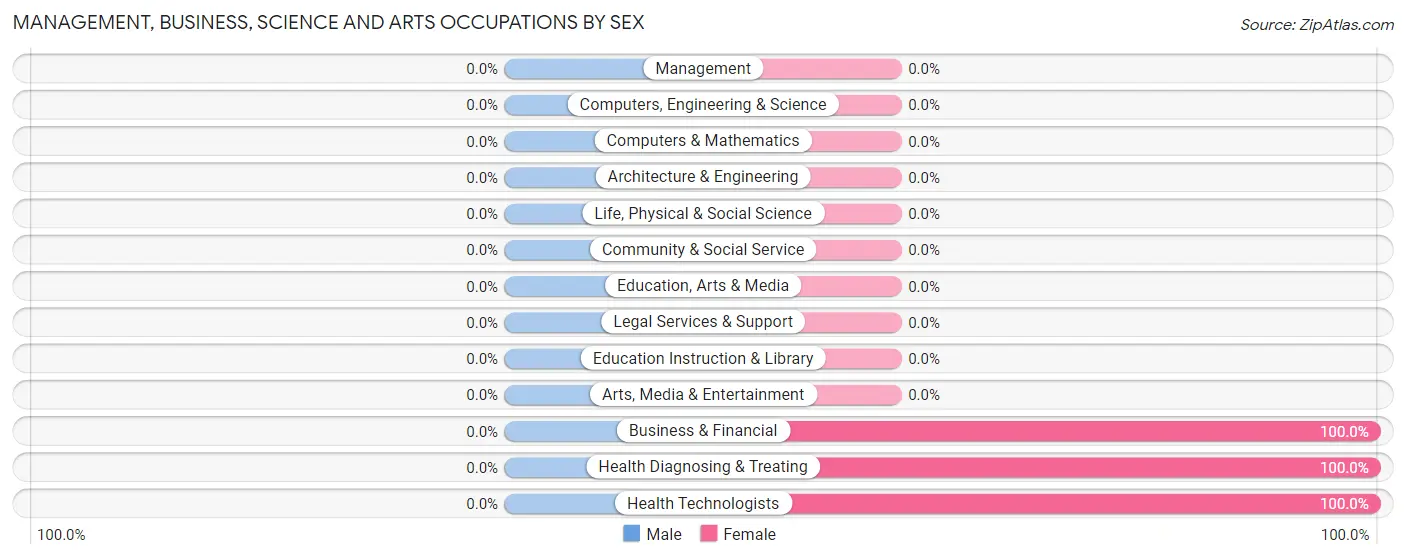
| Occupation | Male | Female |
| Management | 0 (0.0%) | 0 (0.0%) |
| Business & Financial | 0 (0.0%) | 1 (100.0%) |
| Computers, Engineering & Science | 0 (0.0%) | 0 (0.0%) |
| Computers & Mathematics | 0 (0.0%) | 0 (0.0%) |
| Architecture & Engineering | 0 (0.0%) | 0 (0.0%) |
| Life, Physical & Social Science | 0 (0.0%) | 0 (0.0%) |
| Community & Social Service | 0 (0.0%) | 0 (0.0%) |
| Education, Arts & Media | 0 (0.0%) | 0 (0.0%) |
| Legal Services & Support | 0 (0.0%) | 0 (0.0%) |
| Education Instruction & Library | 0 (0.0%) | 0 (0.0%) |
| Arts, Media & Entertainment | 0 (0.0%) | 0 (0.0%) |
| Health Diagnosing & Treating | 0 (0.0%) | 5 (100.0%) |
| Health Technologists | 0 (0.0%) | 5 (100.0%) |
| Total (Category) | 0 (0.0%) | 6 (100.0%) |
| Total (Overall) | 20 (39.2%) | 31 (60.8%) |
Services Occupations
The most common Services occupations in Ozan are , and Food Preparation & Serving (7 | 13.7%).
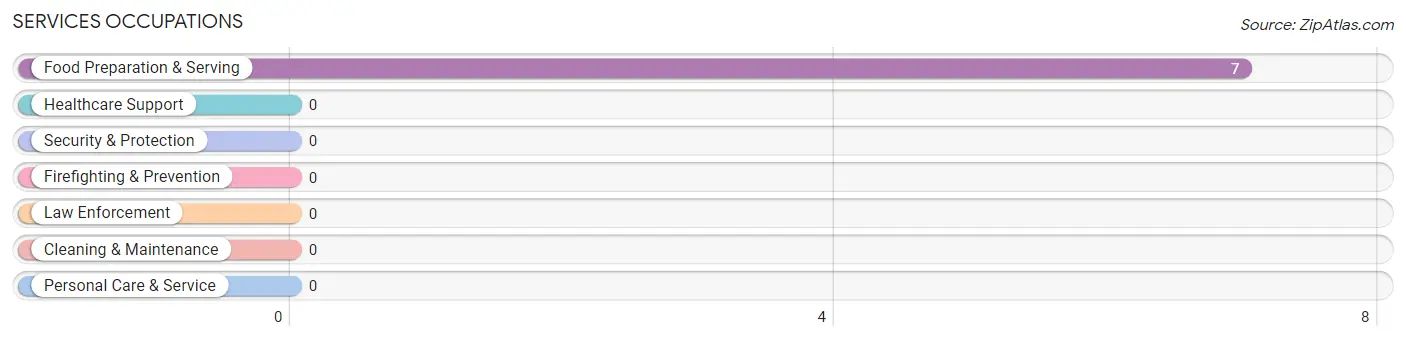
Services Occupations by Sex
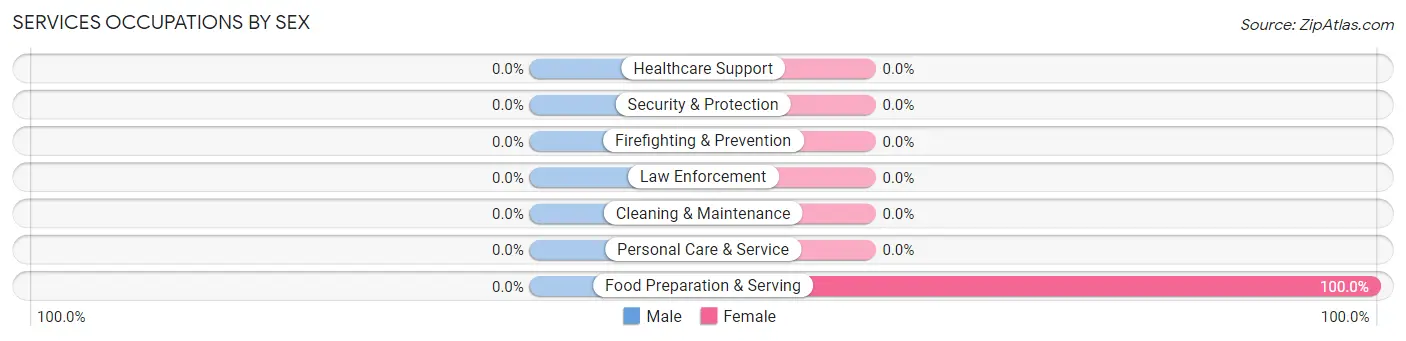
| Occupation | Male | Female |
| Healthcare Support | 0 (0.0%) | 0 (0.0%) |
| Security & Protection | 0 (0.0%) | 0 (0.0%) |
| Firefighting & Prevention | 0 (0.0%) | 0 (0.0%) |
| Law Enforcement | 0 (0.0%) | 0 (0.0%) |
| Food Preparation & Serving | 0 (0.0%) | 7 (100.0%) |
| Cleaning & Maintenance | 0 (0.0%) | 0 (0.0%) |
| Personal Care & Service | 0 (0.0%) | 0 (0.0%) |
| Total (Category) | 0 (0.0%) | 7 (100.0%) |
| Total (Overall) | 20 (39.2%) | 31 (60.8%) |
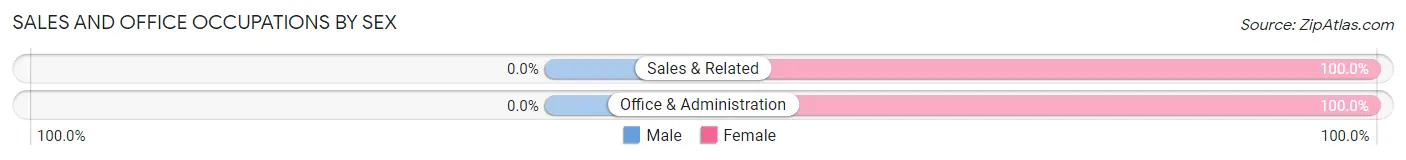
Sales and Office Occupations
The most common Sales and Office occupations in Ozan are Sales & Related (6 | 11.8%), and Office & Administration (6 | 11.8%).
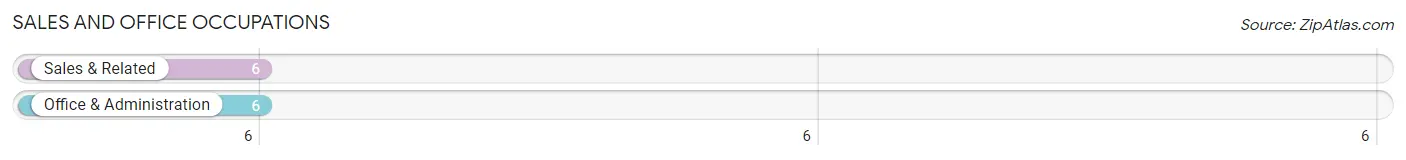
Sales and Office Occupations by Sex
| Occupation | Male | Female |
| Sales & Related | 0 (0.0%) | 6 (100.0%) |
| Office & Administration | 0 (0.0%) | 6 (100.0%) |
| Total (Category) | 0 (0.0%) | 12 (100.0%) |
| Total (Overall) | 20 (39.2%) | 31 (60.8%) |
Natural Resources, Construction and Maintenance Occupations
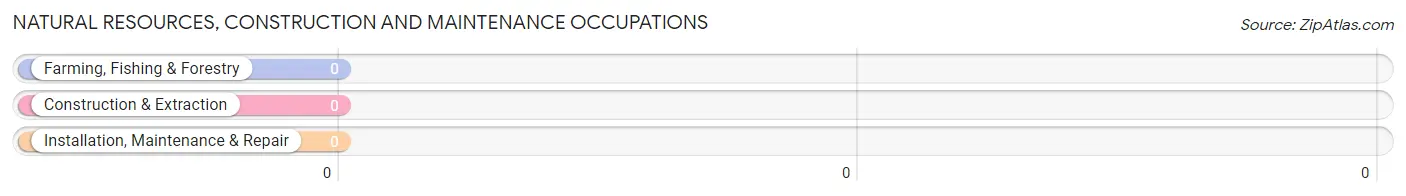
Natural Resources, Construction and Maintenance Occupations by Sex
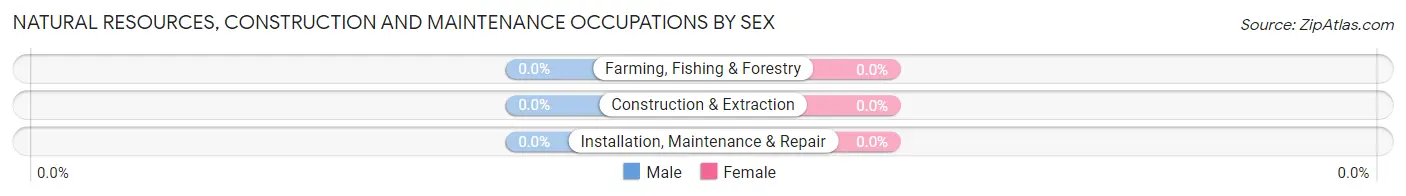
| Occupation | Male | Female |
| Farming, Fishing & Forestry | 0 (0.0%) | 0 (0.0%) |
| Construction & Extraction | 0 (0.0%) | 0 (0.0%) |
| Installation, Maintenance & Repair | 0 (0.0%) | 0 (0.0%) |
| Total (Category) | 0 (0.0%) | 0 (0.0%) |
| Total (Overall) | 20 (39.2%) | 31 (60.8%) |
Production, Transportation and Moving Occupations
The most common Production, Transportation and Moving occupations in Ozan are Material Moving (12 | 23.5%), Transportation (9 | 17.6%), and Production (5 | 9.8%).
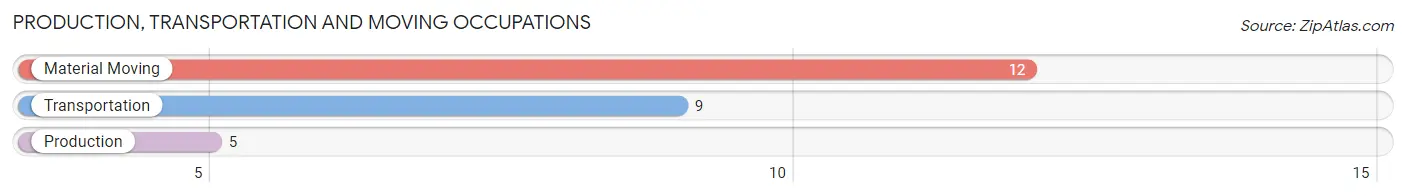
Production, Transportation and Moving Occupations by Sex
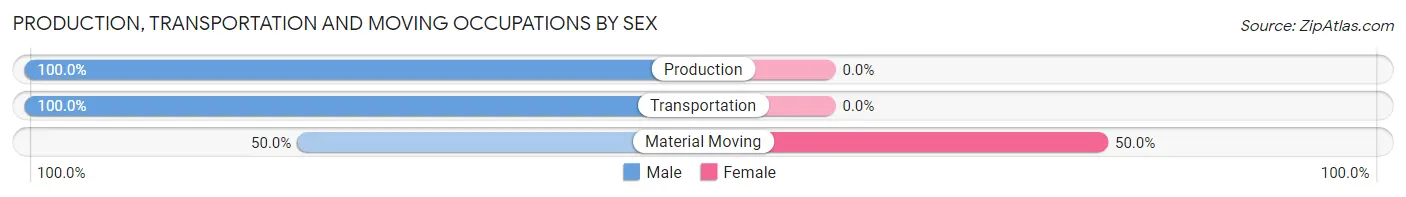
| Occupation | Male | Female |
| Production | 5 (100.0%) | 0 (0.0%) |
| Transportation | 9 (100.0%) | 0 (0.0%) |
| Material Moving | 6 (50.0%) | 6 (50.0%) |
| Total (Category) | 20 (76.9%) | 6 (23.1%) |
| Total (Overall) | 20 (39.2%) | 31 (60.8%) |
Employment Industries by Sex in Ozan
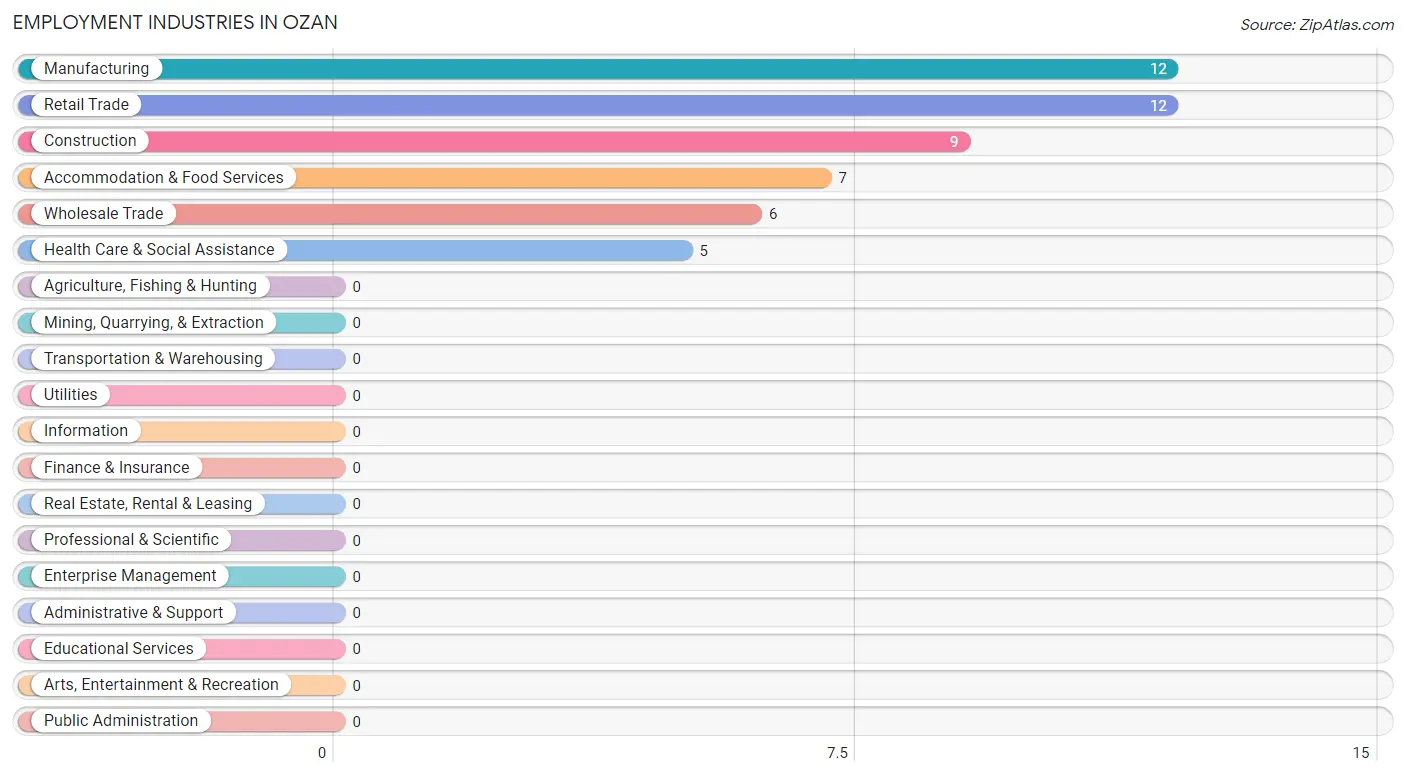
Employment Industries in Ozan
The major employment industries in Ozan include Manufacturing (12 | 23.5%), Retail Trade (12 | 23.5%), Construction (9 | 17.6%), Accommodation & Food Services (7 | 13.7%), and Wholesale Trade (6 | 11.8%).
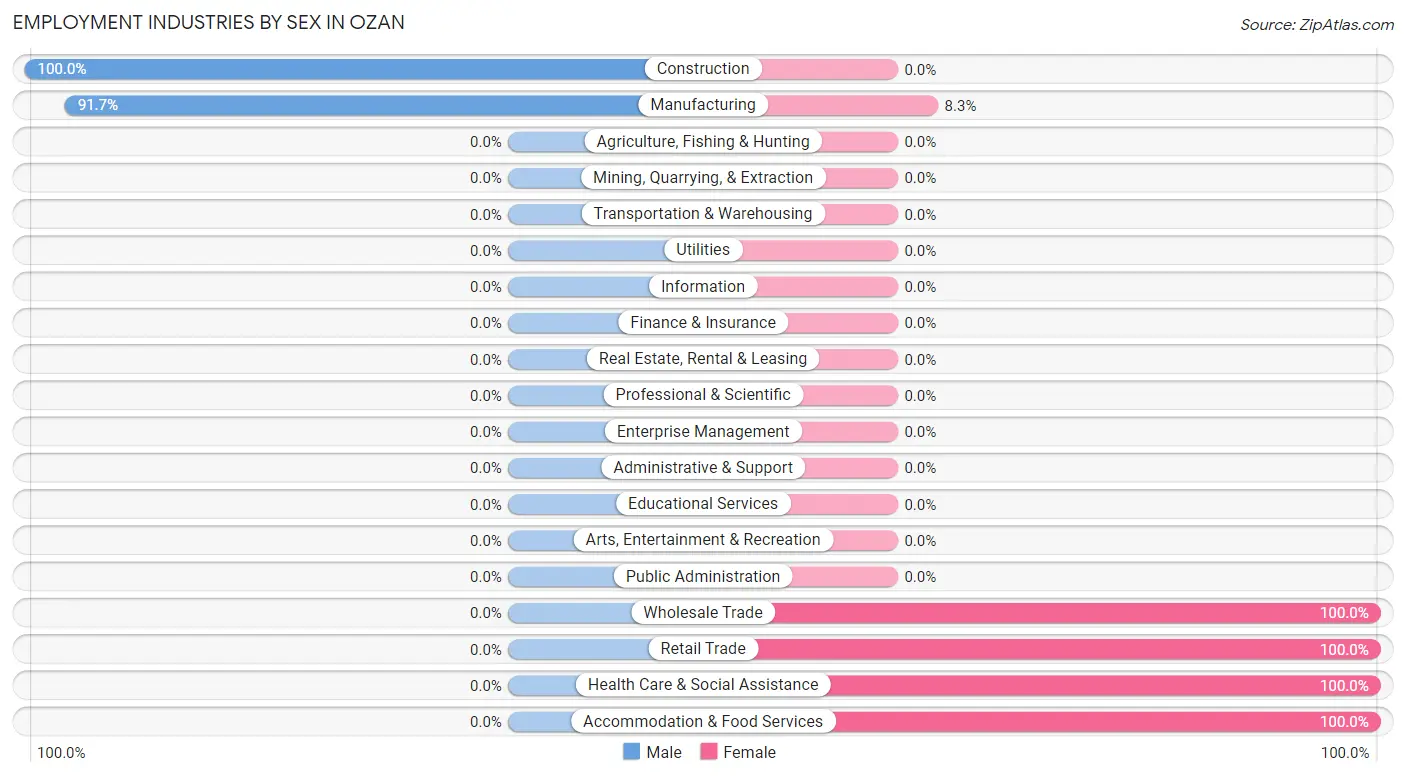
Employment Industries by Sex in Ozan
The Ozan industries that see more men than women are Construction (100.0%), and Manufacturing (91.7%), whereas the industries that tend to have a higher number of women are Wholesale Trade (100.0%), Retail Trade (100.0%), and Health Care & Social Assistance (100.0%).
| Industry | Male | Female |
| Agriculture, Fishing & Hunting | 0 (0.0%) | 0 (0.0%) |
| Mining, Quarrying, & Extraction | 0 (0.0%) | 0 (0.0%) |
| Construction | 9 (100.0%) | 0 (0.0%) |
| Manufacturing | 11 (91.7%) | 1 (8.3%) |
| Wholesale Trade | 0 (0.0%) | 6 (100.0%) |
| Retail Trade | 0 (0.0%) | 12 (100.0%) |
| Transportation & Warehousing | 0 (0.0%) | 0 (0.0%) |
| Utilities | 0 (0.0%) | 0 (0.0%) |
| Information | 0 (0.0%) | 0 (0.0%) |
| Finance & Insurance | 0 (0.0%) | 0 (0.0%) |
| Real Estate, Rental & Leasing | 0 (0.0%) | 0 (0.0%) |
| Professional & Scientific | 0 (0.0%) | 0 (0.0%) |
| Enterprise Management | 0 (0.0%) | 0 (0.0%) |
| Administrative & Support | 0 (0.0%) | 0 (0.0%) |
| Educational Services | 0 (0.0%) | 0 (0.0%) |
| Health Care & Social Assistance | 0 (0.0%) | 5 (100.0%) |
| Arts, Entertainment & Recreation | 0 (0.0%) | 0 (0.0%) |
| Accommodation & Food Services | 0 (0.0%) | 7 (100.0%) |
| Public Administration | 0 (0.0%) | 0 (0.0%) |
| Total | 20 (39.2%) | 31 (60.8%) |
Education in Ozan
School Enrollment in Ozan
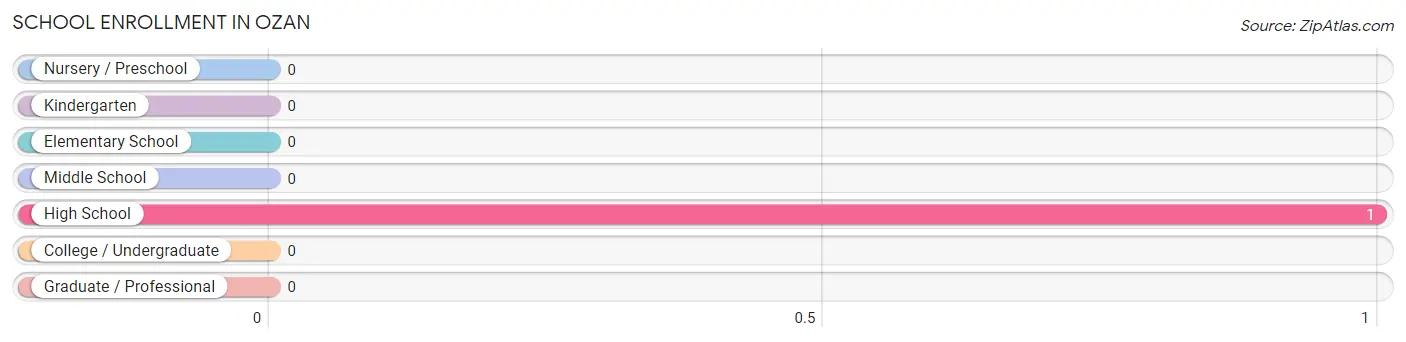
| School Level | # Students | % Students |
| Nursery / Preschool | 0 | 0.0% |
| Kindergarten | 0 | 0.0% |
| Elementary School | 0 | 0.0% |
| Middle School | 0 | 0.0% |
| High School | 1 | 100.0% |
| College / Undergraduate | 0 | 0.0% |
| Graduate / Professional | 0 | 0.0% |
| Total | 1 | 100.0% |
School Enrollment by Age by Funding Source in Ozan
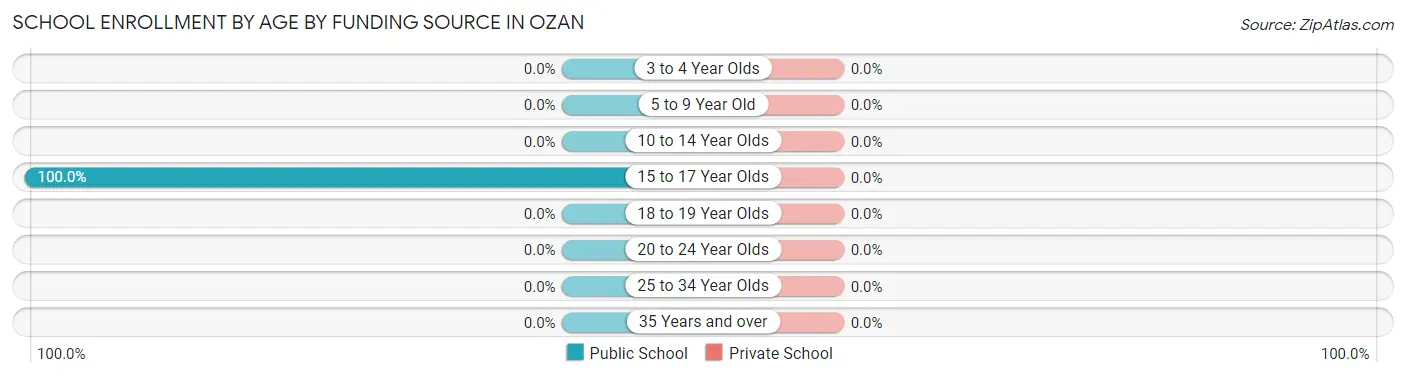
| Age Bracket | Public School | Private School |
| 3 to 4 Year Olds | 0 (0.0%) | 0 (0.0%) |
| 5 to 9 Year Old | 0 (0.0%) | 0 (0.0%) |
| 10 to 14 Year Olds | 0 (0.0%) | 0 (0.0%) |
| 15 to 17 Year Olds | 1 (100.0%) | 0 (0.0%) |
| 18 to 19 Year Olds | 0 (0.0%) | 0 (0.0%) |
| 20 to 24 Year Olds | 0 (0.0%) | 0 (0.0%) |
| 25 to 34 Year Olds | 0 (0.0%) | 0 (0.0%) |
| 35 Years and over | 0 (0.0%) | 0 (0.0%) |
| Total | 1 (100.0%) | 0 (0.0%) |
Educational Attainment by Field of Study in Ozan
Science & technology (5 | 50.0%), and business (5 | 50.0%) are the most common fields of study among 10 individuals in Ozan who have obtained a bachelor's degree or higher.
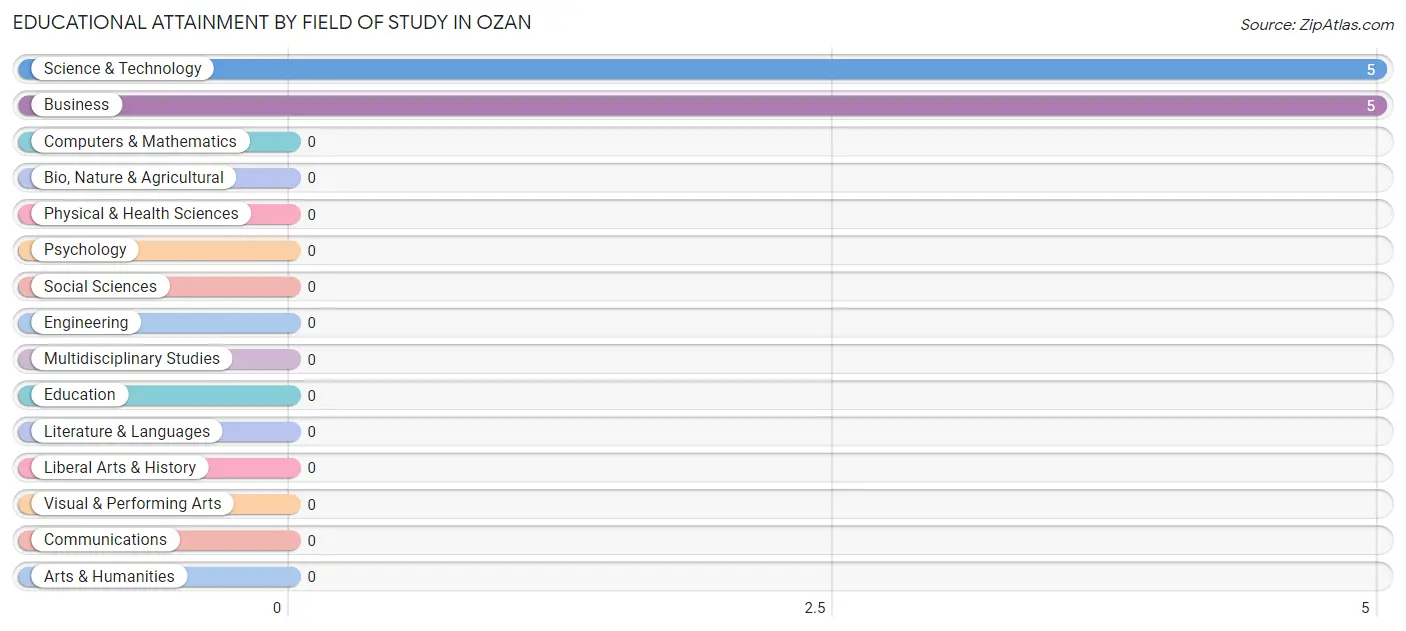
| Field of Study | # Graduates | % Graduates |
| Computers & Mathematics | 0 | 0.0% |
| Bio, Nature & Agricultural | 0 | 0.0% |
| Physical & Health Sciences | 0 | 0.0% |
| Psychology | 0 | 0.0% |
| Social Sciences | 0 | 0.0% |
| Engineering | 0 | 0.0% |
| Multidisciplinary Studies | 0 | 0.0% |
| Science & Technology | 5 | 50.0% |
| Business | 5 | 50.0% |
| Education | 0 | 0.0% |
| Literature & Languages | 0 | 0.0% |
| Liberal Arts & History | 0 | 0.0% |
| Visual & Performing Arts | 0 | 0.0% |
| Communications | 0 | 0.0% |
| Arts & Humanities | 0 | 0.0% |
| Total | 10 | 100.0% |
Transportation & Commute in Ozan
Vehicle Availability by Sex in Ozan
The most prevalent vehicle ownership categories in Ozan are males with 3 vehicles (9, accounting for 45.0%) and females with 3 vehicles (1, making up 47.4%).
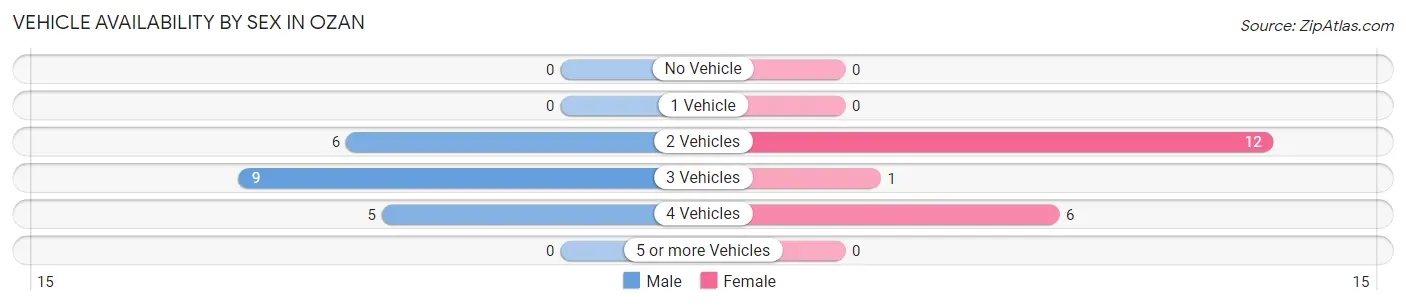
| Vehicles Available | Male | Female |
| No Vehicle | 0 (0.0%) | 0 (0.0%) |
| 1 Vehicle | 0 (0.0%) | 0 (0.0%) |
| 2 Vehicles | 6 (30.0%) | 12 (63.2%) |
| 3 Vehicles | 9 (45.0%) | 1 (5.3%) |
| 4 Vehicles | 5 (25.0%) | 6 (31.6%) |
| 5 or more Vehicles | 0 (0.0%) | 0 (0.0%) |
| Total | 20 (100.0%) | 19 (100.0%) |
Commute Time in Ozan
The most frequently occuring commute durations in Ozan are 45 to 59 minutes (18 commuters, 46.2%), 20 to 24 minutes (11 commuters, 28.2%), and 30 to 34 minutes (9 commuters, 23.1%).
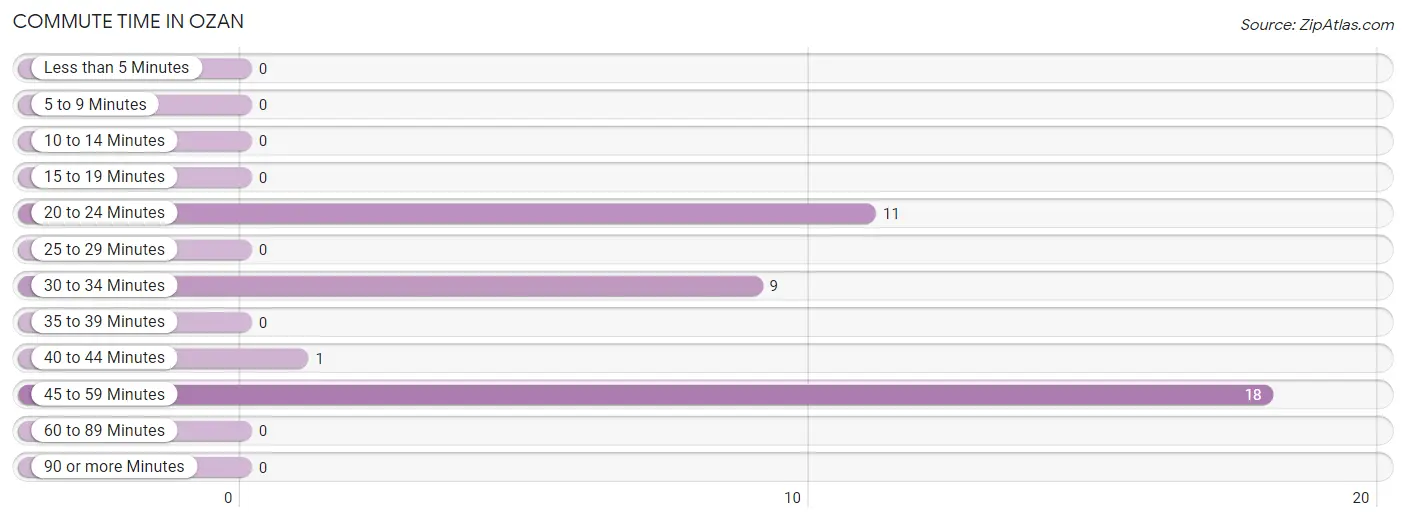
| Commute Time | # Commuters | % Commuters |
| Less than 5 Minutes | 0 | 0.0% |
| 5 to 9 Minutes | 0 | 0.0% |
| 10 to 14 Minutes | 0 | 0.0% |
| 15 to 19 Minutes | 0 | 0.0% |
| 20 to 24 Minutes | 11 | 28.2% |
| 25 to 29 Minutes | 0 | 0.0% |
| 30 to 34 Minutes | 9 | 23.1% |
| 35 to 39 Minutes | 0 | 0.0% |
| 40 to 44 Minutes | 1 | 2.6% |
| 45 to 59 Minutes | 18 | 46.2% |
| 60 to 89 Minutes | 0 | 0.0% |
| 90 or more Minutes | 0 | 0.0% |
Commute Time by Sex in Ozan
The most common commute times in Ozan are 30 to 34 minutes (9 commuters, 45.0%) for males and 45 to 59 minutes (12 commuters, 63.2%) for females.
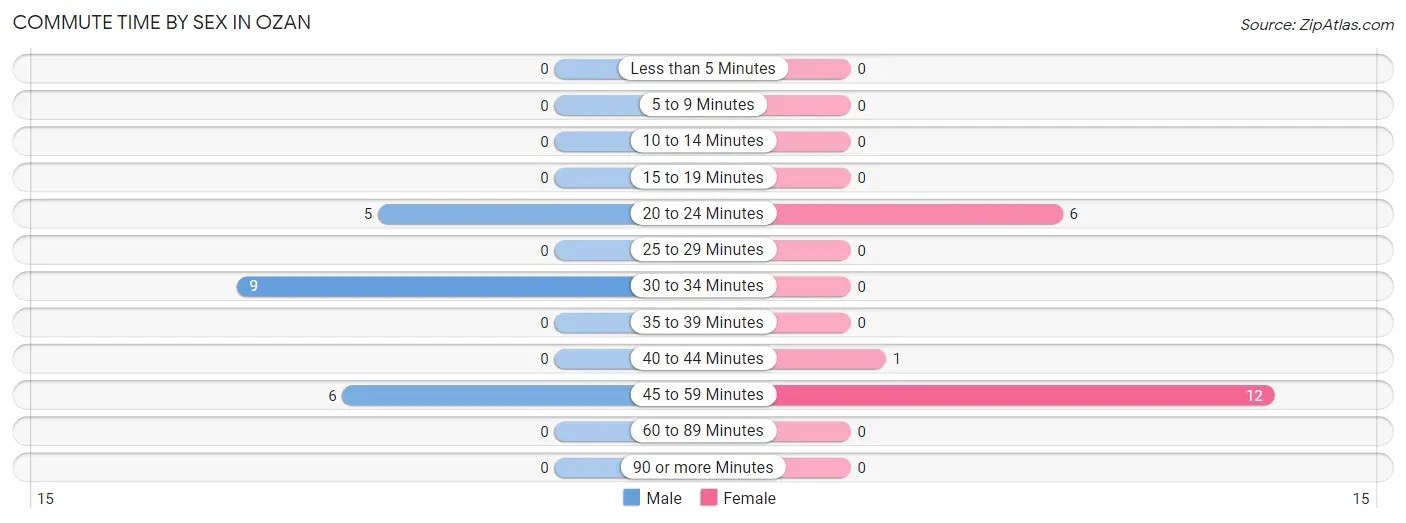
| Commute Time | Male | Female |
| Less than 5 Minutes | 0 (0.0%) | 0 (0.0%) |
| 5 to 9 Minutes | 0 (0.0%) | 0 (0.0%) |
| 10 to 14 Minutes | 0 (0.0%) | 0 (0.0%) |
| 15 to 19 Minutes | 0 (0.0%) | 0 (0.0%) |
| 20 to 24 Minutes | 5 (25.0%) | 6 (31.6%) |
| 25 to 29 Minutes | 0 (0.0%) | 0 (0.0%) |
| 30 to 34 Minutes | 9 (45.0%) | 0 (0.0%) |
| 35 to 39 Minutes | 0 (0.0%) | 0 (0.0%) |
| 40 to 44 Minutes | 0 (0.0%) | 1 (5.3%) |
| 45 to 59 Minutes | 6 (30.0%) | 12 (63.2%) |
| 60 to 89 Minutes | 0 (0.0%) | 0 (0.0%) |
| 90 or more Minutes | 0 (0.0%) | 0 (0.0%) |
Time of Departure to Work by Sex in Ozan
The most frequent times of departure to work in Ozan are 12:00 AM to 4:59 AM (11, 55.0%) for males and 4:00 PM to 11:59 PM (12, 63.2%) for females.
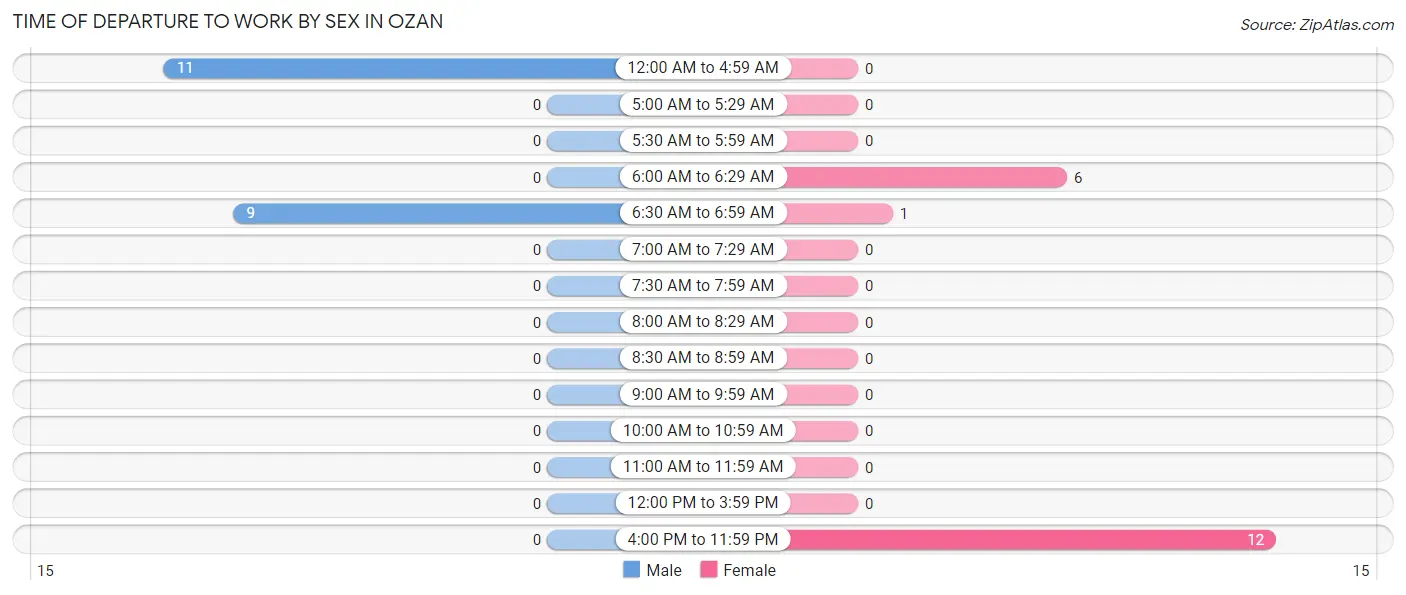
| Time of Departure | Male | Female |
| 12:00 AM to 4:59 AM | 11 (55.0%) | 0 (0.0%) |
| 5:00 AM to 5:29 AM | 0 (0.0%) | 0 (0.0%) |
| 5:30 AM to 5:59 AM | 0 (0.0%) | 0 (0.0%) |
| 6:00 AM to 6:29 AM | 0 (0.0%) | 6 (31.6%) |
| 6:30 AM to 6:59 AM | 9 (45.0%) | 1 (5.3%) |
| 7:00 AM to 7:29 AM | 0 (0.0%) | 0 (0.0%) |
| 7:30 AM to 7:59 AM | 0 (0.0%) | 0 (0.0%) |
| 8:00 AM to 8:29 AM | 0 (0.0%) | 0 (0.0%) |
| 8:30 AM to 8:59 AM | 0 (0.0%) | 0 (0.0%) |
| 9:00 AM to 9:59 AM | 0 (0.0%) | 0 (0.0%) |
| 10:00 AM to 10:59 AM | 0 (0.0%) | 0 (0.0%) |
| 11:00 AM to 11:59 AM | 0 (0.0%) | 0 (0.0%) |
| 12:00 PM to 3:59 PM | 0 (0.0%) | 0 (0.0%) |
| 4:00 PM to 11:59 PM | 0 (0.0%) | 12 (63.2%) |
| Total | 20 (100.0%) | 19 (100.0%) |
Housing Occupancy in Ozan
Occupancy by Ownership in Ozan
Of the total 42 dwellings in Ozan, owner-occupied units account for 36 (85.7%), while renter-occupied units make up 6 (14.3%).
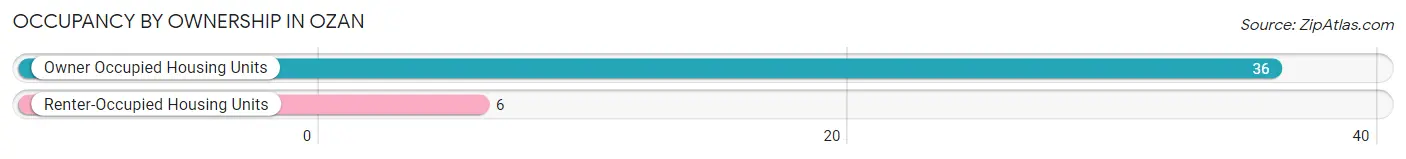
| Occupancy | # Housing Units | % Housing Units |
| Owner Occupied Housing Units | 36 | 85.7% |
| Renter-Occupied Housing Units | 6 | 14.3% |
| Total Occupied Housing Units | 42 | 100.0% |
Occupancy by Household Size in Ozan
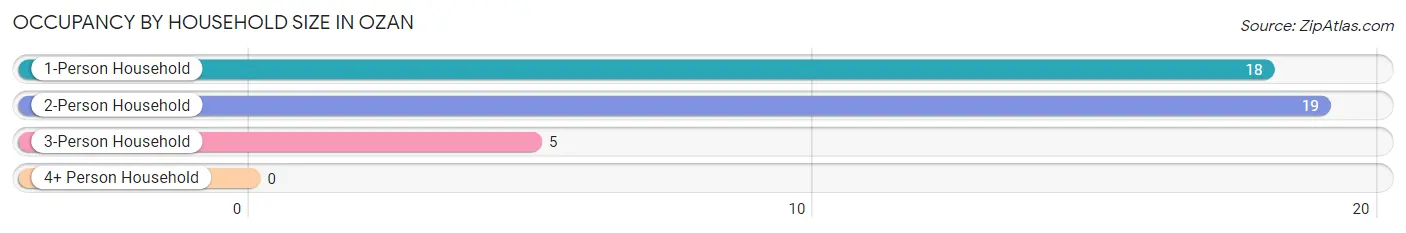
| Household Size | # Housing Units | % Housing Units |
| 1-Person Household | 18 | 42.9% |
| 2-Person Household | 19 | 45.2% |
| 3-Person Household | 5 | 11.9% |
| 4+ Person Household | 0 | 0.0% |
| Total Housing Units | 42 | 100.0% |
Occupancy by Ownership by Household Size in Ozan
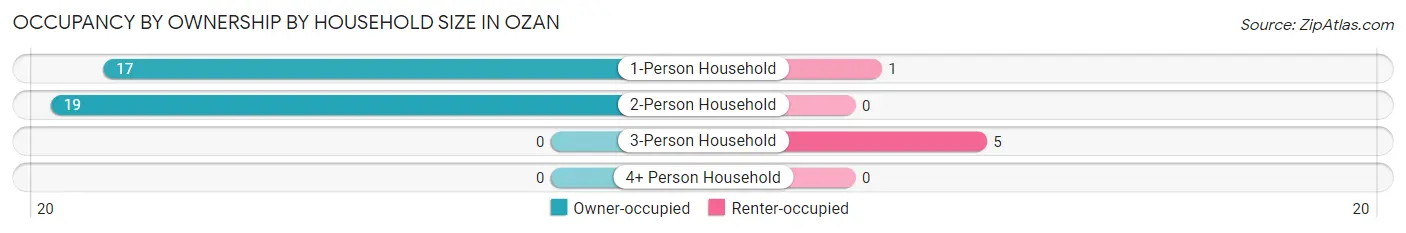
| Household Size | Owner-occupied | Renter-occupied |
| 1-Person Household | 17 (94.4%) | 1 (5.6%) |
| 2-Person Household | 19 (100.0%) | 0 (0.0%) |
| 3-Person Household | 0 (0.0%) | 5 (100.0%) |
| 4+ Person Household | 0 (0.0%) | 0 (0.0%) |
| Total Housing Units | 36 (85.7%) | 6 (14.3%) |
Occupancy by Educational Attainment in Ozan
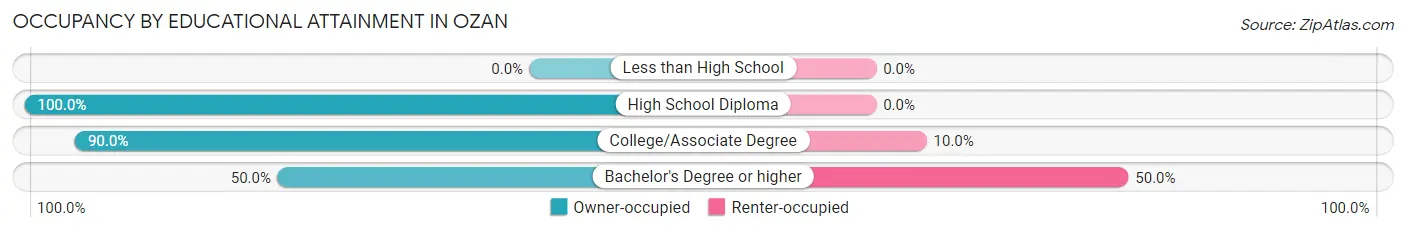
| Household Size | Owner-occupied | Renter-occupied |
| Less than High School | 0 (0.0%) | 0 (0.0%) |
| High School Diploma | 22 (100.0%) | 0 (0.0%) |
| College/Associate Degree | 9 (90.0%) | 1 (10.0%) |
| Bachelor's Degree or higher | 5 (50.0%) | 5 (50.0%) |
Occupancy by Age of Householder in Ozan
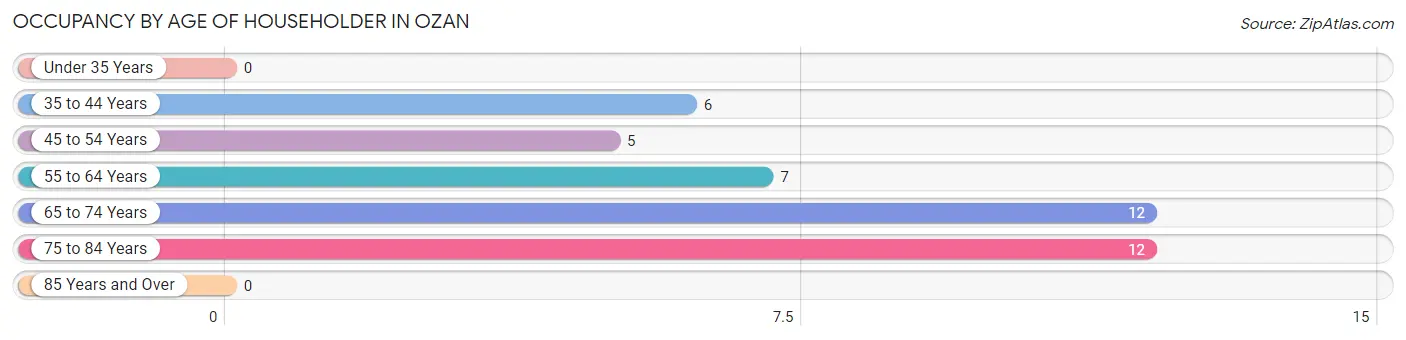
| Age Bracket | # Households | % Households |
| Under 35 Years | 0 | 0.0% |
| 35 to 44 Years | 6 | 14.3% |
| 45 to 54 Years | 5 | 11.9% |
| 55 to 64 Years | 7 | 16.7% |
| 65 to 74 Years | 12 | 28.6% |
| 75 to 84 Years | 12 | 28.6% |
| 85 Years and Over | 0 | 0.0% |
| Total | 42 | 100.0% |
Housing Finances in Ozan
Median Income by Occupancy in Ozan
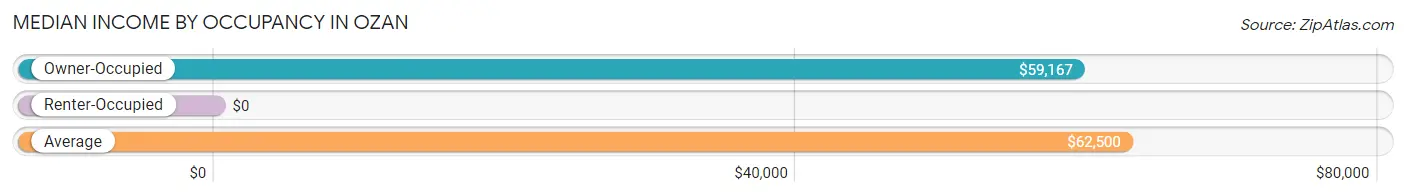
| Occupancy Type | # Households | Median Income |
| Owner-Occupied | 36 (85.7%) | $59,167 |
| Renter-Occupied | 6 (14.3%) | $0 |
| Average | 42 (100.0%) | $62,500 |
Occupancy by Householder Income Bracket in Ozan
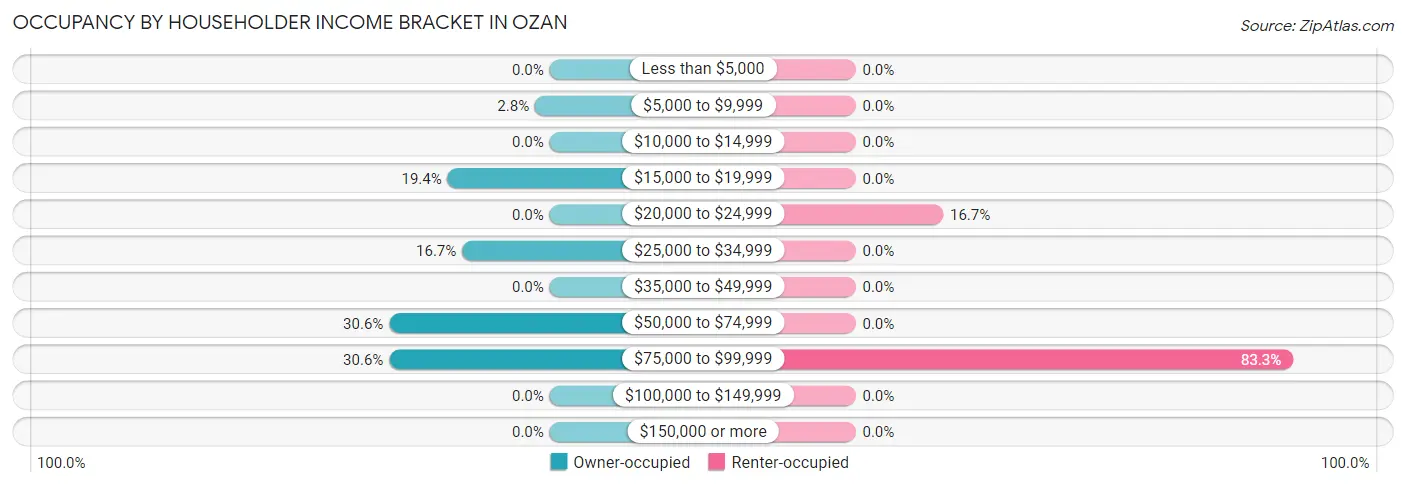
| Income Bracket | Owner-occupied | Renter-occupied |
| Less than $5,000 | 0 (0.0%) | 0 (0.0%) |
| $5,000 to $9,999 | 1 (2.8%) | 0 (0.0%) |
| $10,000 to $14,999 | 0 (0.0%) | 0 (0.0%) |
| $15,000 to $19,999 | 7 (19.4%) | 0 (0.0%) |
| $20,000 to $24,999 | 0 (0.0%) | 1 (16.7%) |
| $25,000 to $34,999 | 6 (16.7%) | 0 (0.0%) |
| $35,000 to $49,999 | 0 (0.0%) | 0 (0.0%) |
| $50,000 to $74,999 | 11 (30.6%) | 0 (0.0%) |
| $75,000 to $99,999 | 11 (30.6%) | 5 (83.3%) |
| $100,000 to $149,999 | 0 (0.0%) | 0 (0.0%) |
| $150,000 or more | 0 (0.0%) | 0 (0.0%) |
| Total | 36 (100.0%) | 6 (100.0%) |
Monthly Housing Cost Tiers in Ozan
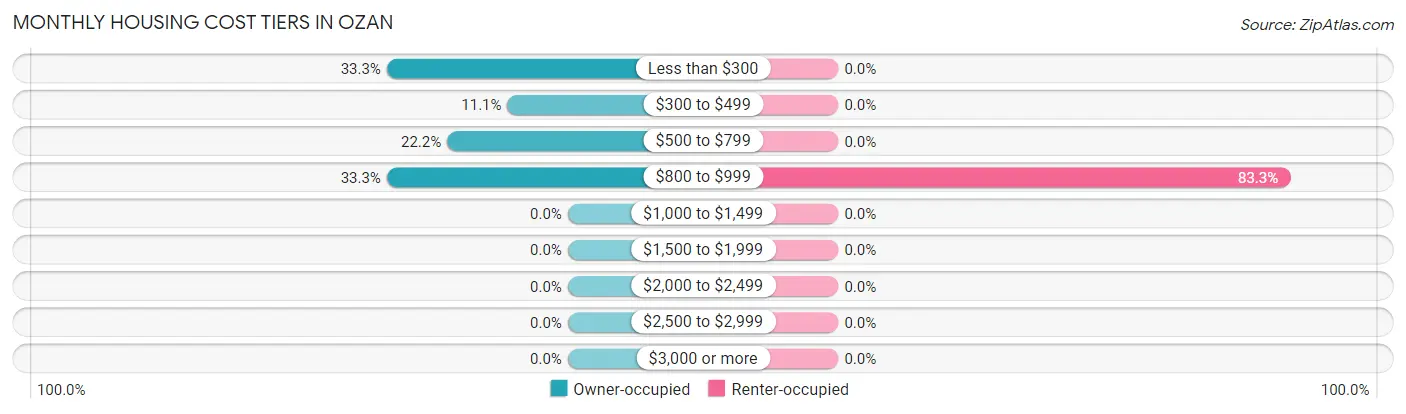
| Monthly Cost | Owner-occupied | Renter-occupied |
| Less than $300 | 12 (33.3%) | 0 (0.0%) |
| $300 to $499 | 4 (11.1%) | 0 (0.0%) |
| $500 to $799 | 8 (22.2%) | 0 (0.0%) |
| $800 to $999 | 12 (33.3%) | 5 (83.3%) |
| $1,000 to $1,499 | 0 (0.0%) | 0 (0.0%) |
| $1,500 to $1,999 | 0 (0.0%) | 0 (0.0%) |
| $2,000 to $2,499 | 0 (0.0%) | 0 (0.0%) |
| $2,500 to $2,999 | 0 (0.0%) | 0 (0.0%) |
| $3,000 or more | 0 (0.0%) | 0 (0.0%) |
| Total | 36 (100.0%) | 6 (100.0%) |
Physical Housing Characteristics in Ozan
Housing Structures in Ozan
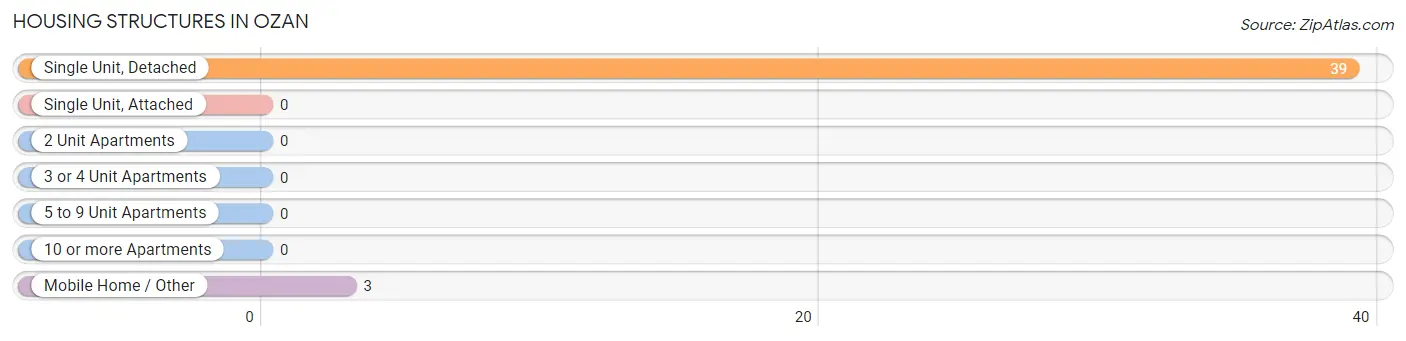
| Structure Type | # Housing Units | % Housing Units |
| Single Unit, Detached | 39 | 92.9% |
| Single Unit, Attached | 0 | 0.0% |
| 2 Unit Apartments | 0 | 0.0% |
| 3 or 4 Unit Apartments | 0 | 0.0% |
| 5 to 9 Unit Apartments | 0 | 0.0% |
| 10 or more Apartments | 0 | 0.0% |
| Mobile Home / Other | 3 | 7.1% |
| Total | 42 | 100.0% |
Housing Structures by Occupancy in Ozan
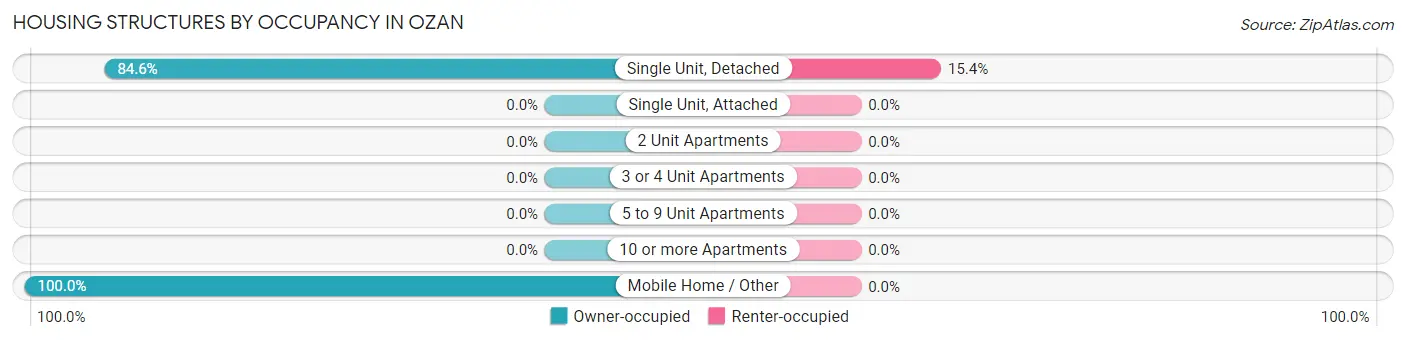
| Structure Type | Owner-occupied | Renter-occupied |
| Single Unit, Detached | 33 (84.6%) | 6 (15.4%) |
| Single Unit, Attached | 0 (0.0%) | 0 (0.0%) |
| 2 Unit Apartments | 0 (0.0%) | 0 (0.0%) |
| 3 or 4 Unit Apartments | 0 (0.0%) | 0 (0.0%) |
| 5 to 9 Unit Apartments | 0 (0.0%) | 0 (0.0%) |
| 10 or more Apartments | 0 (0.0%) | 0 (0.0%) |
| Mobile Home / Other | 3 (100.0%) | 0 (0.0%) |
| Total | 36 (85.7%) | 6 (14.3%) |
Housing Structures by Number of Rooms in Ozan
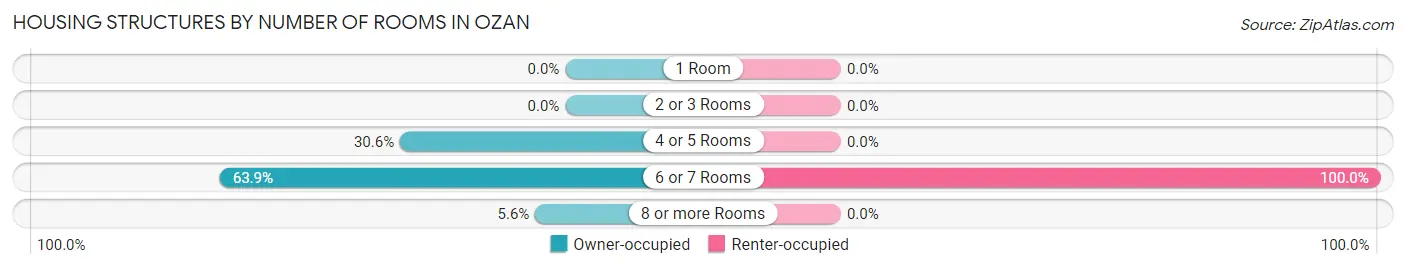
| Number of Rooms | Owner-occupied | Renter-occupied |
| 1 Room | 0 (0.0%) | 0 (0.0%) |
| 2 or 3 Rooms | 0 (0.0%) | 0 (0.0%) |
| 4 or 5 Rooms | 11 (30.6%) | 0 (0.0%) |
| 6 or 7 Rooms | 23 (63.9%) | 6 (100.0%) |
| 8 or more Rooms | 2 (5.6%) | 0 (0.0%) |
| Total | 36 (100.0%) | 6 (100.0%) |
Housing Structure by Heating Type in Ozan
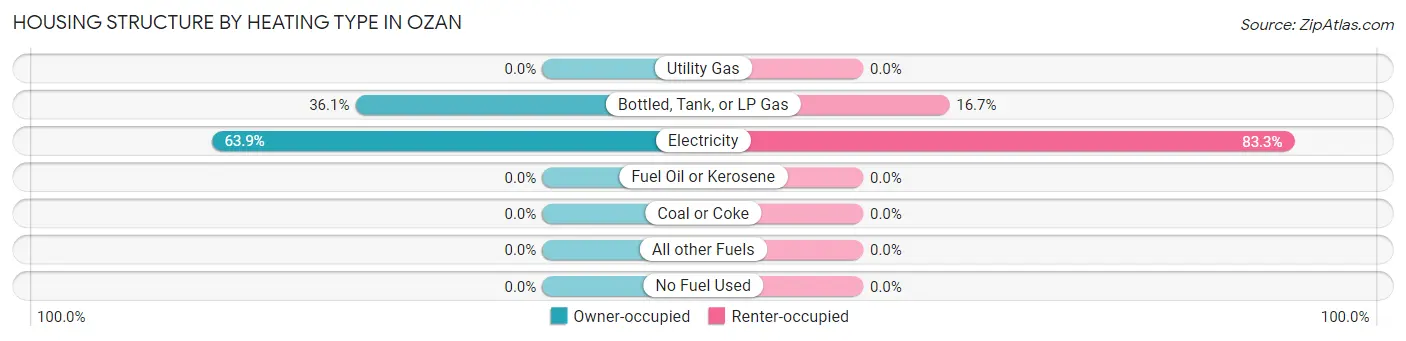
| Heating Type | Owner-occupied | Renter-occupied |
| Utility Gas | 0 (0.0%) | 0 (0.0%) |
| Bottled, Tank, or LP Gas | 13 (36.1%) | 1 (16.7%) |
| Electricity | 23 (63.9%) | 5 (83.3%) |
| Fuel Oil or Kerosene | 0 (0.0%) | 0 (0.0%) |
| Coal or Coke | 0 (0.0%) | 0 (0.0%) |
| All other Fuels | 0 (0.0%) | 0 (0.0%) |
| No Fuel Used | 0 (0.0%) | 0 (0.0%) |
| Total | 36 (100.0%) | 6 (100.0%) |
Household Vehicle Usage in Ozan
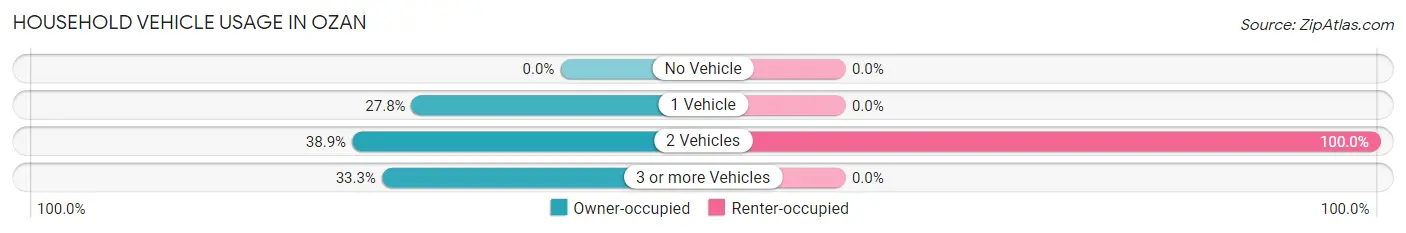
| Vehicles per Household | Owner-occupied | Renter-occupied |
| No Vehicle | 0 (0.0%) | 0 (0.0%) |
| 1 Vehicle | 10 (27.8%) | 0 (0.0%) |
| 2 Vehicles | 14 (38.9%) | 6 (100.0%) |
| 3 or more Vehicles | 12 (33.3%) | 0 (0.0%) |
| Total | 36 (100.0%) | 6 (100.0%) |
Real Estate & Mortgages in Ozan
Real Estate and Mortgage Overview in Ozan
| Characteristic | Without Mortgage | With Mortgage |
| Housing Units | 19 | 17 |
| Median Property Value | - | - |
| Median Household Income | $26,875 | $0 |
| Monthly Housing Costs | $232 | $0 |
| Real Estate Taxes | $199 | $0 |
Property Value by Mortgage Status in Ozan
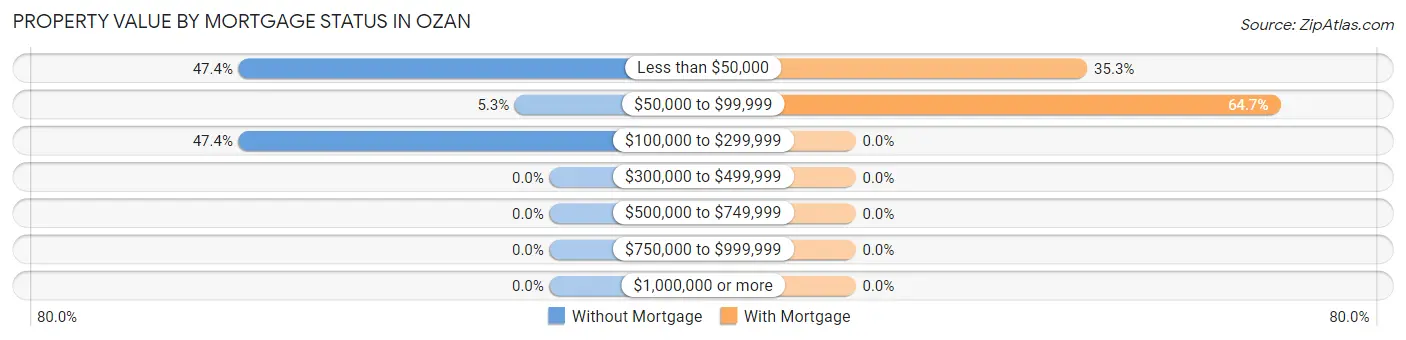
| Property Value | Without Mortgage | With Mortgage |
| Less than $50,000 | 9 (47.4%) | 6 (35.3%) |
| $50,000 to $99,999 | 1 (5.3%) | 11 (64.7%) |
| $100,000 to $299,999 | 9 (47.4%) | 0 (0.0%) |
| $300,000 to $499,999 | 0 (0.0%) | 0 (0.0%) |
| $500,000 to $749,999 | 0 (0.0%) | 0 (0.0%) |
| $750,000 to $999,999 | 0 (0.0%) | 0 (0.0%) |
| $1,000,000 or more | 0 (0.0%) | 0 (0.0%) |
| Total | 19 (100.0%) | 17 (100.0%) |
Household Income by Mortgage Status in Ozan
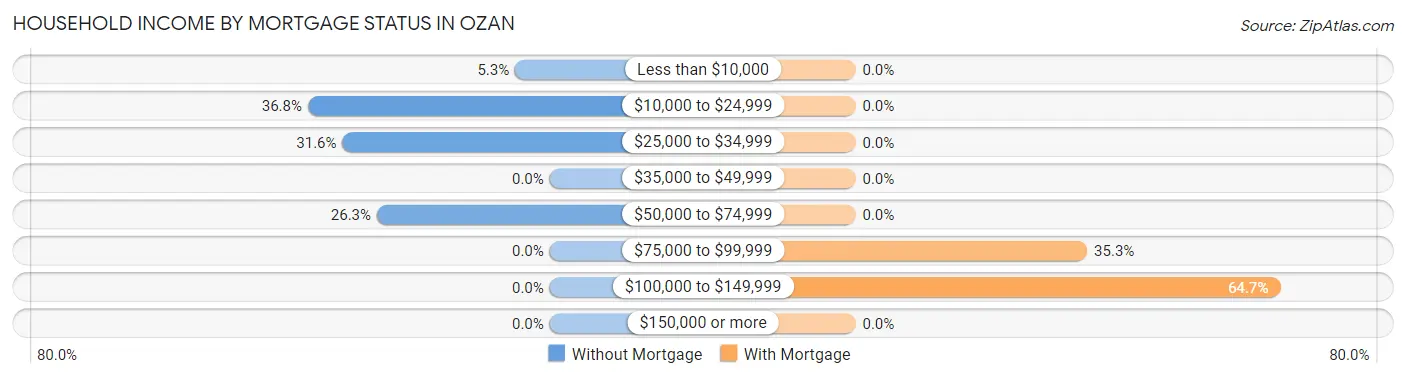
| Household Income | Without Mortgage | With Mortgage |
| Less than $10,000 | 1 (5.3%) | 0 (0.0%) |
| $10,000 to $24,999 | 7 (36.8%) | 0 (0.0%) |
| $25,000 to $34,999 | 6 (31.6%) | 0 (0.0%) |
| $35,000 to $49,999 | 0 (0.0%) | 0 (0.0%) |
| $50,000 to $74,999 | 5 (26.3%) | 0 (0.0%) |
| $75,000 to $99,999 | 0 (0.0%) | 6 (35.3%) |
| $100,000 to $149,999 | 0 (0.0%) | 11 (64.7%) |
| $150,000 or more | 0 (0.0%) | 0 (0.0%) |
| Total | 19 (100.0%) | 17 (100.0%) |
Property Value to Household Income Ratio in Ozan
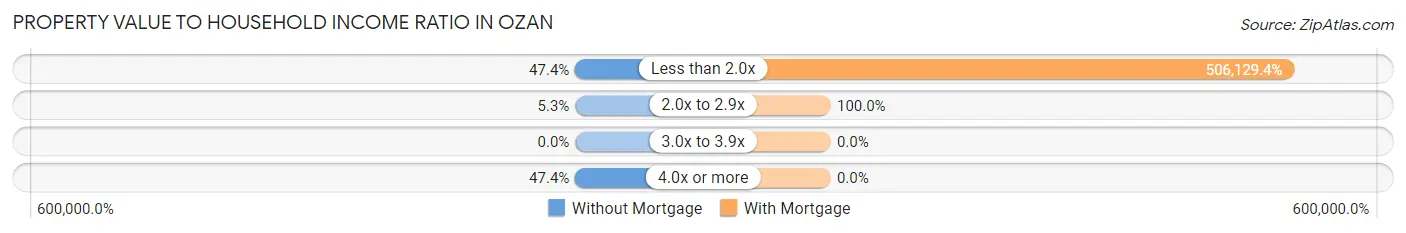
| Value-to-Income Ratio | Without Mortgage | With Mortgage |
| Less than 2.0x | 9 (47.4%) | 86,042 (506,129.4%) |
| 2.0x to 2.9x | 1 (5.3%) | 17 (100.0%) |
| 3.0x to 3.9x | 0 (0.0%) | 0 (0.0%) |
| 4.0x or more | 9 (47.4%) | 0 (0.0%) |
| Total | 19 (100.0%) | 17 (100.0%) |
Real Estate Taxes by Mortgage Status in Ozan
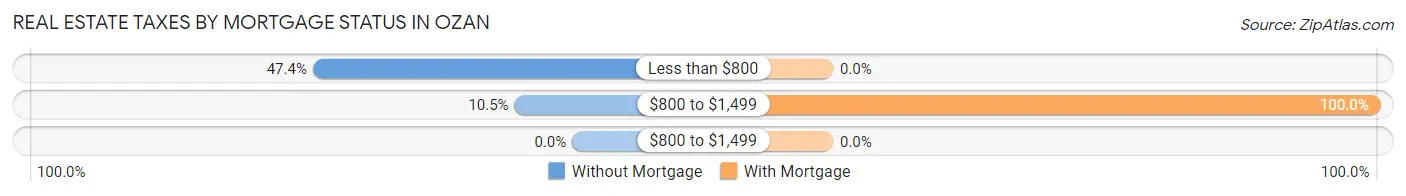
| Property Taxes | Without Mortgage | With Mortgage |
| Less than $800 | 9 (47.4%) | 0 (0.0%) |
| $800 to $1,499 | 2 (10.5%) | 17 (100.0%) |
| $800 to $1,499 | 0 (0.0%) | 0 (0.0%) |
| Total | 19 (100.0%) | 17 (100.0%) |
Health & Disability in Ozan
Health Insurance Coverage by Age in Ozan
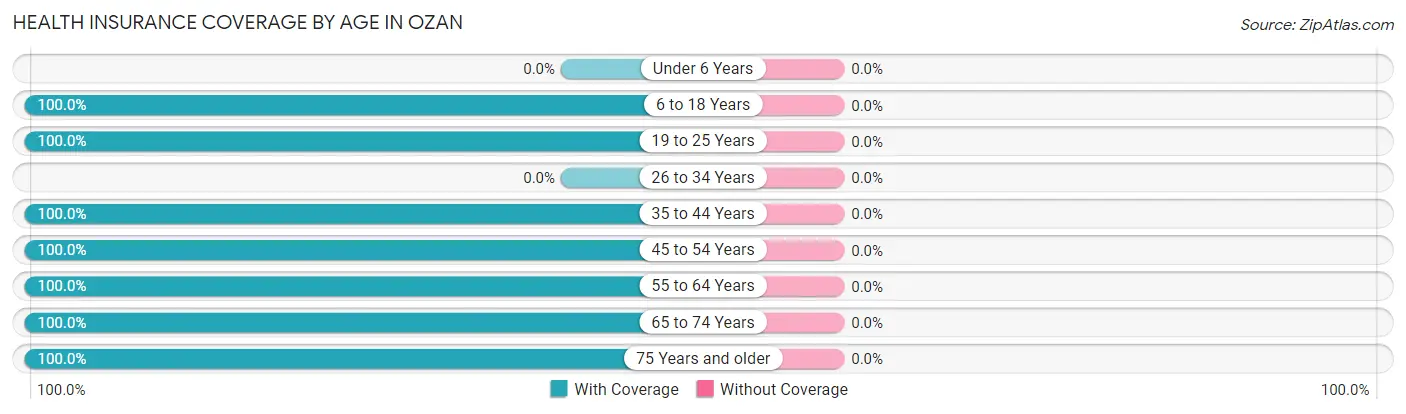
| Age Bracket | With Coverage | Without Coverage |
| Under 6 Years | 0 (0.0%) | 0 (0.0%) |
| 6 to 18 Years | 1 (100.0%) | 0 (0.0%) |
| 19 to 25 Years | 13 (100.0%) | 0 (0.0%) |
| 26 to 34 Years | 0 (0.0%) | 0 (0.0%) |
| 35 to 44 Years | 6 (100.0%) | 0 (0.0%) |
| 45 to 54 Years | 14 (100.0%) | 0 (0.0%) |
| 55 to 64 Years | 12 (100.0%) | 0 (0.0%) |
| 65 to 74 Years | 21 (100.0%) | 0 (0.0%) |
| 75 Years and older | 12 (100.0%) | 0 (0.0%) |
| Total | 79 (100.0%) | 0 (0.0%) |
Health Insurance Coverage by Citizenship Status in Ozan
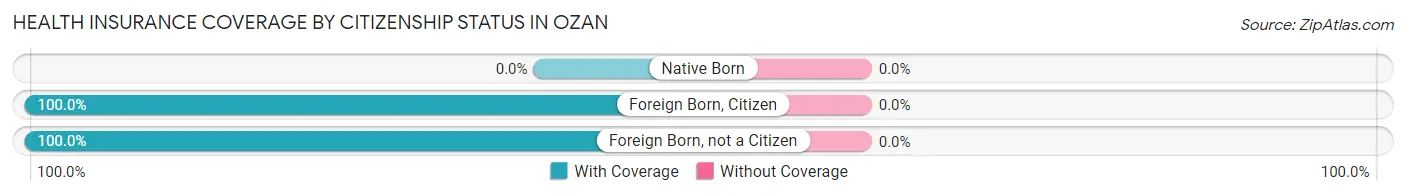
| Citizenship Status | With Coverage | Without Coverage |
| Native Born | 0 (0.0%) | 0 (0.0%) |
| Foreign Born, Citizen | 1 (100.0%) | 0 (0.0%) |
| Foreign Born, not a Citizen | 13 (100.0%) | 0 (0.0%) |
Health Insurance Coverage by Household Income in Ozan
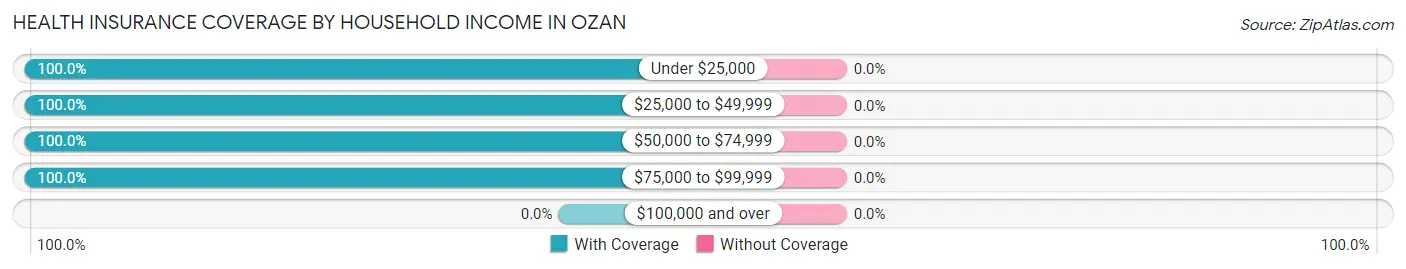
| Household Income | With Coverage | Without Coverage |
| Under $25,000 | 9 (100.0%) | 0 (0.0%) |
| $25,000 to $49,999 | 10 (100.0%) | 0 (0.0%) |
| $50,000 to $74,999 | 20 (100.0%) | 0 (0.0%) |
| $75,000 to $99,999 | 40 (100.0%) | 0 (0.0%) |
| $100,000 and over | 0 (0.0%) | 0 (0.0%) |
Public vs Private Health Insurance Coverage by Age in Ozan
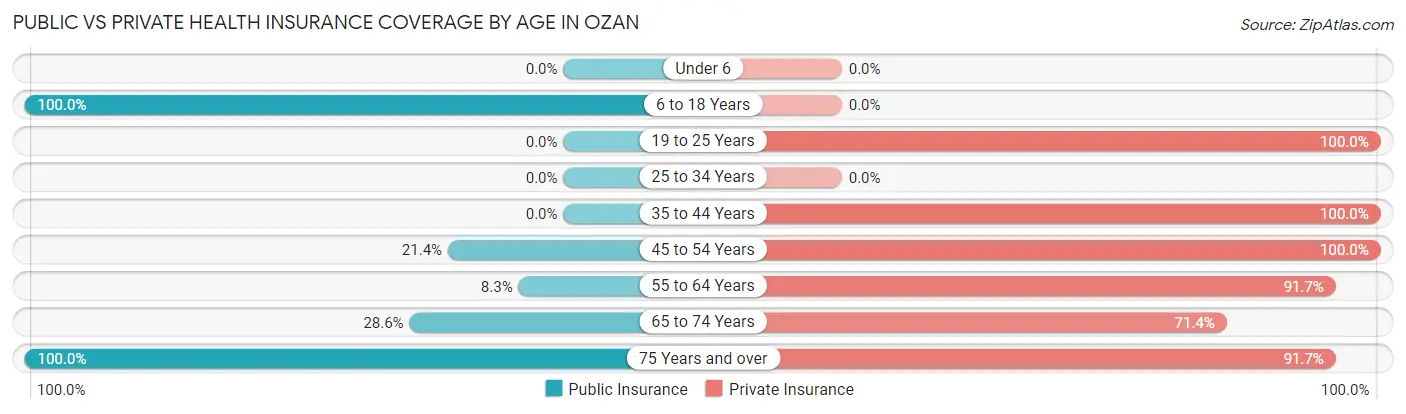
| Age Bracket | Public Insurance | Private Insurance |
| Under 6 | 0 (0.0%) | 0 (0.0%) |
| 6 to 18 Years | 1 (100.0%) | 0 (0.0%) |
| 19 to 25 Years | 0 (0.0%) | 13 (100.0%) |
| 25 to 34 Years | 0 (0.0%) | 0 (0.0%) |
| 35 to 44 Years | 0 (0.0%) | 6 (100.0%) |
| 45 to 54 Years | 3 (21.4%) | 14 (100.0%) |
| 55 to 64 Years | 1 (8.3%) | 11 (91.7%) |
| 65 to 74 Years | 6 (28.6%) | 15 (71.4%) |
| 75 Years and over | 12 (100.0%) | 11 (91.7%) |
| Total | 23 (29.1%) | 70 (88.6%) |
Disability Status by Sex by Age in Ozan
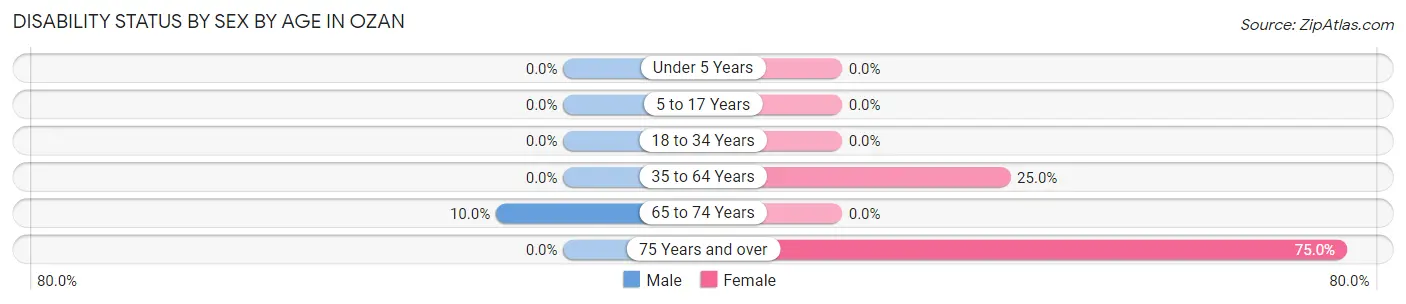
| Age Bracket | Male | Female |
| Under 5 Years | 0 (0.0%) | 0 (0.0%) |
| 5 to 17 Years | 0 (0.0%) | 0 (0.0%) |
| 18 to 34 Years | 0 (0.0%) | 0 (0.0%) |
| 35 to 64 Years | 0 (0.0%) | 4 (25.0%) |
| 65 to 74 Years | 1 (10.0%) | 0 (0.0%) |
| 75 Years and over | 0 (0.0%) | 9 (75.0%) |
Disability Class by Sex by Age in Ozan
Disability Class: Hearing Difficulty
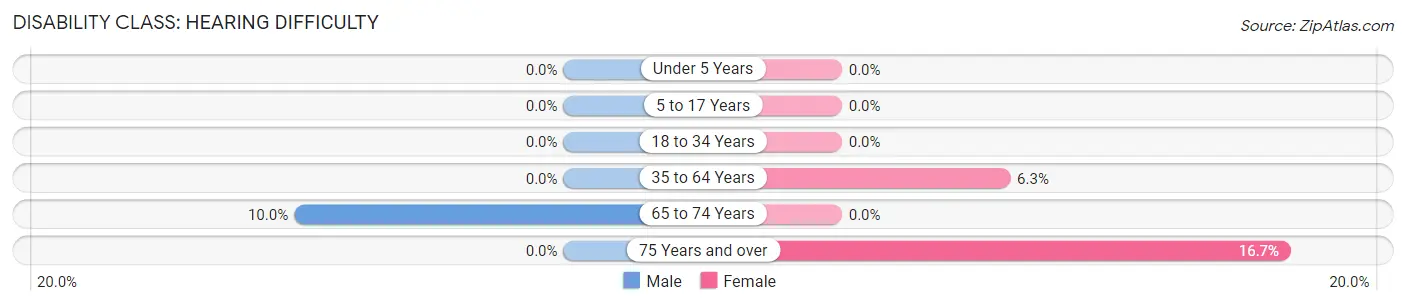
| Age Bracket | Male | Female |
| Under 5 Years | 0 (0.0%) | 0 (0.0%) |
| 5 to 17 Years | 0 (0.0%) | 0 (0.0%) |
| 18 to 34 Years | 0 (0.0%) | 0 (0.0%) |
| 35 to 64 Years | 0 (0.0%) | 1 (6.2%) |
| 65 to 74 Years | 1 (10.0%) | 0 (0.0%) |
| 75 Years and over | 0 (0.0%) | 2 (16.7%) |
Disability Class: Vision Difficulty
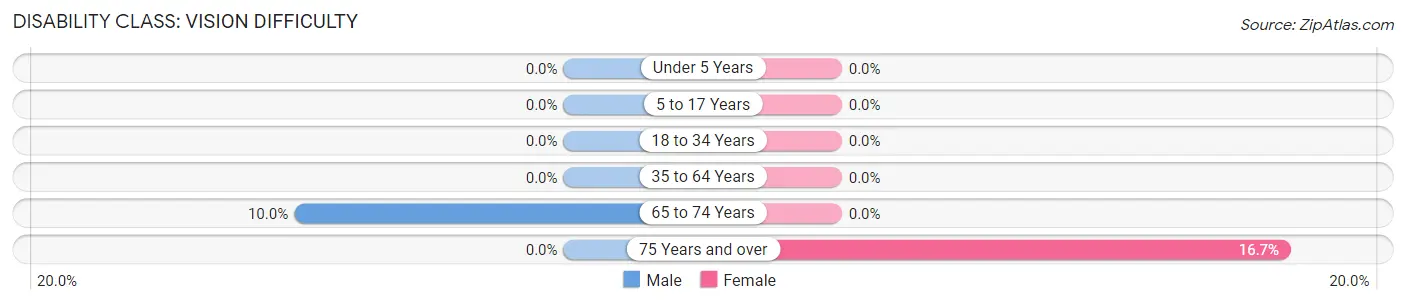
| Age Bracket | Male | Female |
| Under 5 Years | 0 (0.0%) | 0 (0.0%) |
| 5 to 17 Years | 0 (0.0%) | 0 (0.0%) |
| 18 to 34 Years | 0 (0.0%) | 0 (0.0%) |
| 35 to 64 Years | 0 (0.0%) | 0 (0.0%) |
| 65 to 74 Years | 1 (10.0%) | 0 (0.0%) |
| 75 Years and over | 0 (0.0%) | 2 (16.7%) |
Disability Class: Cognitive Difficulty
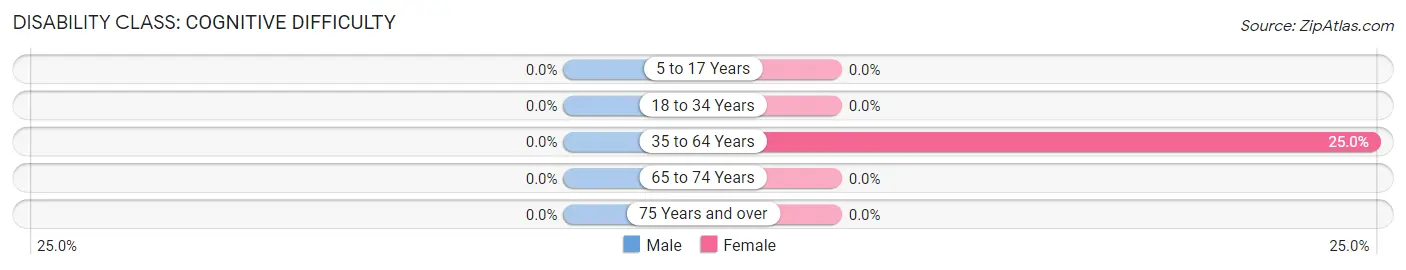
| Age Bracket | Male | Female |
| 5 to 17 Years | 0 (0.0%) | 0 (0.0%) |
| 18 to 34 Years | 0 (0.0%) | 0 (0.0%) |
| 35 to 64 Years | 0 (0.0%) | 4 (25.0%) |
| 65 to 74 Years | 0 (0.0%) | 0 (0.0%) |
| 75 Years and over | 0 (0.0%) | 0 (0.0%) |
Disability Class: Ambulatory Difficulty
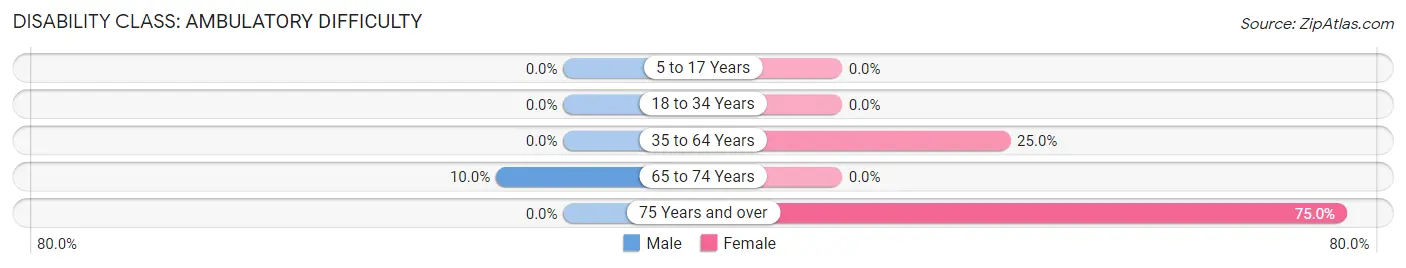
| Age Bracket | Male | Female |
| 5 to 17 Years | 0 (0.0%) | 0 (0.0%) |
| 18 to 34 Years | 0 (0.0%) | 0 (0.0%) |
| 35 to 64 Years | 0 (0.0%) | 4 (25.0%) |
| 65 to 74 Years | 1 (10.0%) | 0 (0.0%) |
| 75 Years and over | 0 (0.0%) | 9 (75.0%) |
Disability Class: Self-Care Difficulty
| Age Bracket | Male | Female |
| 5 to 17 Years | 0 (0.0%) | 0 (0.0%) |
| 18 to 34 Years | 0 (0.0%) | 0 (0.0%) |
| 35 to 64 Years | 0 (0.0%) | 0 (0.0%) |
| 65 to 74 Years | 1 (10.0%) | 0 (0.0%) |
| 75 Years and over | 0 (0.0%) | 0 (0.0%) |
Technology Access in Ozan
Computing Device Access in Ozan
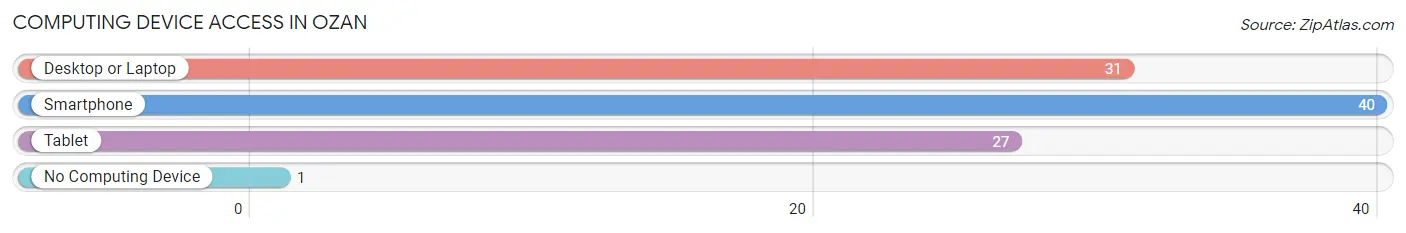
| Device Type | # Households | % Households |
| Desktop or Laptop | 31 | 73.8% |
| Smartphone | 40 | 95.2% |
| Tablet | 27 | 64.3% |
| No Computing Device | 1 | 2.4% |
| Total | 42 | 100.0% |
Internet Access in Ozan
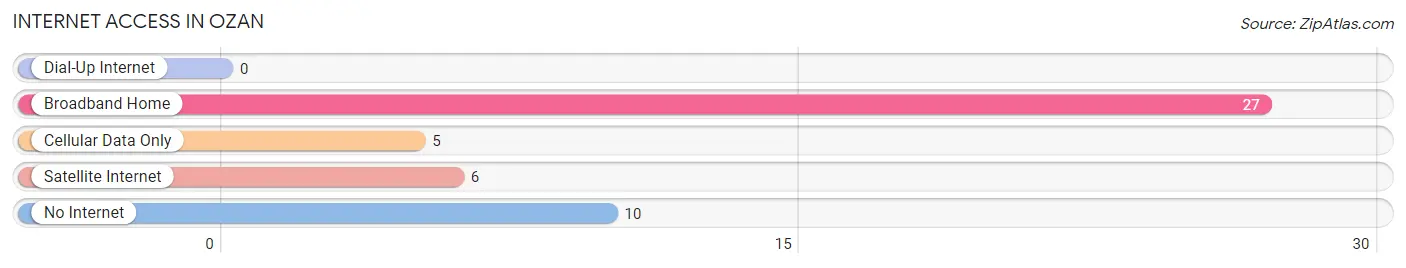
| Internet Type | # Households | % Households |
| Dial-Up Internet | 0 | 0.0% |
| Broadband Home | 27 | 64.3% |
| Cellular Data Only | 5 | 11.9% |
| Satellite Internet | 6 | 14.3% |
| No Internet | 10 | 23.8% |
| Total | 42 | 100.0% |
Ozan Summary
Ozan is a small town located in Hempstead County, Arkansas. It is situated in the southwestern part of the state, about 20 miles from the Arkansas-Louisiana border. The town has a population of approximately 500 people and is part of the Hope Micropolitan Statistical Area.
Geography
Ozan is located in the southwestern part of Hempstead County, Arkansas. It is situated at the intersection of Arkansas Highway 355 and Arkansas Highway 355 Spur. The town is located in the Red River Valley, which is part of the Gulf Coastal Plain. The area is characterized by flat terrain and fertile soils. The climate is humid subtropical, with hot summers and mild winters.
Economy
Ozan’s economy is largely based on agriculture. The town is home to several farms, which produce cotton, soybeans, corn, and other crops. The town also has a few small businesses, including a grocery store, a hardware store, and a gas station.
Demographics
As of the 2010 census, Ozan had a population of 500 people. The racial makeup of the town was 95.2% White, 0.2% African American, 0.2% Native American, 0.2% Asian, 0.2% from other races, and 4.0% from two or more races. Hispanic or Latino of any race were 0.8% of the population.
The median income for a household in Ozan was $30,000, and the median income for a family was $35,000. The per capita income for the town was $14,000. About 15.2% of families and 18.2% of the population were below the poverty line, including 25.0% of those under age 18 and none of those age 65 or over.
History
Ozan was founded in 1883 by a group of settlers from nearby Hope, Arkansas. The town was named after the nearby Ozan Creek, which was named after a Choctaw chief. The town grew slowly, and by the early 1900s, it had a population of around 200 people.
In the early 20th century, Ozan was a center of cotton production. The town had several cotton gins, and the local economy was largely based on cotton farming. The town also had a few small businesses, including a grocery store, a hardware store, and a gas station.
In the late 20th century, the town’s economy shifted away from agriculture and towards tourism. The town is now home to several bed and breakfasts, as well as a few restaurants and antique stores.
Today, Ozan is a small, quiet town. It is a popular destination for tourists, who come to enjoy the town’s rural charm and its proximity to the Red River. The town is also home to a few small businesses, including a grocery store, a hardware store, and a gas station.
Common Questions
What is Per Capita Income in Ozan?
Per Capita income in Ozan is $32,070.
What is the Median Family Income in Ozan?
Median Family Income in Ozan is $82,000.
What is the Median Household income in Ozan?
Median Household Income in Ozan is $62,500.
What is Income or Wage Gap in Ozan?
Income or Wage Gap in Ozan is 58.0%.
Women in Ozan earn 42.0 cents for every dollar earned by a man.
What is Inequality or Gini Index in Ozan?
Inequality or Gini Index in Ozan is 0.27.
What is the Total Population of Ozan?
Total Population of Ozan is 79.
What is the Total Male Population of Ozan?
Total Male Population of Ozan is 26.
What is the Total Female Population of Ozan?
Total Female Population of Ozan is 53.
What is the Ratio of Males per 100 Females in Ozan?
There are 49.06 Males per 100 Females in Ozan.
What is the Ratio of Females per 100 Males in Ozan?
There are 203.85 Females per 100 Males in Ozan.
What is the Median Population Age in Ozan?
Median Population Age in Ozan is 63.1 Years.
What is the Average Family Size in Ozan
Average Family Size in Ozan is 2.5 People.
What is the Average Household Size in Ozan
Average Household Size in Ozan is 1.9 People.
How Large is the Labor Force in Ozan?
There are 51 People in the Labor Forcein in Ozan.
What is the Percentage of People in the Labor Force in Ozan?
65.4% of People are in the Labor Force in Ozan.