Lake View, AR Map & Demographics
Lake View Map
Lake View Overview
$16,610
PER CAPITA INCOME
$44,318
AVG FAMILY INCOME
$28,750
AVG HOUSEHOLD INCOME
0.40
INEQUALITY / GINI INDEX
454
TOTAL POPULATION
179
MALE POPULATION
275
FEMALE POPULATION
65.09
MALES / 100 FEMALES
153.63
FEMALES / 100 MALES
52.3
MEDIAN AGE
3.8
AVG FAMILY SIZE
2.7
AVG HOUSEHOLD SIZE
126
LABOR FORCE [ PEOPLE ]
34.1%
PERCENT IN LABOR FORCE
25.4%
UNEMPLOYMENT RATE
Income in Lake View
Income Overview in Lake View
Per Capita Income in Lake View is $16,610, while median incomes of families and households are $44,318 and $28,750 respectively.
| Characteristic | Number | Measure |
| Per Capita Income | 454 | $16,610 |
| Median Family Income | 98 | $44,318 |
| Mean Family Income | 98 | $48,453 |
| Median Household Income | 170 | $28,750 |
| Mean Household Income | 170 | $36,508 |
| Income Deficit | 98 | $0 |
| Wage / Income Gap (%) | 454 | 0.00% |
| Wage / Income Gap ($) | 454 | 100.00¢ per $1 |
| Gini / Inequality Index | 454 | 0.40 |
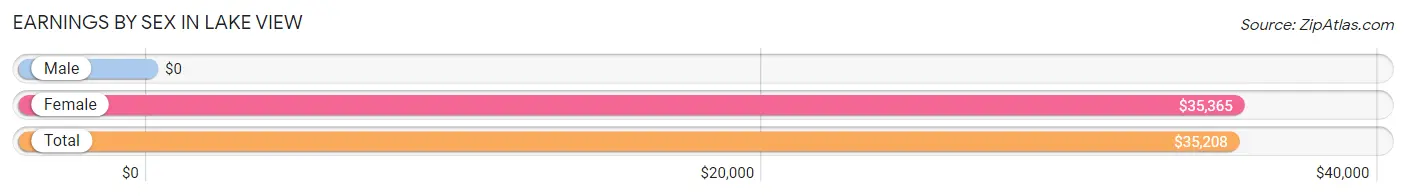
Earnings by Sex in Lake View
| Sex | Number | Average Earnings |
| Male | 41 (36.6%) | $0 |
| Female | 71 (63.4%) | $35,365 |
| Total | 112 (100.0%) | $35,208 |
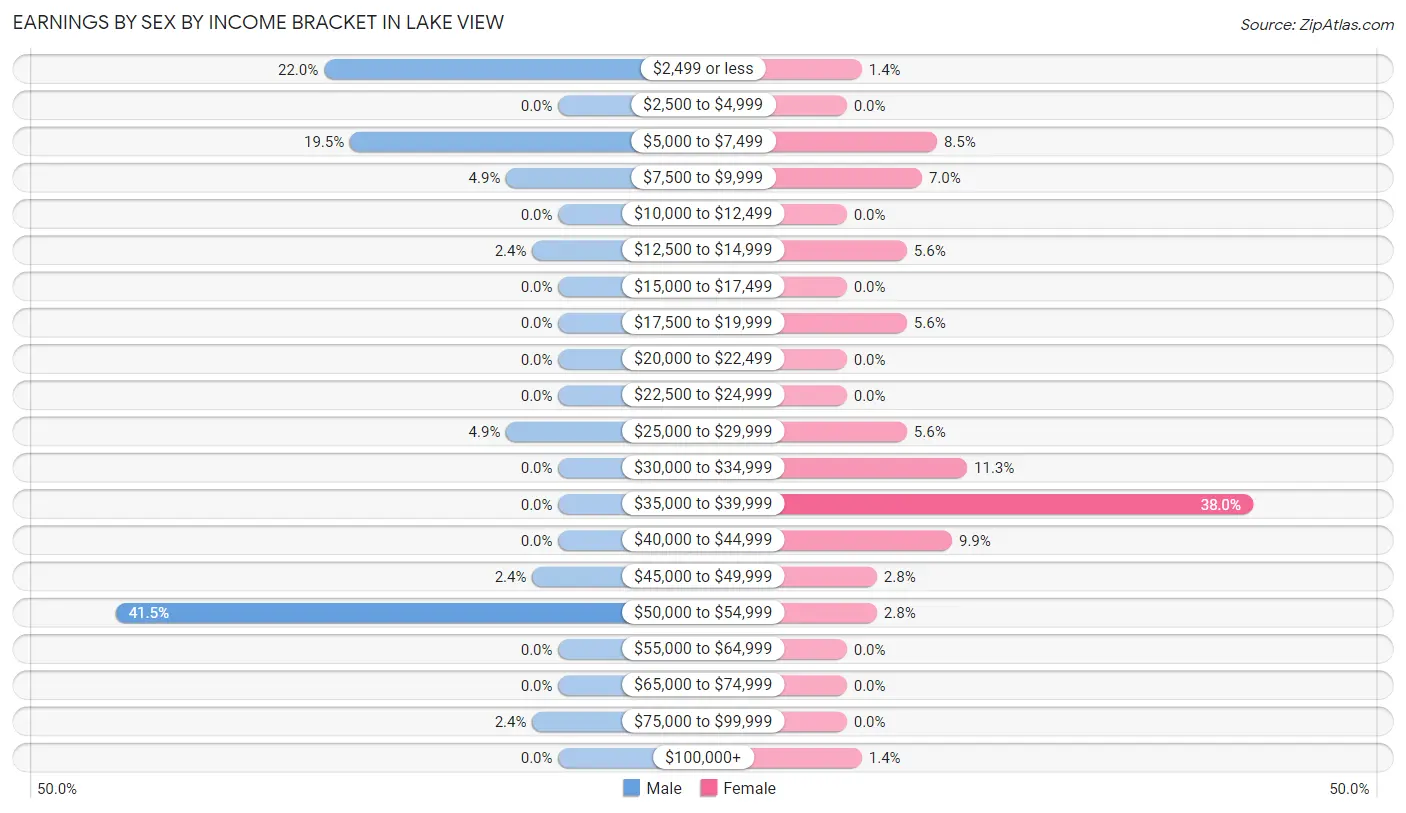
Earnings by Sex by Income Bracket in Lake View
The most common earnings brackets in Lake View are $50,000 to $54,999 for men (17 | 41.5%) and $35,000 to $39,999 for women (27 | 38.0%).
| Income | Male | Female |
| $2,499 or less | 9 (22.0%) | 1 (1.4%) |
| $2,500 to $4,999 | 0 (0.0%) | 0 (0.0%) |
| $5,000 to $7,499 | 8 (19.5%) | 6 (8.5%) |
| $7,500 to $9,999 | 2 (4.9%) | 5 (7.0%) |
| $10,000 to $12,499 | 0 (0.0%) | 0 (0.0%) |
| $12,500 to $14,999 | 1 (2.4%) | 4 (5.6%) |
| $15,000 to $17,499 | 0 (0.0%) | 0 (0.0%) |
| $17,500 to $19,999 | 0 (0.0%) | 4 (5.6%) |
| $20,000 to $22,499 | 0 (0.0%) | 0 (0.0%) |
| $22,500 to $24,999 | 0 (0.0%) | 0 (0.0%) |
| $25,000 to $29,999 | 2 (4.9%) | 4 (5.6%) |
| $30,000 to $34,999 | 0 (0.0%) | 8 (11.3%) |
| $35,000 to $39,999 | 0 (0.0%) | 27 (38.0%) |
| $40,000 to $44,999 | 0 (0.0%) | 7 (9.9%) |
| $45,000 to $49,999 | 1 (2.4%) | 2 (2.8%) |
| $50,000 to $54,999 | 17 (41.5%) | 2 (2.8%) |
| $55,000 to $64,999 | 0 (0.0%) | 0 (0.0%) |
| $65,000 to $74,999 | 0 (0.0%) | 0 (0.0%) |
| $75,000 to $99,999 | 1 (2.4%) | 0 (0.0%) |
| $100,000+ | 0 (0.0%) | 1 (1.4%) |
| Total | 41 (100.0%) | 71 (100.0%) |
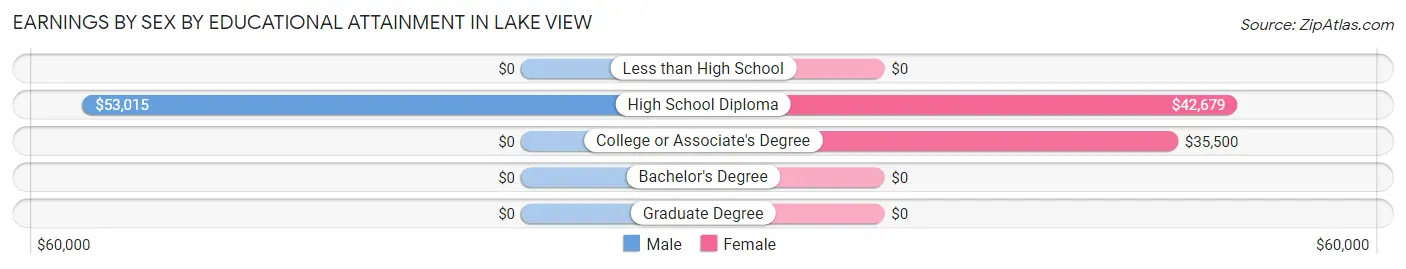
Earnings by Sex by Educational Attainment in Lake View
| Educational Attainment | Male Income | Female Income |
| Less than High School | - | - |
| High School Diploma | $53,015 | $42,679 |
| College or Associate's Degree | - | - |
| Bachelor's Degree | - | - |
| Graduate Degree | - | - |
| Total | - | - |
Family Income in Lake View
Family Income Brackets in Lake View
According to the Lake View family income data, there are 24 families falling into the $35,000 to $49,999 income range, which is the most common income bracket and makes up 24.5% of all families.
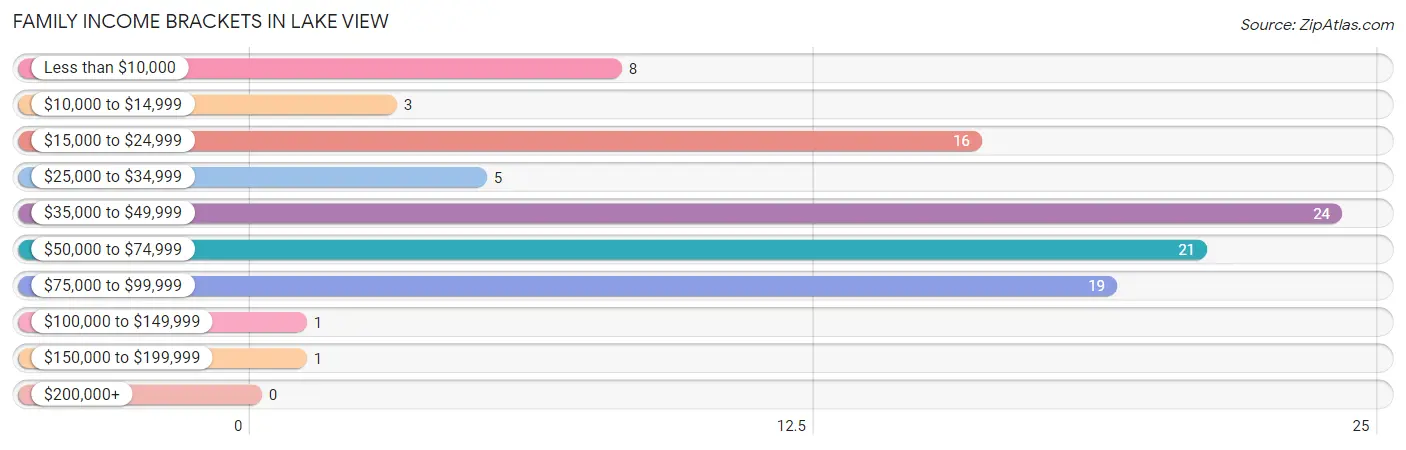
| Income Bracket | # Families | % Families |
| Less than $10,000 | 8 | 8.2% |
| $10,000 to $14,999 | 3 | 3.1% |
| $15,000 to $24,999 | 16 | 16.3% |
| $25,000 to $34,999 | 5 | 5.1% |
| $35,000 to $49,999 | 24 | 24.5% |
| $50,000 to $74,999 | 21 | 21.4% |
| $75,000 to $99,999 | 19 | 19.4% |
| $100,000 to $149,999 | 1 | 1.0% |
| $150,000 to $199,999 | 1 | 1.0% |
| $200,000+ | 0 | 0.0% |
Family Income by Famaliy Size in Lake View
4-person families (11 | 11.2%) account for the highest median family income in Lake View with $85,893 per family, while 4-person families (11 | 11.2%) have the highest median income of $21,473 per family member.
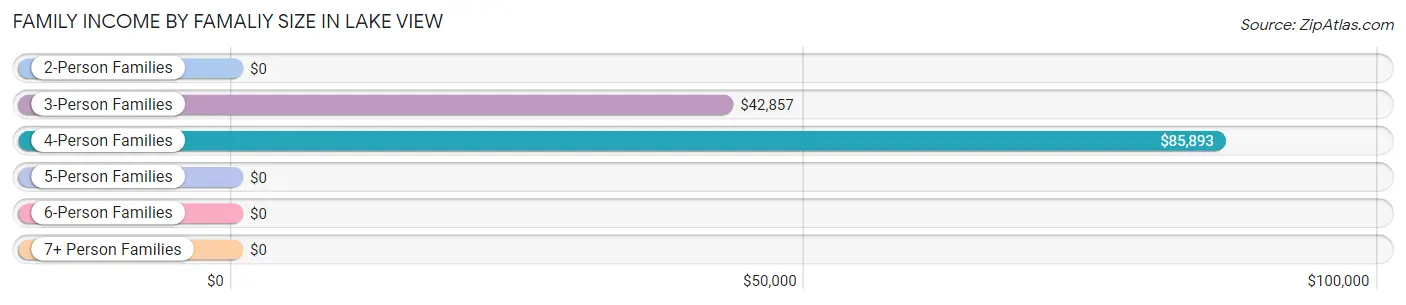
| Income Bracket | # Families | Median Income |
| 2-Person Families | 39 (39.8%) | $0 |
| 3-Person Families | 42 (42.9%) | $42,857 |
| 4-Person Families | 11 (11.2%) | $85,893 |
| 5-Person Families | 2 (2.0%) | $0 |
| 6-Person Families | 0 (0.0%) | $0 |
| 7+ Person Families | 4 (4.1%) | $0 |
| Total | 98 (100.0%) | $44,318 |
Family Income by Number of Earners in Lake View
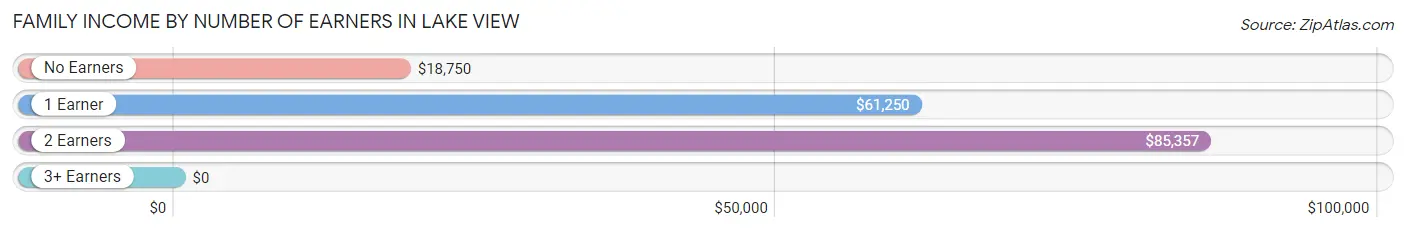
| Number of Earners | # Families | Median Income |
| No Earners | 34 (34.7%) | $18,750 |
| 1 Earner | 50 (51.0%) | $61,250 |
| 2 Earners | 14 (14.3%) | $85,357 |
| 3+ Earners | 0 (0.0%) | $0 |
| Total | 98 (100.0%) | $44,318 |
Household Income in Lake View
Household Income Brackets in Lake View
With 45 households falling in the category, the $15,000 to $24,999 income range is the most frequent in Lake View, accounting for 26.5% of all households.
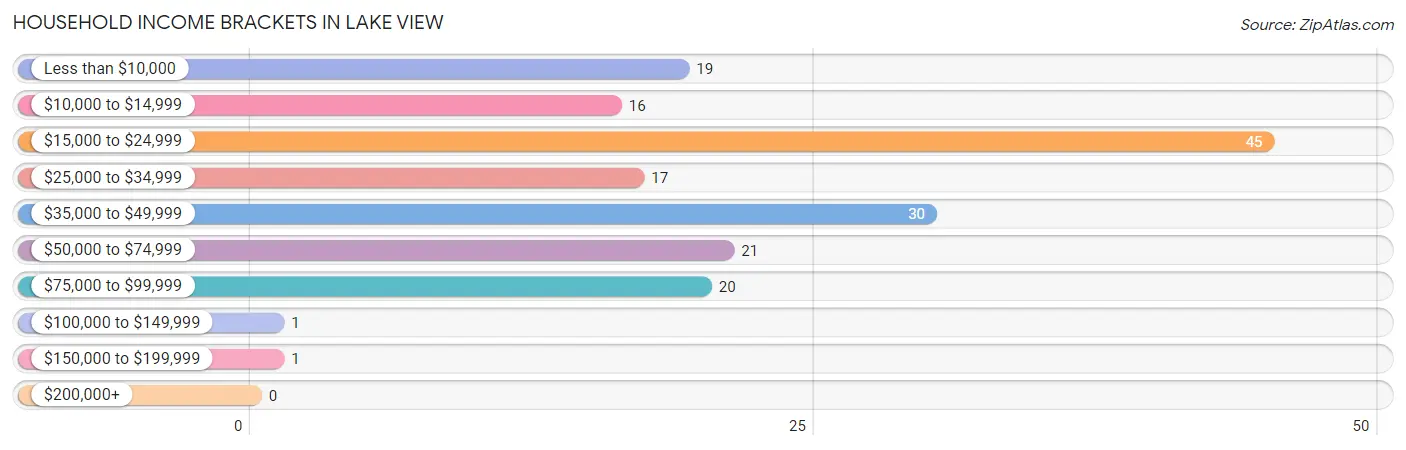
| Income Bracket | # Households | % Households |
| Less than $10,000 | 19 | 11.2% |
| $10,000 to $14,999 | 16 | 9.4% |
| $15,000 to $24,999 | 45 | 26.5% |
| $25,000 to $34,999 | 17 | 10.0% |
| $35,000 to $49,999 | 30 | 17.6% |
| $50,000 to $74,999 | 21 | 12.4% |
| $75,000 to $99,999 | 20 | 11.8% |
| $100,000 to $149,999 | 1 | 0.6% |
| $150,000 to $199,999 | 1 | 0.6% |
| $200,000+ | 0 | 0.0% |
Household Income by Householder Age in Lake View
The median household income in Lake View is $28,750, with the highest median household income of $43,068 found in the 25 to 44 years age bracket for the primary householder. A total of 25 households (14.7%) fall into this category.
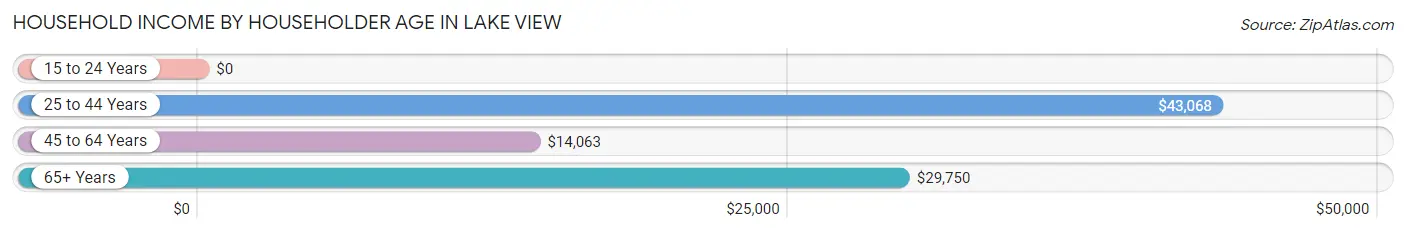
| Income Bracket | # Households | Median Income |
| 15 to 24 Years | 0 (0.0%) | $0 |
| 25 to 44 Years | 25 (14.7%) | $43,068 |
| 45 to 64 Years | 43 (25.3%) | $14,063 |
| 65+ Years | 102 (60.0%) | $29,750 |
| Total | 170 (100.0%) | $28,750 |
Poverty in Lake View
Income Below Poverty by Sex and Age in Lake View
With 28.6% poverty level for males and 24.9% for females among the residents of Lake View, 16 and 17 year old males and 6 to 11 year old females are the most vulnerable to poverty, with 5 males (100.0%) and 8 females (88.9%) in their respective age groups living below the poverty level.
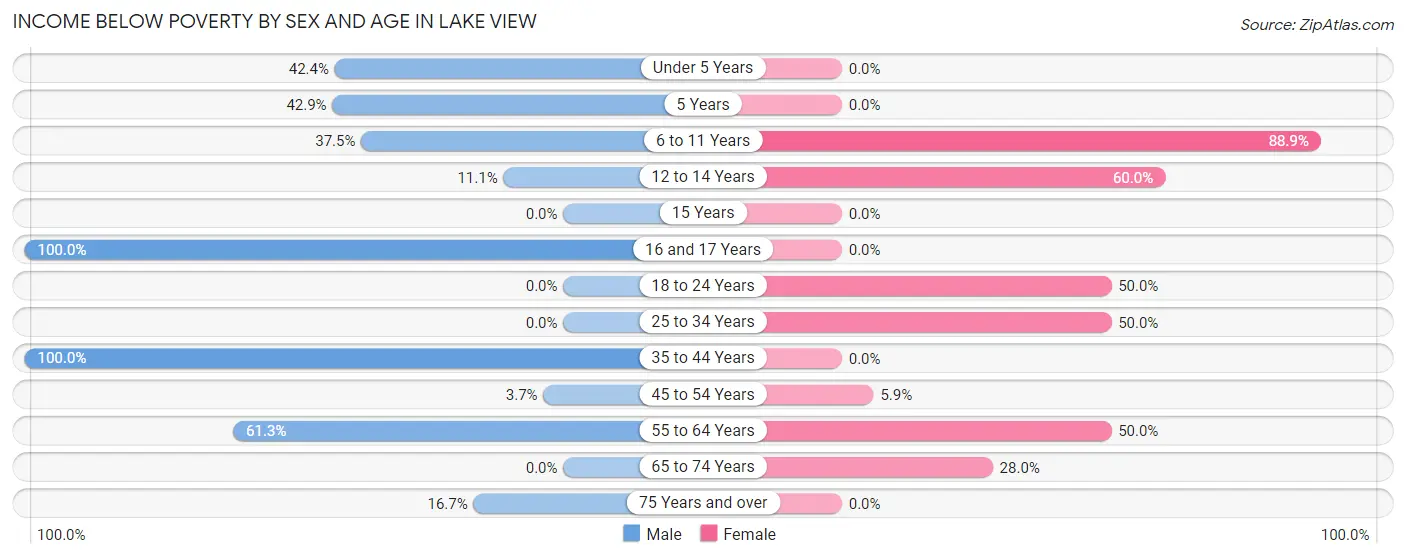
| Age Bracket | Male | Female |
| Under 5 Years | 14 (42.4%) | 0 (0.0%) |
| 5 Years | 3 (42.9%) | 0 (0.0%) |
| 6 to 11 Years | 3 (37.5%) | 8 (88.9%) |
| 12 to 14 Years | 1 (11.1%) | 3 (60.0%) |
| 15 Years | 0 (0.0%) | 0 (0.0%) |
| 16 and 17 Years | 5 (100.0%) | 0 (0.0%) |
| 18 to 24 Years | 0 (0.0%) | 6 (50.0%) |
| 25 to 34 Years | 0 (0.0%) | 19 (50.0%) |
| 35 to 44 Years | 4 (100.0%) | 0 (0.0%) |
| 45 to 54 Years | 1 (3.7%) | 2 (5.9%) |
| 55 to 64 Years | 19 (61.3%) | 16 (50.0%) |
| 65 to 74 Years | 0 (0.0%) | 14 (28.0%) |
| 75 Years and over | 1 (16.7%) | 0 (0.0%) |
| Total | 51 (28.6%) | 68 (24.9%) |
Income Above Poverty by Sex and Age in Lake View
According to the poverty statistics in Lake View, males aged 15 years and females aged under 5 years are the age groups that are most secure financially, with 100.0% of males and 100.0% of females in these age groups living above the poverty line.
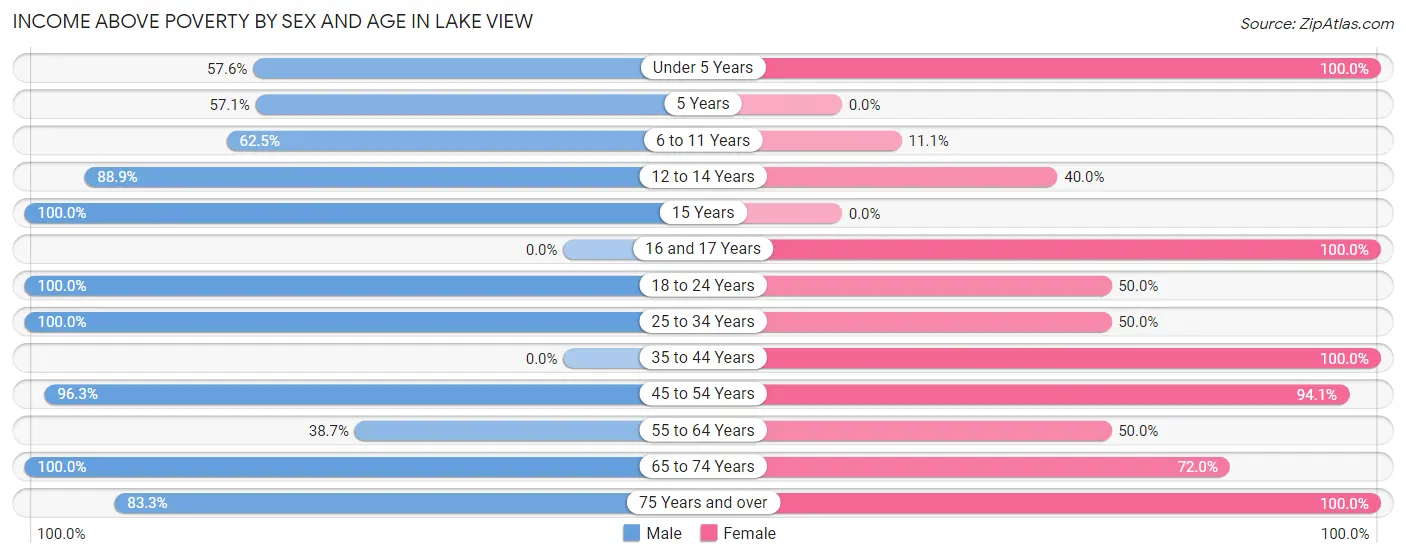
| Age Bracket | Male | Female |
| Under 5 Years | 19 (57.6%) | 2 (100.0%) |
| 5 Years | 4 (57.1%) | 0 (0.0%) |
| 6 to 11 Years | 5 (62.5%) | 1 (11.1%) |
| 12 to 14 Years | 8 (88.9%) | 2 (40.0%) |
| 15 Years | 9 (100.0%) | 0 (0.0%) |
| 16 and 17 Years | 0 (0.0%) | 8 (100.0%) |
| 18 to 24 Years | 18 (100.0%) | 6 (50.0%) |
| 25 to 34 Years | 3 (100.0%) | 19 (50.0%) |
| 35 to 44 Years | 0 (0.0%) | 20 (100.0%) |
| 45 to 54 Years | 26 (96.3%) | 32 (94.1%) |
| 55 to 64 Years | 12 (38.7%) | 16 (50.0%) |
| 65 to 74 Years | 18 (100.0%) | 36 (72.0%) |
| 75 Years and over | 5 (83.3%) | 63 (100.0%) |
| Total | 127 (71.4%) | 205 (75.1%) |
Income Below Poverty Among Married-Couple Families in Lake View
The poverty statistics for married-couple families in Lake View show that 20.0% or 3 of the total 15 families live below the poverty line. Families with 1 or 2 children have the highest poverty rate of 25.0%, comprising of 2 families. On the other hand, families with no children have the lowest poverty rate of 14.3%, which includes 1 families.
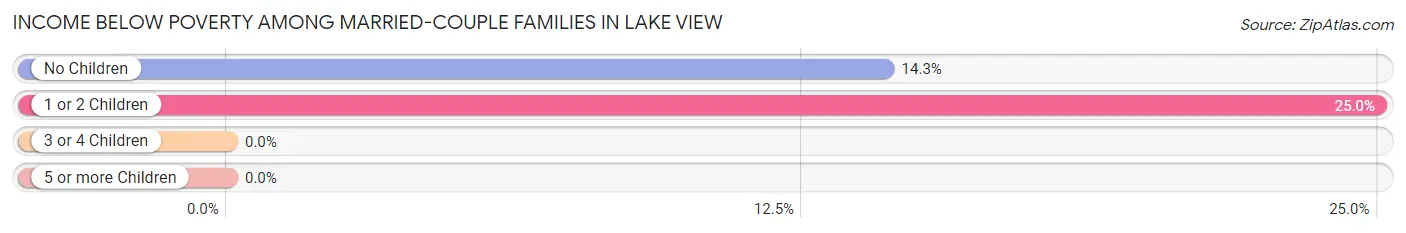
| Children | Above Poverty | Below Poverty |
| No Children | 6 (85.7%) | 1 (14.3%) |
| 1 or 2 Children | 6 (75.0%) | 2 (25.0%) |
| 3 or 4 Children | 0 (0.0%) | 0 (0.0%) |
| 5 or more Children | 0 (0.0%) | 0 (0.0%) |
| Total | 12 (80.0%) | 3 (20.0%) |
Income Below Poverty Among Single-Parent Households in Lake View
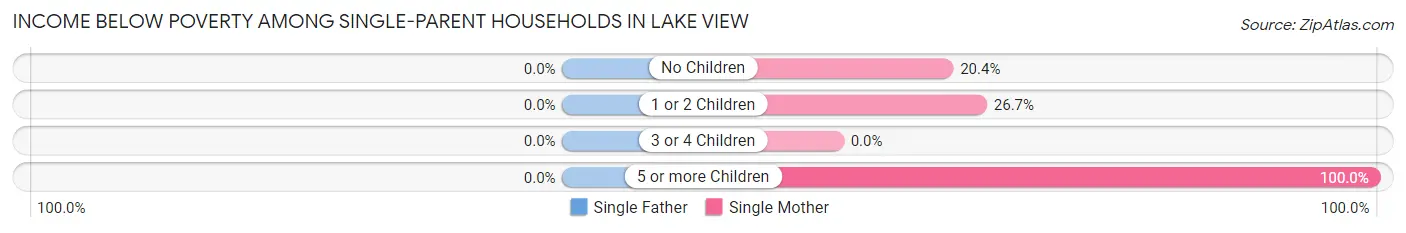
| Children | Single Father | Single Mother |
| No Children | 0 (0.0%) | 10 (20.4%) |
| 1 or 2 Children | 0 (0.0%) | 8 (26.7%) |
| 3 or 4 Children | 0 (0.0%) | 0 (0.0%) |
| 5 or more Children | 0 (0.0%) | 4 (100.0%) |
| Total | 0 (0.0%) | 22 (26.5%) |
Income Below Poverty Among Married-Couple vs Single-Parent Households in Lake View
The poverty data for Lake View shows that 3 of the married-couple family households (20.0%) and 22 of the single-parent households (26.5%) are living below the poverty level. Within the married-couple family households, those with 1 or 2 children have the highest poverty rate, with 2 households (25.0%) falling below the poverty line. Among the single-parent households, those with 5 or more children have the highest poverty rate, with 4 household (100.0%) living below poverty.
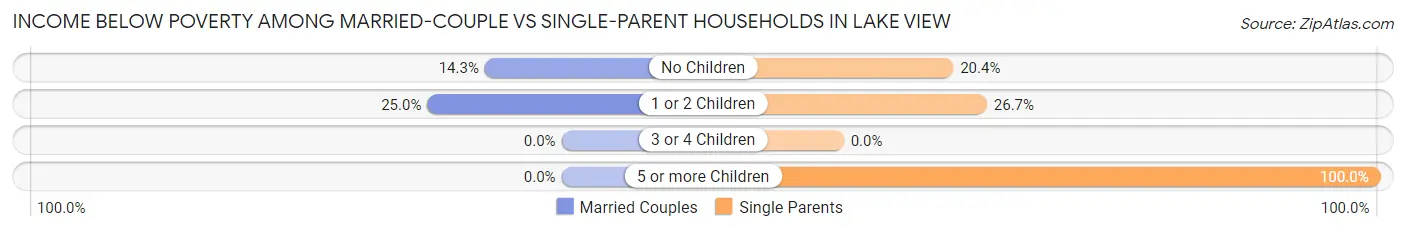
| Children | Married-Couple Families | Single-Parent Households |
| No Children | 1 (14.3%) | 10 (20.4%) |
| 1 or 2 Children | 2 (25.0%) | 8 (26.7%) |
| 3 or 4 Children | 0 (0.0%) | 0 (0.0%) |
| 5 or more Children | 0 (0.0%) | 4 (100.0%) |
| Total | 3 (20.0%) | 22 (26.5%) |
Race in Lake View
The most populous races in Lake View are Black / African American (439 | 96.7%), White / Caucasian (13 | 2.9%), and Two or more Races (2 | 0.4%).
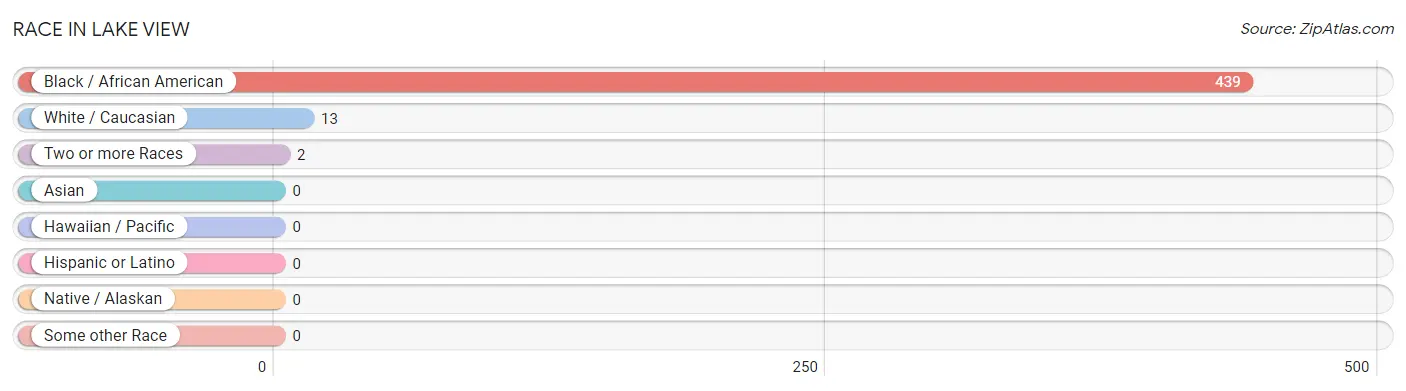
| Race | # Population | % Population |
| Asian | 0 | 0.0% |
| Black / African American | 439 | 96.7% |
| Hawaiian / Pacific | 0 | 0.0% |
| Hispanic or Latino | 0 | 0.0% |
| Native / Alaskan | 0 | 0.0% |
| White / Caucasian | 13 | 2.9% |
| Two or more Races | 2 | 0.4% |
| Some other Race | 0 | 0.0% |
| Total | 454 | 100.0% |
Ancestry in Lake View
The most populous ancestries reported in Lake View are African (35 | 7.7%), Subsaharan African (35 | 7.7%), American (2 | 0.4%), Creek (1 | 0.2%), and English (1 | 0.2%), together accounting for 16.3% of all Lake View residents.
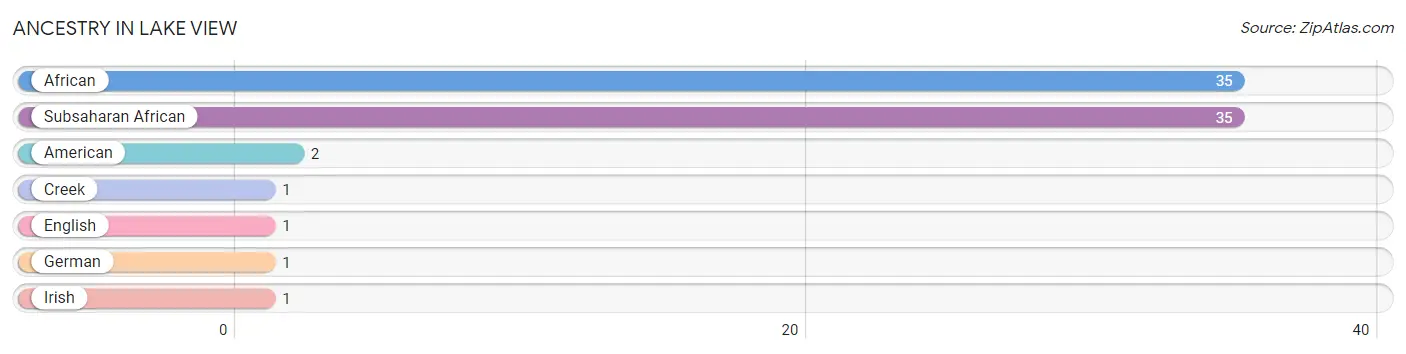
| Ancestry | # Population | % Population |
| African | 35 | 7.7% |
| American | 2 | 0.4% |
| Creek | 1 | 0.2% |
| English | 1 | 0.2% |
| German | 1 | 0.2% |
| Irish | 1 | 0.2% |
| Subsaharan African | 35 | 7.7% | View All 7 Rows |
Immigrants in Lake View

| Immigration Origin | # Population | % Population | View All 0 Rows |
Sex and Age in Lake View
Sex and Age in Lake View
The most populous age groups in Lake View are Under 5 Years (33 | 18.4%) for men and 70 to 74 Years (30 | 10.9%) for women.
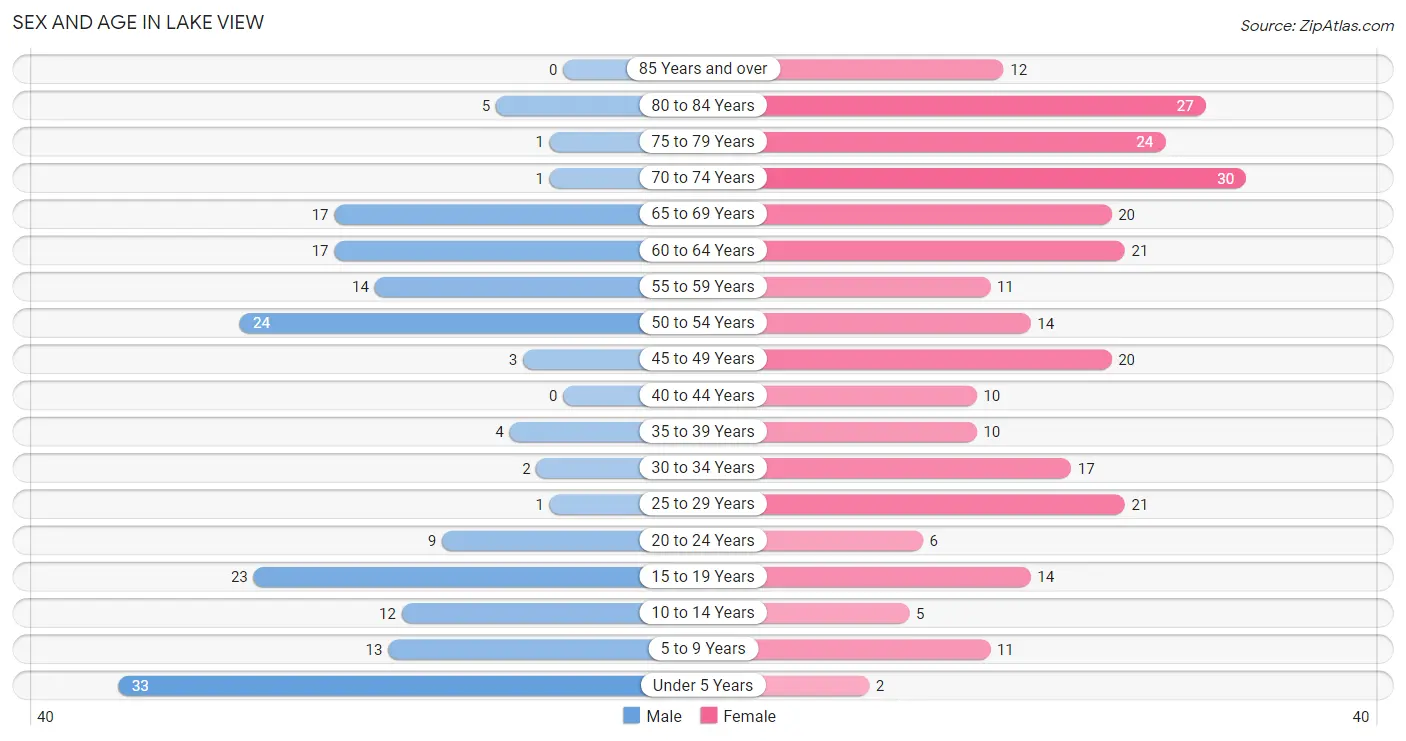
| Age Bracket | Male | Female |
| Under 5 Years | 33 (18.4%) | 2 (0.7%) |
| 5 to 9 Years | 13 (7.3%) | 11 (4.0%) |
| 10 to 14 Years | 12 (6.7%) | 5 (1.8%) |
| 15 to 19 Years | 23 (12.9%) | 14 (5.1%) |
| 20 to 24 Years | 9 (5.0%) | 6 (2.2%) |
| 25 to 29 Years | 1 (0.6%) | 21 (7.6%) |
| 30 to 34 Years | 2 (1.1%) | 17 (6.2%) |
| 35 to 39 Years | 4 (2.2%) | 10 (3.6%) |
| 40 to 44 Years | 0 (0.0%) | 10 (3.6%) |
| 45 to 49 Years | 3 (1.7%) | 20 (7.3%) |
| 50 to 54 Years | 24 (13.4%) | 14 (5.1%) |
| 55 to 59 Years | 14 (7.8%) | 11 (4.0%) |
| 60 to 64 Years | 17 (9.5%) | 21 (7.6%) |
| 65 to 69 Years | 17 (9.5%) | 20 (7.3%) |
| 70 to 74 Years | 1 (0.6%) | 30 (10.9%) |
| 75 to 79 Years | 1 (0.6%) | 24 (8.7%) |
| 80 to 84 Years | 5 (2.8%) | 27 (9.8%) |
| 85 Years and over | 0 (0.0%) | 12 (4.4%) |
| Total | 179 (100.0%) | 275 (100.0%) |
Families and Households in Lake View
Median Family Size in Lake View
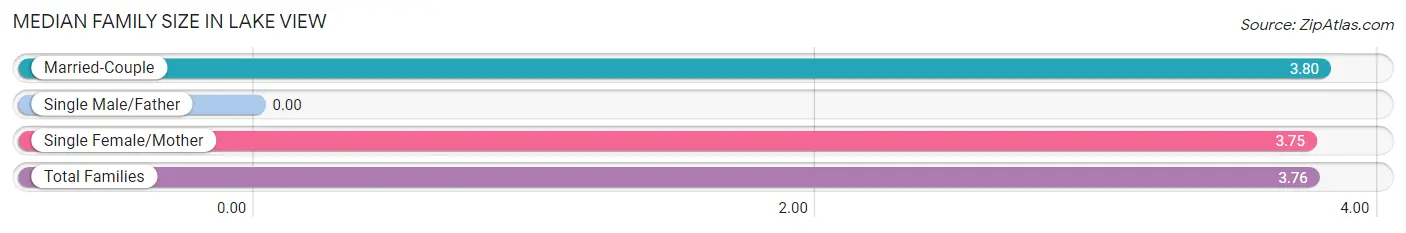
| Family Type | # Families | Family Size |
| Married-Couple | 15 (15.3%) | 3.80 |
| Single Male/Father | 0 (0.0%) | - |
| Single Female/Mother | 83 (84.7%) | 3.75 |
| Total Families | 98 (100.0%) | 3.76 |
Median Household Size in Lake View
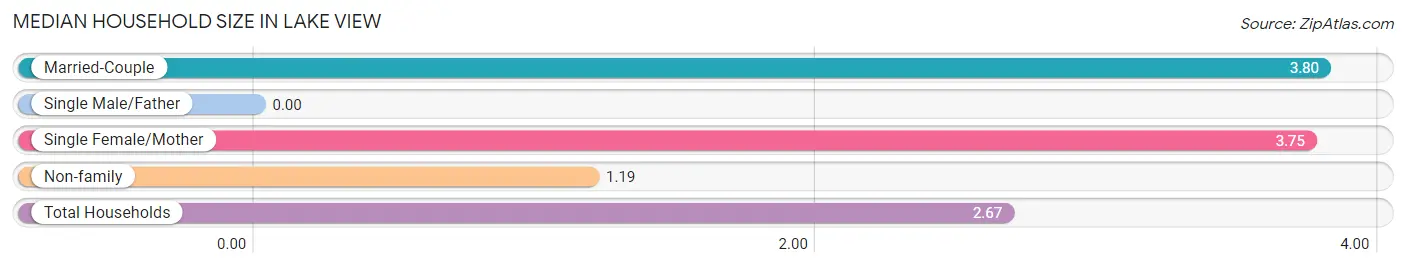
| Household Type | # Households | Household Size |
| Married-Couple | 15 (8.8%) | 3.80 |
| Single Male/Father | 0 (0.0%) | - |
| Single Female/Mother | 83 (48.8%) | 3.75 |
| Non-family | 72 (42.3%) | 1.19 |
| Total Households | 170 (100.0%) | 2.67 |
Household Size by Marriage Status in Lake View
Out of a total of 170 households in Lake View, 98 (57.7%) are family households, while 72 (42.3%) are nonfamily households. The most numerous type of family households are 3-person households, comprising 42, and the most common type of nonfamily households are 1-person households, comprising 68.
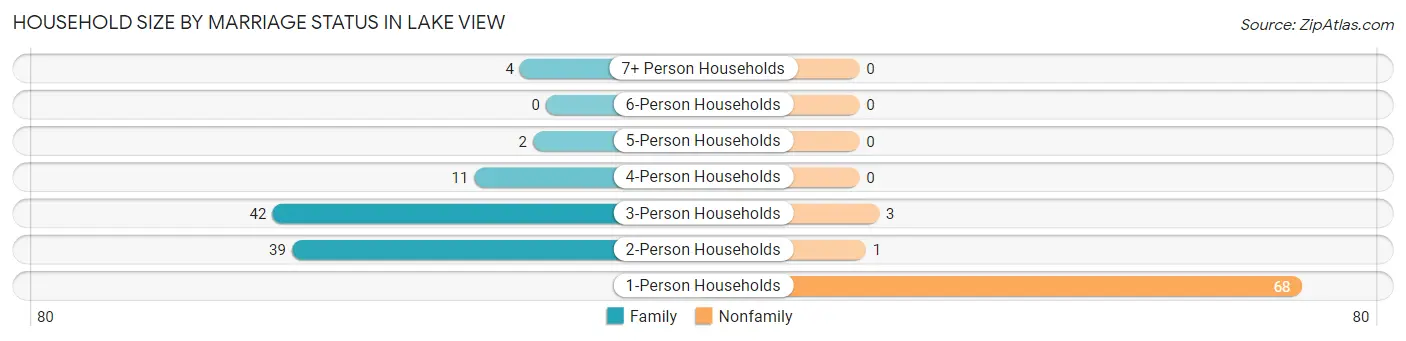
| Household Size | Family Households | Nonfamily Households |
| 1-Person Households | - | 68 (40.0%) |
| 2-Person Households | 39 (22.9%) | 1 (0.6%) |
| 3-Person Households | 42 (24.7%) | 3 (1.8%) |
| 4-Person Households | 11 (6.5%) | 0 (0.0%) |
| 5-Person Households | 2 (1.2%) | 0 (0.0%) |
| 6-Person Households | 0 (0.0%) | 0 (0.0%) |
| 7+ Person Households | 4 (2.4%) | 0 (0.0%) |
| Total | 98 (57.7%) | 72 (42.3%) |
Female Fertility in Lake View
Fertility by Age in Lake View
Average fertility rate in Lake View is 101.0 births per 1,000 women. Women in the age bracket of 15 to 19 years have the highest fertility rate with 429.0 births per 1,000 women. Women in the age bracket of 15 to 19 years acount for 60.0% of all women with births.
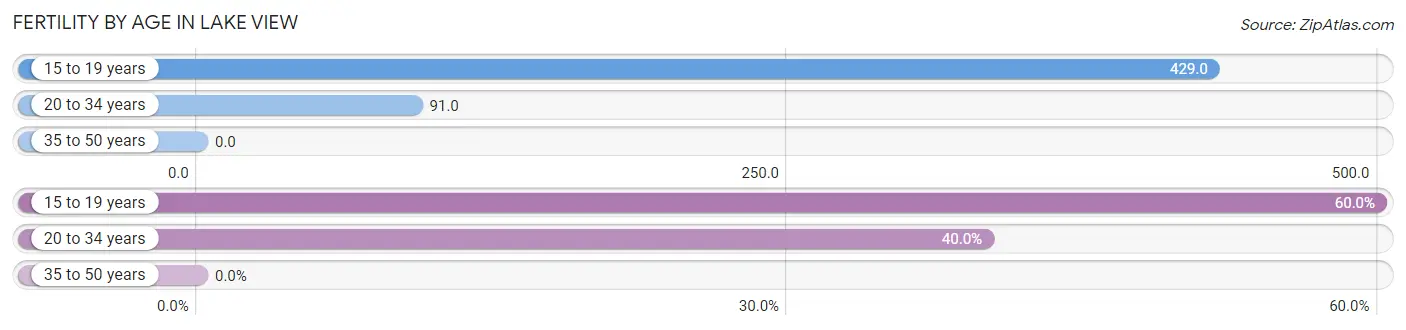
| Age Bracket | Women with Births | Births / 1,000 Women |
| 15 to 19 years | 6 (60.0%) | 429.0 |
| 20 to 34 years | 4 (40.0%) | 91.0 |
| 35 to 50 years | 0 (0.0%) | 0.0 |
| Total | 10 (100.0%) | 101.0 |
Fertility by Age by Marriage Status in Lake View
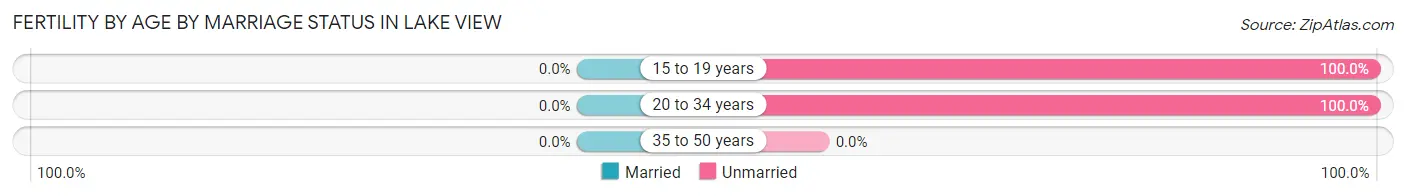
| Age Bracket | Married | Unmarried |
| 15 to 19 years | 0 (0.0%) | 6 (100.0%) |
| 20 to 34 years | 0 (0.0%) | 4 (100.0%) |
| 35 to 50 years | 0 (0.0%) | 0 (0.0%) |
| Total | 0 (0.0%) | 10 (100.0%) |
Fertility by Education in Lake View
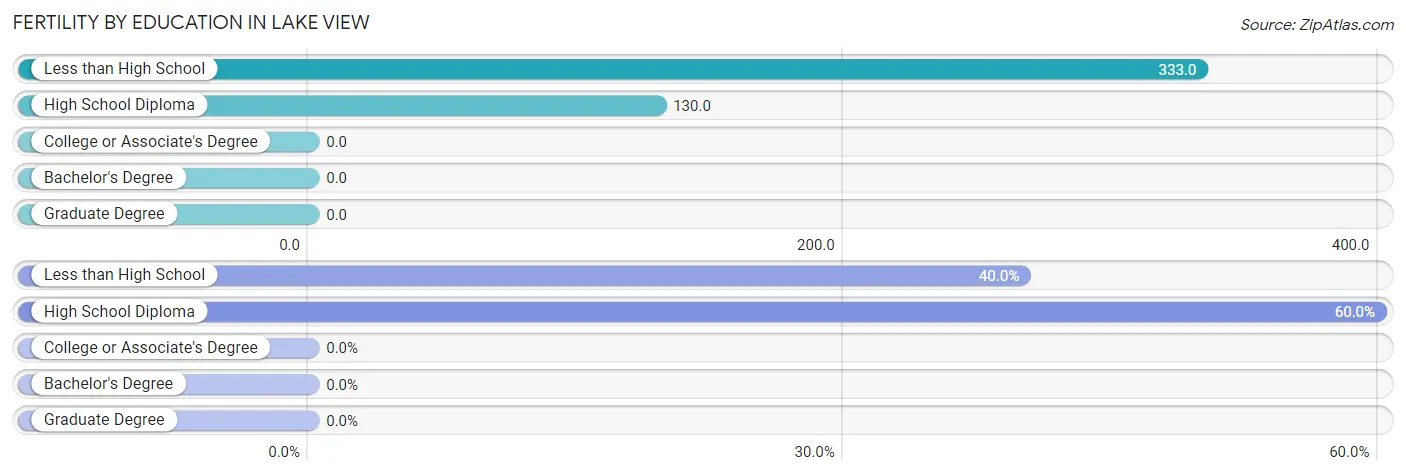
| Educational Attainment | Women with Births | Births / 1,000 Women |
| Less than High School | 4 (40.0%) | 333.0 |
| High School Diploma | 6 (60.0%) | 130.0 |
| College or Associate's Degree | 0 (0.0%) | 0.0 |
| Bachelor's Degree | 0 (0.0%) | 0.0 |
| Graduate Degree | 0 (0.0%) | 0.0 |
| Total | 10 (100.0%) | 101.0 |
Fertility by Education by Marriage Status in Lake View
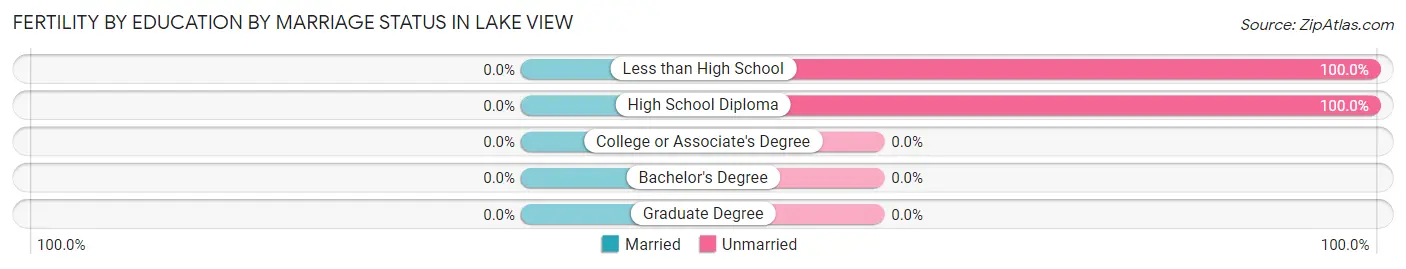
| Educational Attainment | Married | Unmarried |
| Less than High School | 0 (0.0%) | 4 (100.0%) |
| High School Diploma | 0 (0.0%) | 6 (100.0%) |
| College or Associate's Degree | 0 (0.0%) | 0 (0.0%) |
| Bachelor's Degree | 0 (0.0%) | 0 (0.0%) |
| Graduate Degree | 0 (0.0%) | 0 (0.0%) |
| Total | 0 (0.0%) | 10 (100.0%) |
Employment Characteristics in Lake View
Employment by Class of Employer in Lake View
Among the 83 employed individuals in Lake View, state government employees (39 | 47.0%), private company employees (33 | 39.8%), and self-employed (not incorporated) (4 | 4.8%) make up the most common classes of employment.
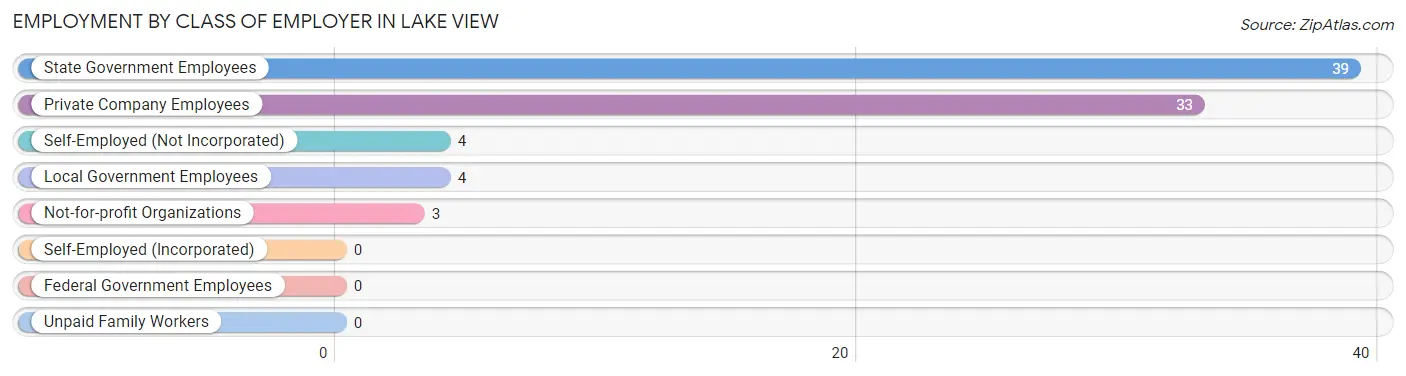
| Employer Class | # Employees | % Employees |
| Private Company Employees | 33 | 39.8% |
| Self-Employed (Incorporated) | 0 | 0.0% |
| Self-Employed (Not Incorporated) | 4 | 4.8% |
| Not-for-profit Organizations | 3 | 3.6% |
| Local Government Employees | 4 | 4.8% |
| State Government Employees | 39 | 47.0% |
| Federal Government Employees | 0 | 0.0% |
| Unpaid Family Workers | 0 | 0.0% |
| Total | 83 | 100.0% |
Employment Status by Age in Lake View
According to the labor force statistics for Lake View, out of the total population over 16 years of age (369), 34.1% or 126 individuals are in the labor force, with 25.4% or 32 of them unemployed. The age group with the highest labor force participation rate is 45 to 54 years, with 75.4% or 46 individuals in the labor force. Within the labor force, the 20 to 24 years age range has the highest percentage of unemployed individuals, with 100.0% or 6 of them being unemployed.
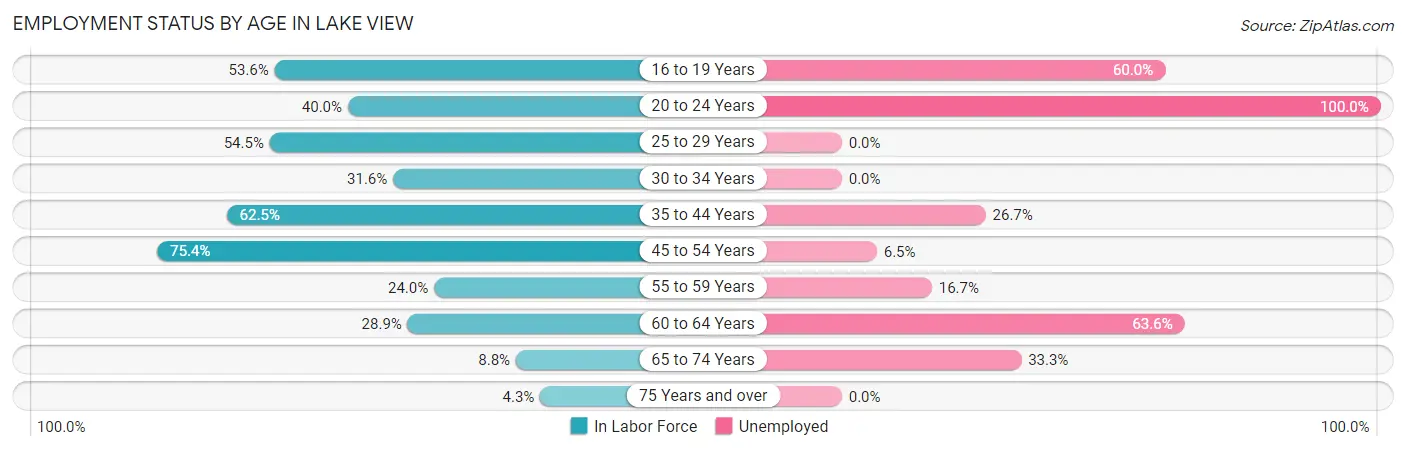
| Age Bracket | In Labor Force | Unemployed |
| 16 to 19 Years | 15 (53.6%) | 9 (60.0%) |
| 20 to 24 Years | 6 (40.0%) | 6 (100.0%) |
| 25 to 29 Years | 12 (54.5%) | 0 (0.0%) |
| 30 to 34 Years | 6 (31.6%) | 0 (0.0%) |
| 35 to 44 Years | 15 (62.5%) | 4 (26.7%) |
| 45 to 54 Years | 46 (75.4%) | 3 (6.5%) |
| 55 to 59 Years | 6 (24.0%) | 1 (16.7%) |
| 60 to 64 Years | 11 (28.9%) | 7 (63.6%) |
| 65 to 74 Years | 6 (8.8%) | 2 (33.3%) |
| 75 Years and over | 3 (4.3%) | 0 (0.0%) |
| Total | 126 (34.1%) | 32 (25.4%) |
Employment Status by Educational Attainment in Lake View
According to labor force statistics for Lake View, 50.8% of individuals (96) out of the total population between 25 and 64 years of age (189) are in the labor force, with 15.6% or 15 of them being unemployed. The group with the highest labor force participation rate are those with the educational attainment of bachelor's degree or higher, with 53.3% or 8 individuals in the labor force. Within the labor force, individuals with less than high school education have the highest percentage of unemployment, with 63.6% or 7 of them being unemployed.
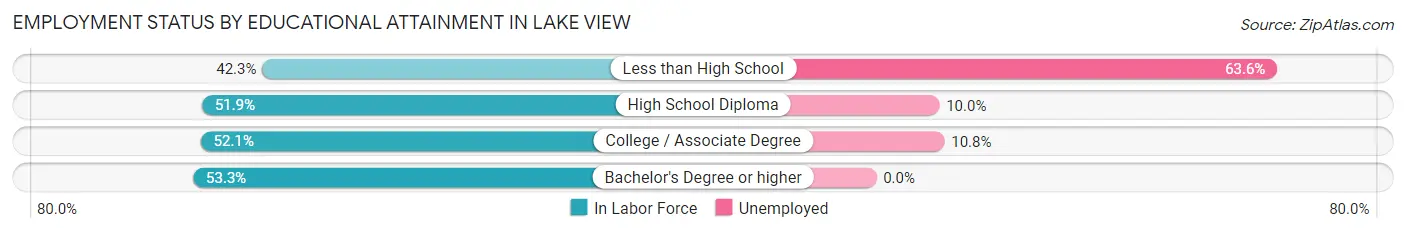
| Educational Attainment | In Labor Force | Unemployed |
| Less than High School | 11 (42.3%) | 17 (63.6%) |
| High School Diploma | 40 (51.9%) | 8 (10.0%) |
| College / Associate Degree | 37 (52.1%) | 8 (10.8%) |
| Bachelor's Degree or higher | 8 (53.3%) | 0 (0.0%) |
| Total | 96 (50.8%) | 29 (15.6%) |
Employment Occupations by Sex in Lake View
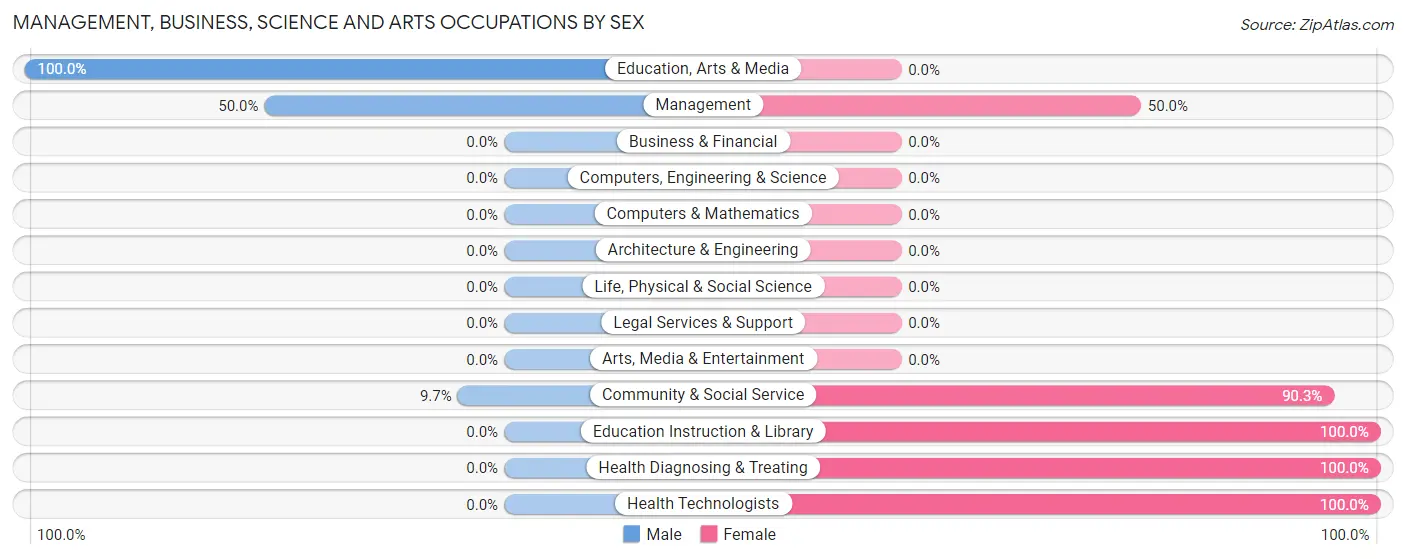
Management, Business, Science and Arts Occupations
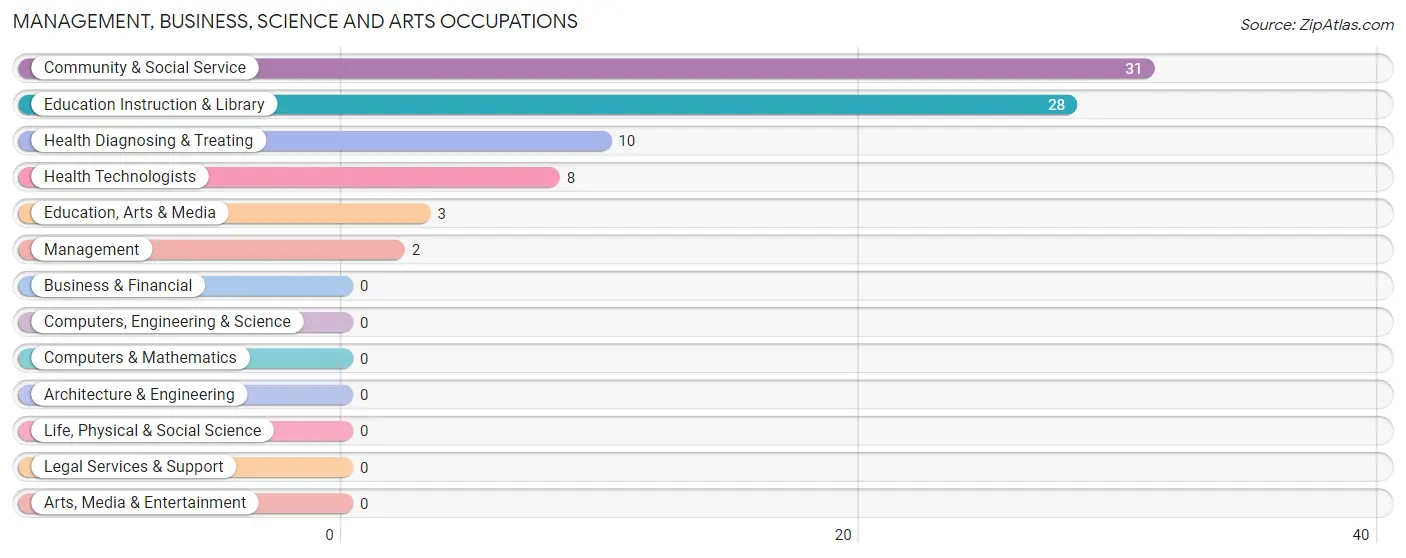
The most common Management, Business, Science and Arts occupations in Lake View are Community & Social Service (31 | 33.0%), Education Instruction & Library (28 | 29.8%), Health Diagnosing & Treating (10 | 10.6%), Health Technologists (8 | 8.5%), and Education, Arts & Media (3 | 3.2%).
Management, Business, Science and Arts Occupations by Sex
Within the Management, Business, Science and Arts occupations in Lake View, the most male-oriented occupations are Education, Arts & Media (100.0%), Management (50.0%), and Community & Social Service (9.7%), while the most female-oriented occupations are Education Instruction & Library (100.0%), Health Diagnosing & Treating (100.0%), and Health Technologists (100.0%).
| Occupation | Male | Female |
| Management | 1 (50.0%) | 1 (50.0%) |
| Business & Financial | 0 (0.0%) | 0 (0.0%) |
| Computers, Engineering & Science | 0 (0.0%) | 0 (0.0%) |
| Computers & Mathematics | 0 (0.0%) | 0 (0.0%) |
| Architecture & Engineering | 0 (0.0%) | 0 (0.0%) |
| Life, Physical & Social Science | 0 (0.0%) | 0 (0.0%) |
| Community & Social Service | 3 (9.7%) | 28 (90.3%) |
| Education, Arts & Media | 3 (100.0%) | 0 (0.0%) |
| Legal Services & Support | 0 (0.0%) | 0 (0.0%) |
| Education Instruction & Library | 0 (0.0%) | 28 (100.0%) |
| Arts, Media & Entertainment | 0 (0.0%) | 0 (0.0%) |
| Health Diagnosing & Treating | 0 (0.0%) | 10 (100.0%) |
| Health Technologists | 0 (0.0%) | 8 (100.0%) |
| Total (Category) | 4 (9.3%) | 39 (90.7%) |
| Total (Overall) | 27 (28.7%) | 67 (71.3%) |
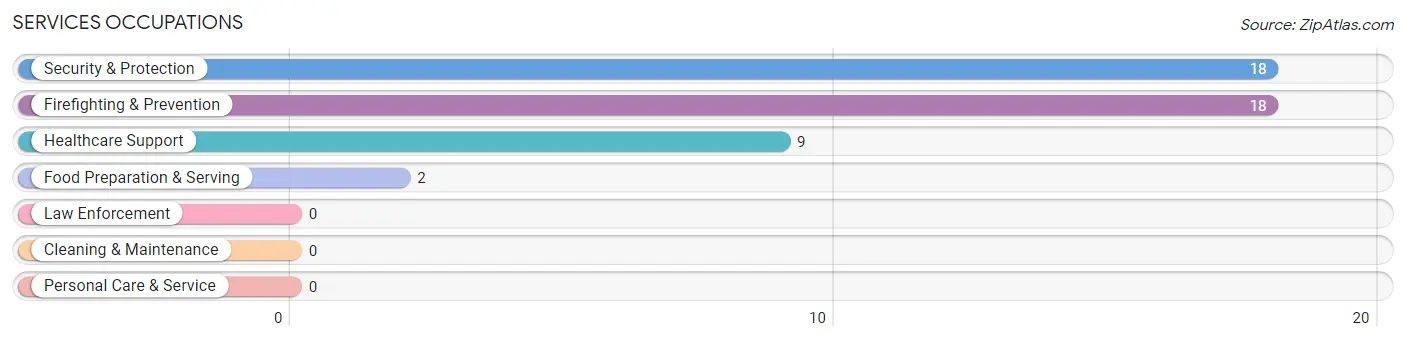
Services Occupations
The most common Services occupations in Lake View are Security & Protection (18 | 19.2%), Firefighting & Prevention (18 | 19.2%), Healthcare Support (9 | 9.6%), and Food Preparation & Serving (2 | 2.1%).
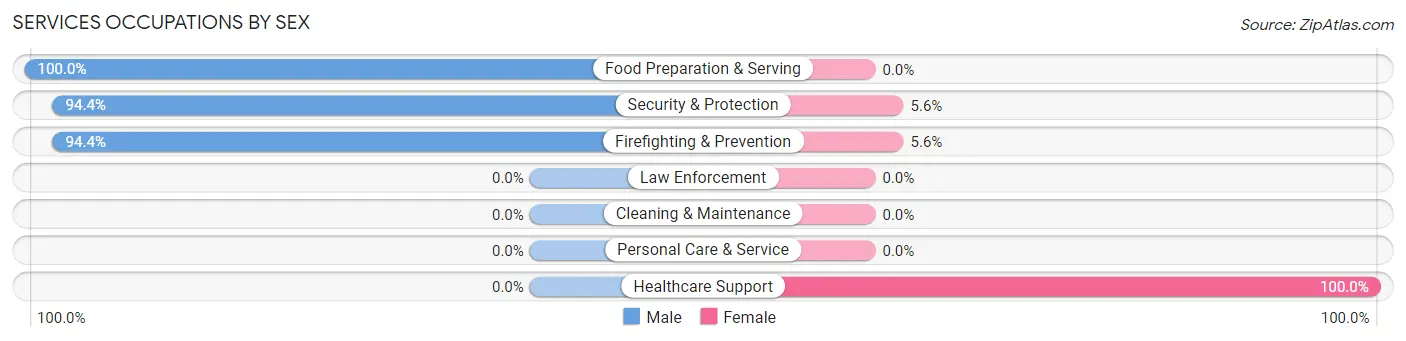
Services Occupations by Sex
Within the Services occupations in Lake View, the most male-oriented occupations are Food Preparation & Serving (100.0%), Security & Protection (94.4%), and Firefighting & Prevention (94.4%), while the most female-oriented occupations are Healthcare Support (100.0%), Security & Protection (5.6%), and Firefighting & Prevention (5.6%).
| Occupation | Male | Female |
| Healthcare Support | 0 (0.0%) | 9 (100.0%) |
| Security & Protection | 17 (94.4%) | 1 (5.6%) |
| Firefighting & Prevention | 17 (94.4%) | 1 (5.6%) |
| Law Enforcement | 0 (0.0%) | 0 (0.0%) |
| Food Preparation & Serving | 2 (100.0%) | 0 (0.0%) |
| Cleaning & Maintenance | 0 (0.0%) | 0 (0.0%) |
| Personal Care & Service | 0 (0.0%) | 0 (0.0%) |
| Total (Category) | 19 (65.5%) | 10 (34.5%) |
| Total (Overall) | 27 (28.7%) | 67 (71.3%) |
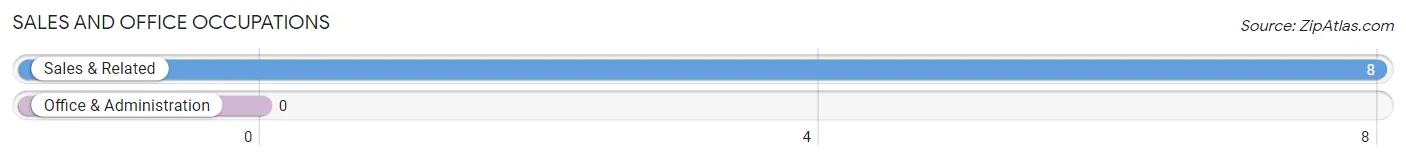
Sales and Office Occupations
The most common Sales and Office occupations in Lake View are , and Sales & Related (8 | 8.5%).
Sales and Office Occupations by Sex

| Occupation | Male | Female |
| Sales & Related | 0 (0.0%) | 8 (100.0%) |
| Office & Administration | 0 (0.0%) | 0 (0.0%) |
| Total (Category) | 0 (0.0%) | 8 (100.0%) |
| Total (Overall) | 27 (28.7%) | 67 (71.3%) |
Natural Resources, Construction and Maintenance Occupations
The most common Natural Resources, Construction and Maintenance occupations in Lake View are Construction & Extraction (3 | 3.2%), and Installation, Maintenance & Repair (1 | 1.1%).
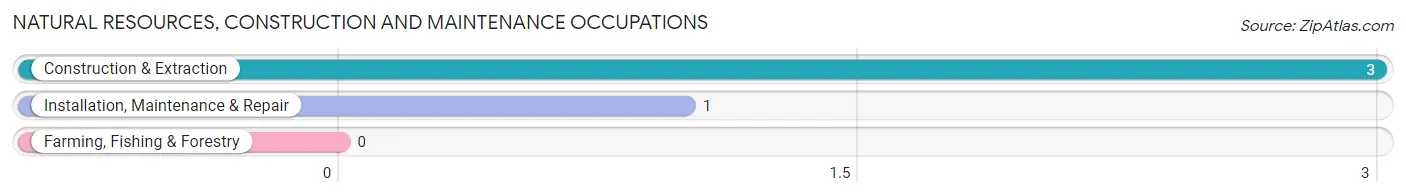
Natural Resources, Construction and Maintenance Occupations by Sex

| Occupation | Male | Female |
| Farming, Fishing & Forestry | 0 (0.0%) | 0 (0.0%) |
| Construction & Extraction | 3 (100.0%) | 0 (0.0%) |
| Installation, Maintenance & Repair | 1 (100.0%) | 0 (0.0%) |
| Total (Category) | 4 (100.0%) | 0 (0.0%) |
| Total (Overall) | 27 (28.7%) | 67 (71.3%) |
Production, Transportation and Moving Occupations
The most common Production, Transportation and Moving occupations in Lake View are Production (7 | 7.4%), and Transportation (3 | 3.2%).
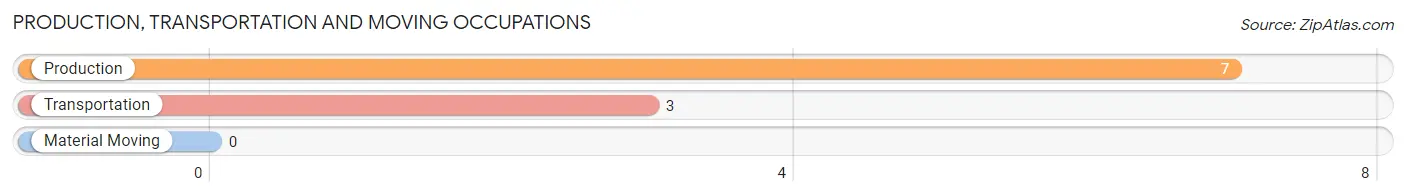
Production, Transportation and Moving Occupations by Sex
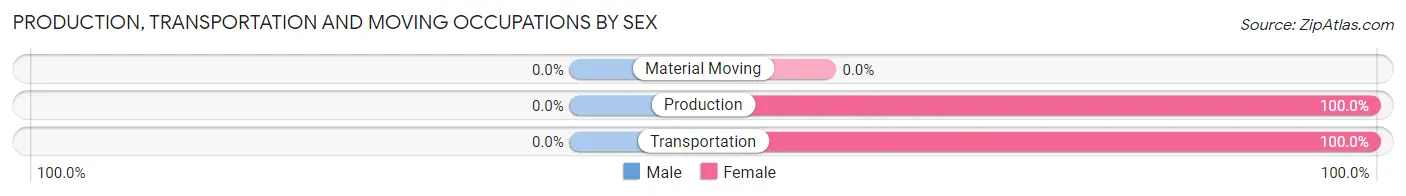
| Occupation | Male | Female |
| Production | 0 (0.0%) | 7 (100.0%) |
| Transportation | 0 (0.0%) | 3 (100.0%) |
| Material Moving | 0 (0.0%) | 0 (0.0%) |
| Total (Category) | 0 (0.0%) | 10 (100.0%) |
| Total (Overall) | 27 (28.7%) | 67 (71.3%) |
Employment Industries by Sex in Lake View
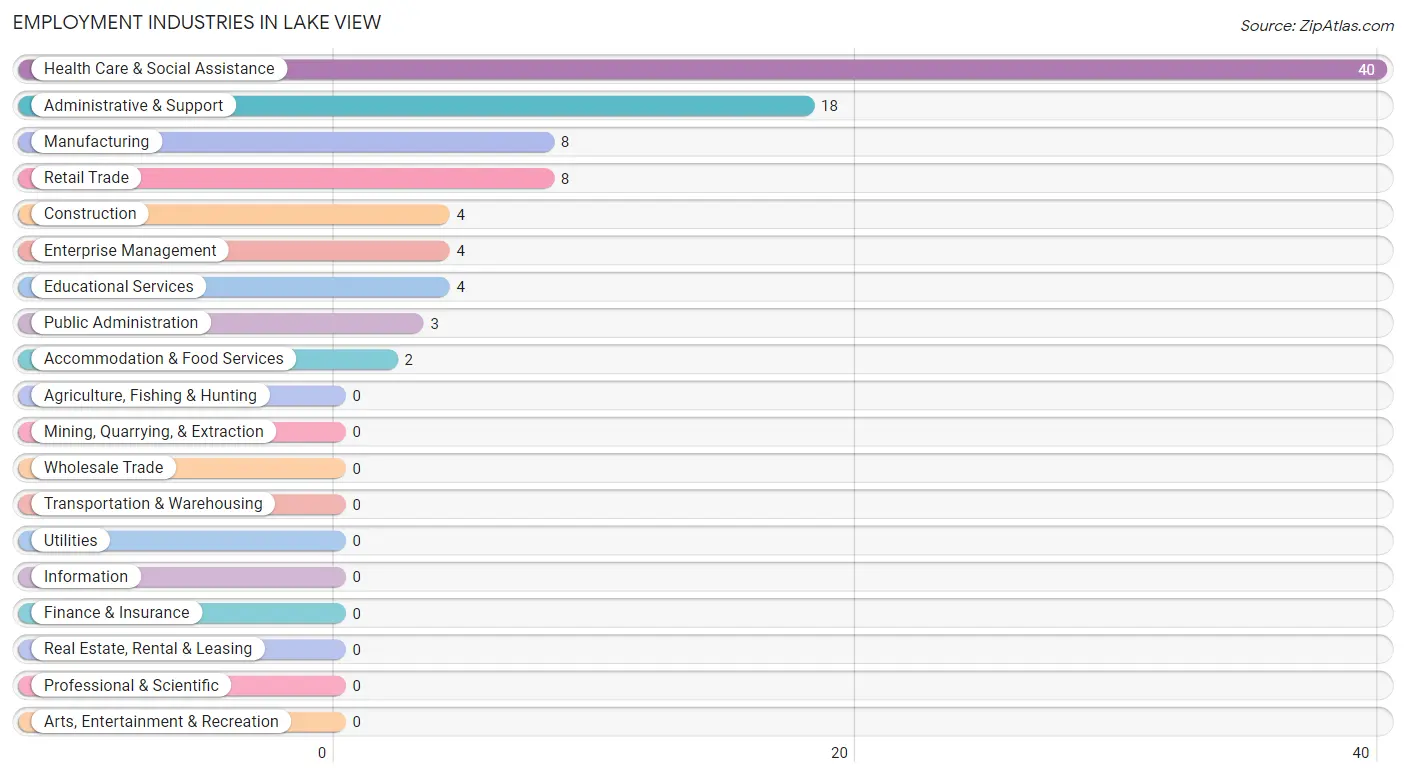
Employment Industries in Lake View
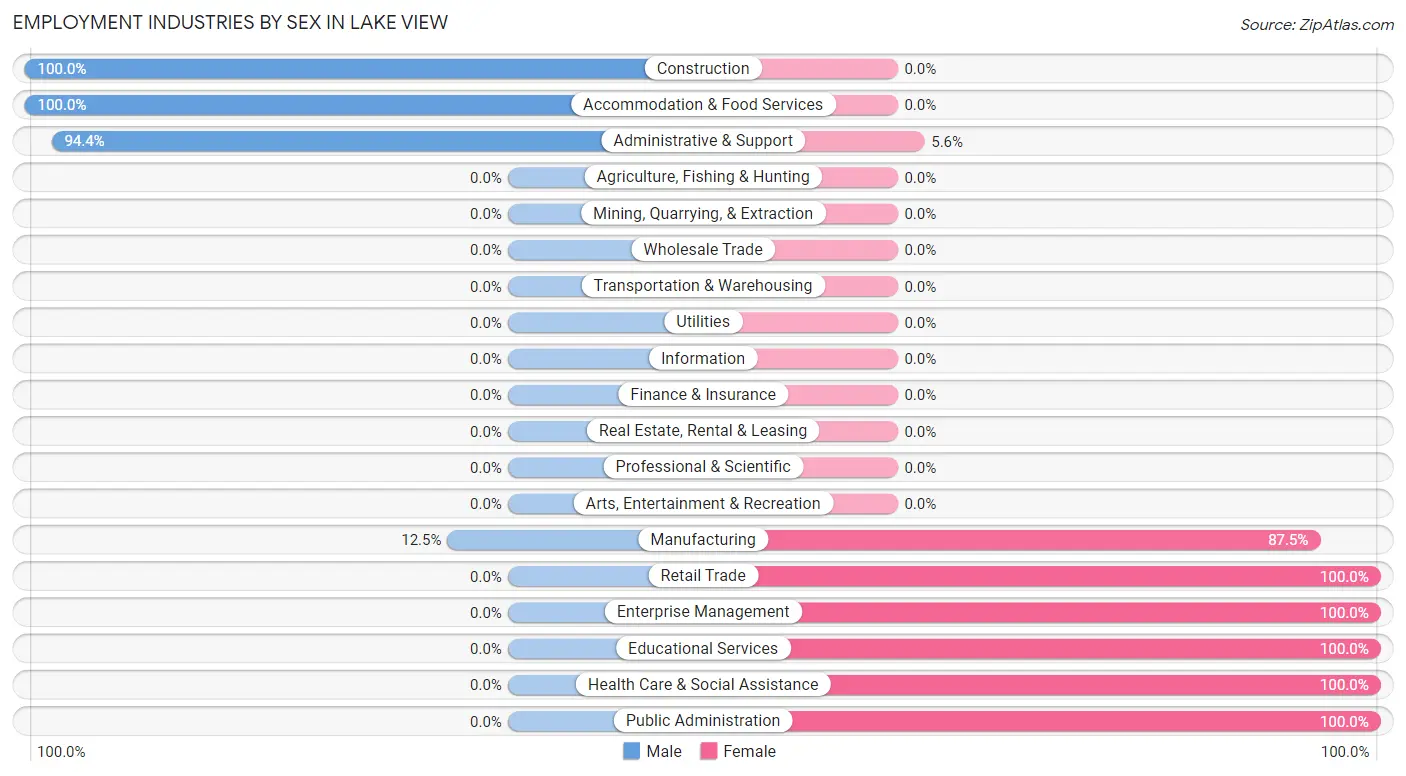
The major employment industries in Lake View include Health Care & Social Assistance (40 | 42.5%), Administrative & Support (18 | 19.2%), Manufacturing (8 | 8.5%), Retail Trade (8 | 8.5%), and Construction (4 | 4.3%).
Employment Industries by Sex in Lake View
The Lake View industries that see more men than women are Construction (100.0%), Accommodation & Food Services (100.0%), and Administrative & Support (94.4%), whereas the industries that tend to have a higher number of women are Retail Trade (100.0%), Enterprise Management (100.0%), and Educational Services (100.0%).
| Industry | Male | Female |
| Agriculture, Fishing & Hunting | 0 (0.0%) | 0 (0.0%) |
| Mining, Quarrying, & Extraction | 0 (0.0%) | 0 (0.0%) |
| Construction | 4 (100.0%) | 0 (0.0%) |
| Manufacturing | 1 (12.5%) | 7 (87.5%) |
| Wholesale Trade | 0 (0.0%) | 0 (0.0%) |
| Retail Trade | 0 (0.0%) | 8 (100.0%) |
| Transportation & Warehousing | 0 (0.0%) | 0 (0.0%) |
| Utilities | 0 (0.0%) | 0 (0.0%) |
| Information | 0 (0.0%) | 0 (0.0%) |
| Finance & Insurance | 0 (0.0%) | 0 (0.0%) |
| Real Estate, Rental & Leasing | 0 (0.0%) | 0 (0.0%) |
| Professional & Scientific | 0 (0.0%) | 0 (0.0%) |
| Enterprise Management | 0 (0.0%) | 4 (100.0%) |
| Administrative & Support | 17 (94.4%) | 1 (5.6%) |
| Educational Services | 0 (0.0%) | 4 (100.0%) |
| Health Care & Social Assistance | 0 (0.0%) | 40 (100.0%) |
| Arts, Entertainment & Recreation | 0 (0.0%) | 0 (0.0%) |
| Accommodation & Food Services | 2 (100.0%) | 0 (0.0%) |
| Public Administration | 0 (0.0%) | 3 (100.0%) |
| Total | 27 (28.7%) | 67 (71.3%) |
Education in Lake View
School Enrollment in Lake View
The most common levels of schooling among the 63 students in Lake View are high school (29 | 46.0%), elementary school (14 | 22.2%), and middle school (10 | 15.9%).
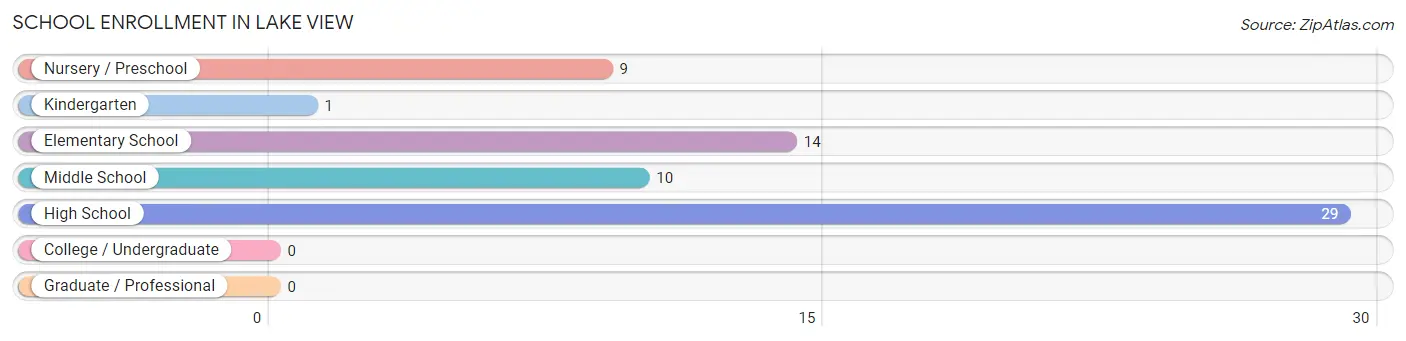
| School Level | # Students | % Students |
| Nursery / Preschool | 9 | 14.3% |
| Kindergarten | 1 | 1.6% |
| Elementary School | 14 | 22.2% |
| Middle School | 10 | 15.9% |
| High School | 29 | 46.0% |
| College / Undergraduate | 0 | 0.0% |
| Graduate / Professional | 0 | 0.0% |
| Total | 63 | 100.0% |
School Enrollment by Age by Funding Source in Lake View
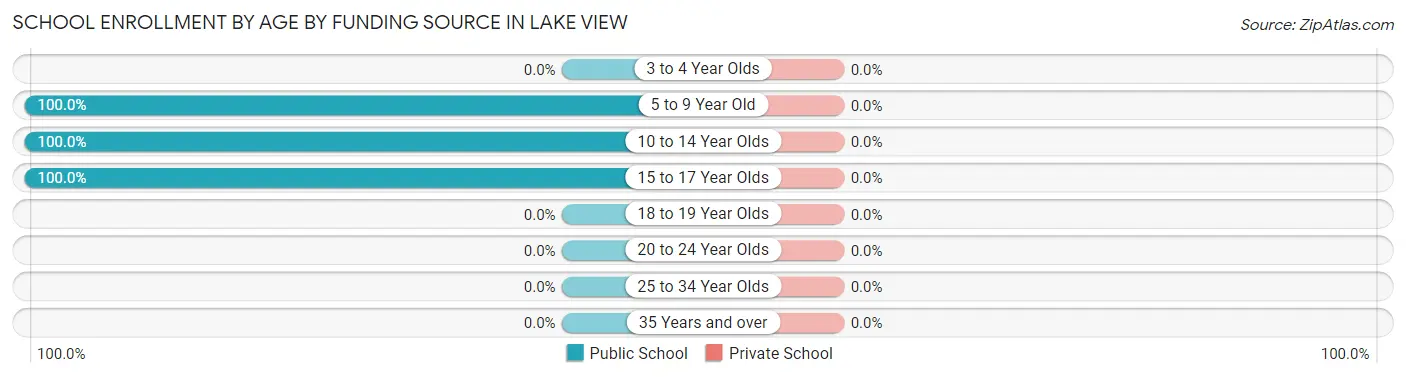
| Age Bracket | Public School | Private School |
| 3 to 4 Year Olds | 0 (0.0%) | 0 (0.0%) |
| 5 to 9 Year Old | 24 (100.0%) | 0 (0.0%) |
| 10 to 14 Year Olds | 17 (100.0%) | 0 (0.0%) |
| 15 to 17 Year Olds | 22 (100.0%) | 0 (0.0%) |
| 18 to 19 Year Olds | 0 (0.0%) | 0 (0.0%) |
| 20 to 24 Year Olds | 0 (0.0%) | 0 (0.0%) |
| 25 to 34 Year Olds | 0 (0.0%) | 0 (0.0%) |
| 35 Years and over | 0 (0.0%) | 0 (0.0%) |
| Total | 63 (100.0%) | 0 (0.0%) |
Educational Attainment by Field of Study in Lake View
Social sciences (7 | 22.6%), education (7 | 22.6%), arts & humanities (6 | 19.4%), computers & mathematics (4 | 12.9%), and science & technology (4 | 12.9%) are the most common fields of study among 31 individuals in Lake View who have obtained a bachelor's degree or higher.
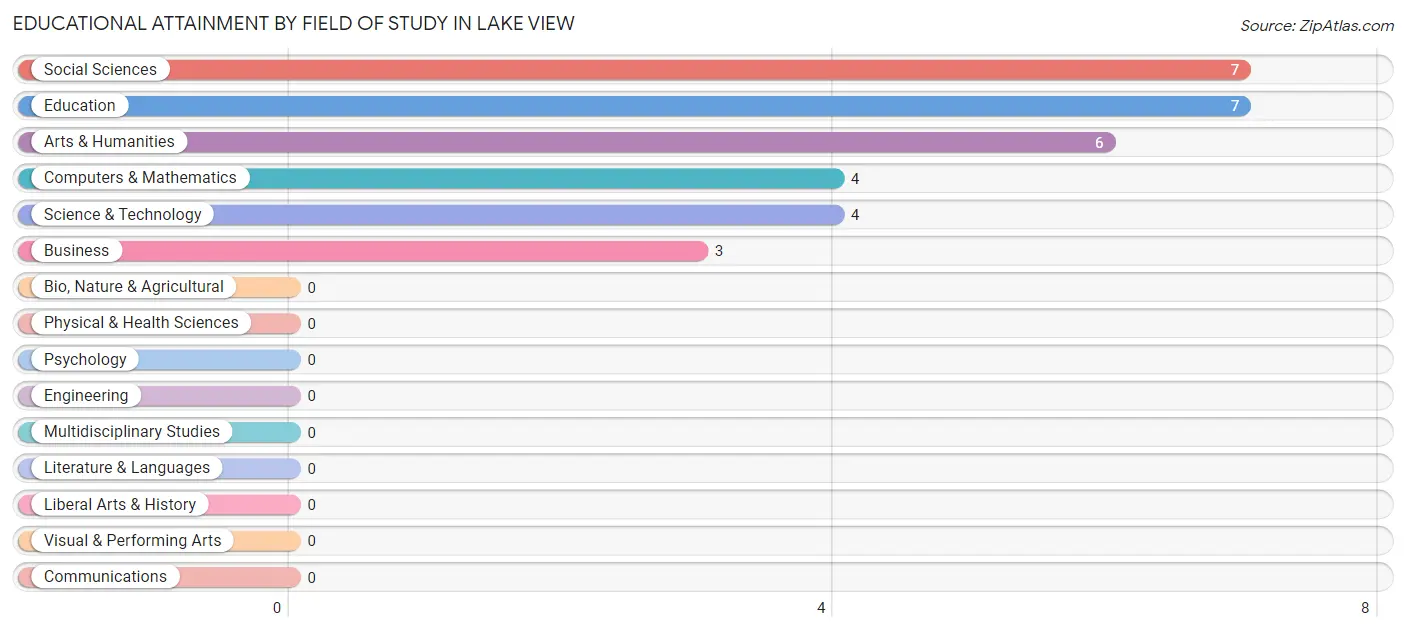
| Field of Study | # Graduates | % Graduates |
| Computers & Mathematics | 4 | 12.9% |
| Bio, Nature & Agricultural | 0 | 0.0% |
| Physical & Health Sciences | 0 | 0.0% |
| Psychology | 0 | 0.0% |
| Social Sciences | 7 | 22.6% |
| Engineering | 0 | 0.0% |
| Multidisciplinary Studies | 0 | 0.0% |
| Science & Technology | 4 | 12.9% |
| Business | 3 | 9.7% |
| Education | 7 | 22.6% |
| Literature & Languages | 0 | 0.0% |
| Liberal Arts & History | 0 | 0.0% |
| Visual & Performing Arts | 0 | 0.0% |
| Communications | 0 | 0.0% |
| Arts & Humanities | 6 | 19.4% |
| Total | 31 | 100.0% |
Transportation & Commute in Lake View
Vehicle Availability by Sex in Lake View
The most prevalent vehicle ownership categories in Lake View are males with 1 vehicle (19, accounting for 70.4%) and females with 1 vehicle (13, making up 33.9%).
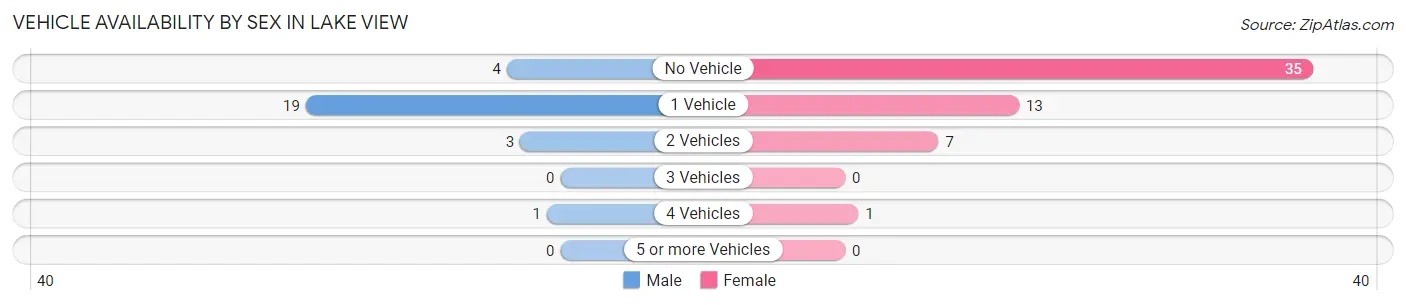
| Vehicles Available | Male | Female |
| No Vehicle | 4 (14.8%) | 35 (62.5%) |
| 1 Vehicle | 19 (70.4%) | 13 (23.2%) |
| 2 Vehicles | 3 (11.1%) | 7 (12.5%) |
| 3 Vehicles | 0 (0.0%) | 0 (0.0%) |
| 4 Vehicles | 1 (3.7%) | 1 (1.8%) |
| 5 or more Vehicles | 0 (0.0%) | 0 (0.0%) |
| Total | 27 (100.0%) | 56 (100.0%) |
Commute Time in Lake View
The most frequently occuring commute durations in Lake View are 5 to 9 minutes (35 commuters, 42.2%), 30 to 34 minutes (21 commuters, 25.3%), and less than 5 minutes (8 commuters, 9.6%).
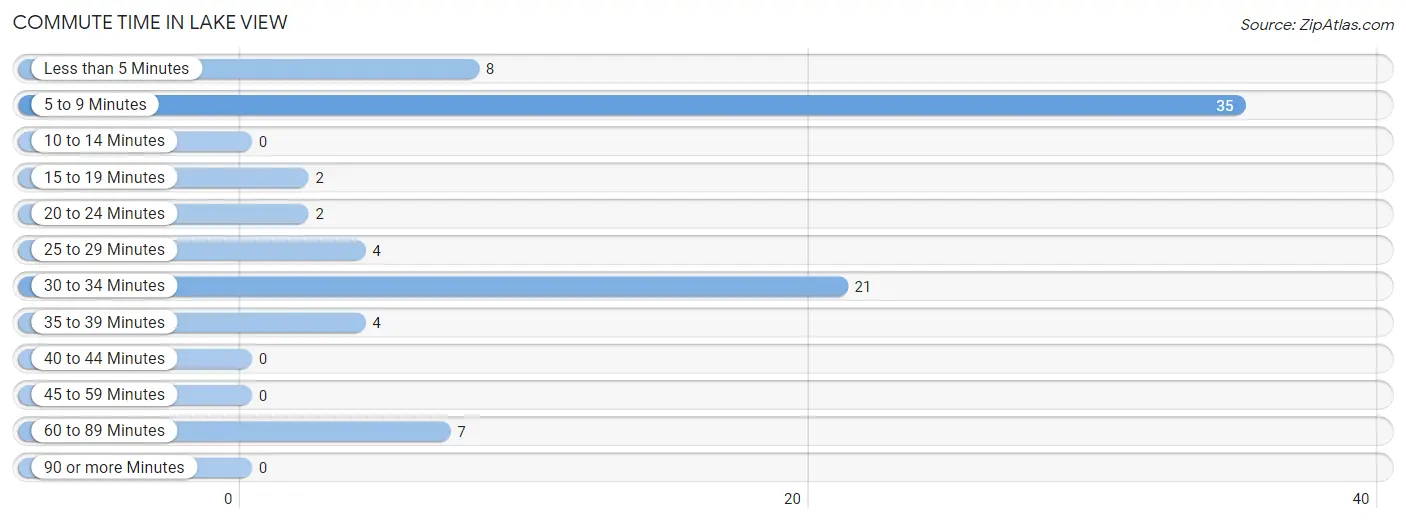
| Commute Time | # Commuters | % Commuters |
| Less than 5 Minutes | 8 | 9.6% |
| 5 to 9 Minutes | 35 | 42.2% |
| 10 to 14 Minutes | 0 | 0.0% |
| 15 to 19 Minutes | 2 | 2.4% |
| 20 to 24 Minutes | 2 | 2.4% |
| 25 to 29 Minutes | 4 | 4.8% |
| 30 to 34 Minutes | 21 | 25.3% |
| 35 to 39 Minutes | 4 | 4.8% |
| 40 to 44 Minutes | 0 | 0.0% |
| 45 to 59 Minutes | 0 | 0.0% |
| 60 to 89 Minutes | 7 | 8.4% |
| 90 or more Minutes | 0 | 0.0% |
Commute Time by Sex in Lake View
The most common commute times in Lake View are 30 to 34 minutes (21 commuters, 77.8%) for males and 5 to 9 minutes (35 commuters, 62.5%) for females.
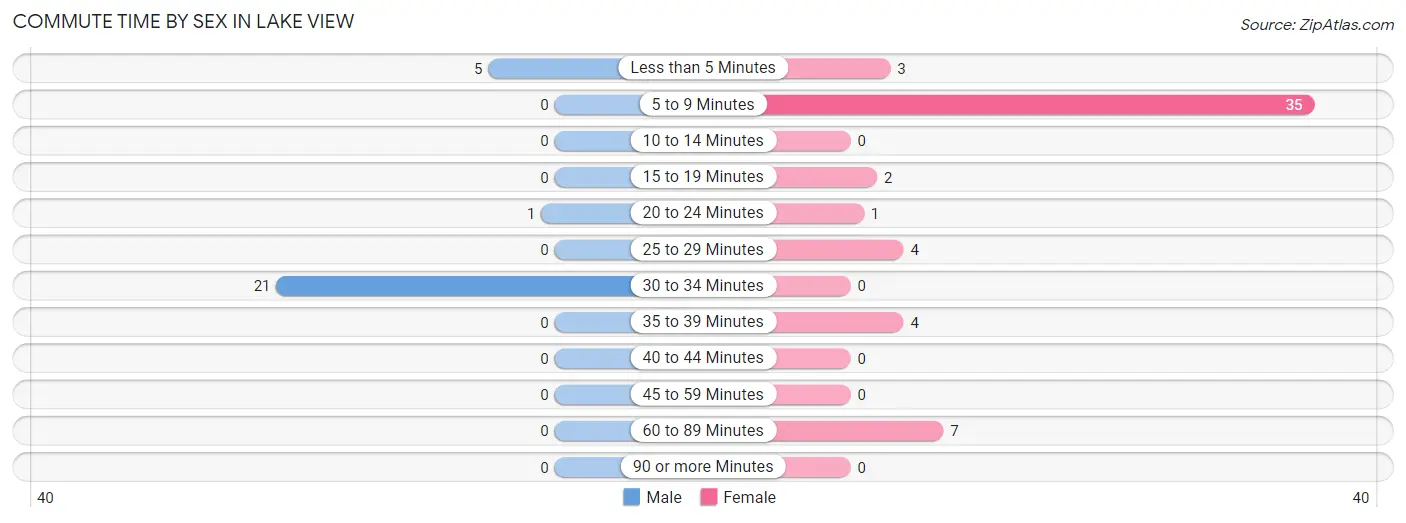
| Commute Time | Male | Female |
| Less than 5 Minutes | 5 (18.5%) | 3 (5.4%) |
| 5 to 9 Minutes | 0 (0.0%) | 35 (62.5%) |
| 10 to 14 Minutes | 0 (0.0%) | 0 (0.0%) |
| 15 to 19 Minutes | 0 (0.0%) | 2 (3.6%) |
| 20 to 24 Minutes | 1 (3.7%) | 1 (1.8%) |
| 25 to 29 Minutes | 0 (0.0%) | 4 (7.1%) |
| 30 to 34 Minutes | 21 (77.8%) | 0 (0.0%) |
| 35 to 39 Minutes | 0 (0.0%) | 4 (7.1%) |
| 40 to 44 Minutes | 0 (0.0%) | 0 (0.0%) |
| 45 to 59 Minutes | 0 (0.0%) | 0 (0.0%) |
| 60 to 89 Minutes | 0 (0.0%) | 7 (12.5%) |
| 90 or more Minutes | 0 (0.0%) | 0 (0.0%) |
Time of Departure to Work by Sex in Lake View
The most frequent times of departure to work in Lake View are 6:30 AM to 6:59 AM (17, 63.0%) for males and 6:30 AM to 6:59 AM (31, 55.4%) for females.
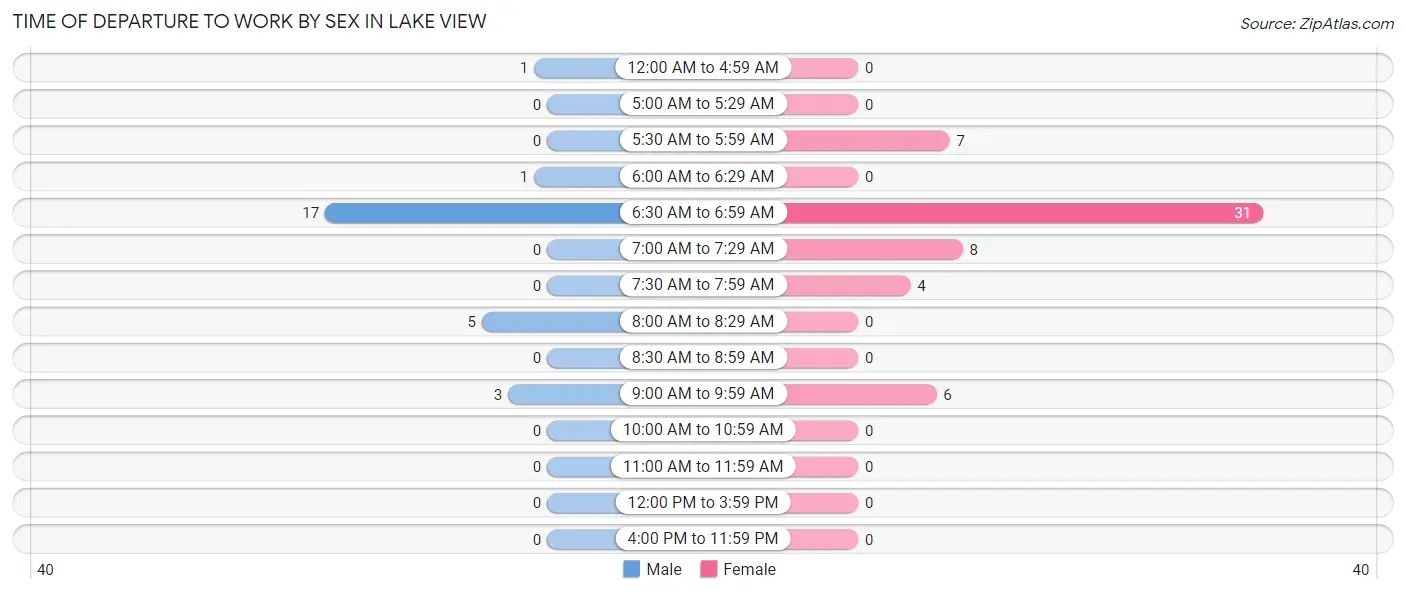
| Time of Departure | Male | Female |
| 12:00 AM to 4:59 AM | 1 (3.7%) | 0 (0.0%) |
| 5:00 AM to 5:29 AM | 0 (0.0%) | 0 (0.0%) |
| 5:30 AM to 5:59 AM | 0 (0.0%) | 7 (12.5%) |
| 6:00 AM to 6:29 AM | 1 (3.7%) | 0 (0.0%) |
| 6:30 AM to 6:59 AM | 17 (63.0%) | 31 (55.4%) |
| 7:00 AM to 7:29 AM | 0 (0.0%) | 8 (14.3%) |
| 7:30 AM to 7:59 AM | 0 (0.0%) | 4 (7.1%) |
| 8:00 AM to 8:29 AM | 5 (18.5%) | 0 (0.0%) |
| 8:30 AM to 8:59 AM | 0 (0.0%) | 0 (0.0%) |
| 9:00 AM to 9:59 AM | 3 (11.1%) | 6 (10.7%) |
| 10:00 AM to 10:59 AM | 0 (0.0%) | 0 (0.0%) |
| 11:00 AM to 11:59 AM | 0 (0.0%) | 0 (0.0%) |
| 12:00 PM to 3:59 PM | 0 (0.0%) | 0 (0.0%) |
| 4:00 PM to 11:59 PM | 0 (0.0%) | 0 (0.0%) |
| Total | 27 (100.0%) | 56 (100.0%) |
Housing Occupancy in Lake View
Occupancy by Ownership in Lake View
Of the total 170 dwellings in Lake View, owner-occupied units account for 50 (29.4%), while renter-occupied units make up 120 (70.6%).
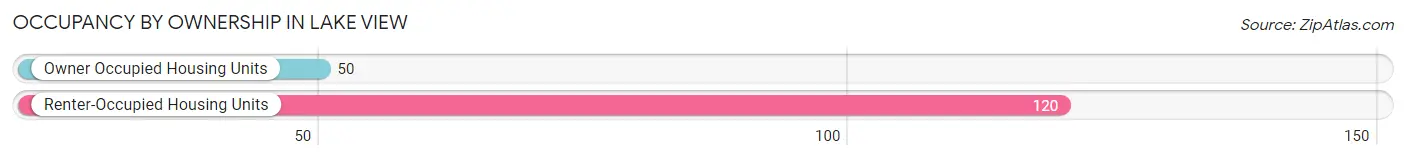
| Occupancy | # Housing Units | % Housing Units |
| Owner Occupied Housing Units | 50 | 29.4% |
| Renter-Occupied Housing Units | 120 | 70.6% |
| Total Occupied Housing Units | 170 | 100.0% |
Occupancy by Household Size in Lake View
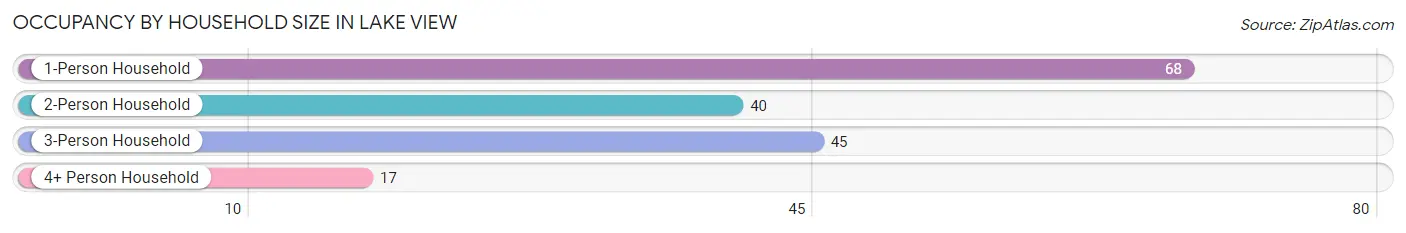
| Household Size | # Housing Units | % Housing Units |
| 1-Person Household | 68 | 40.0% |
| 2-Person Household | 40 | 23.5% |
| 3-Person Household | 45 | 26.5% |
| 4+ Person Household | 17 | 10.0% |
| Total Housing Units | 170 | 100.0% |
Occupancy by Ownership by Household Size in Lake View
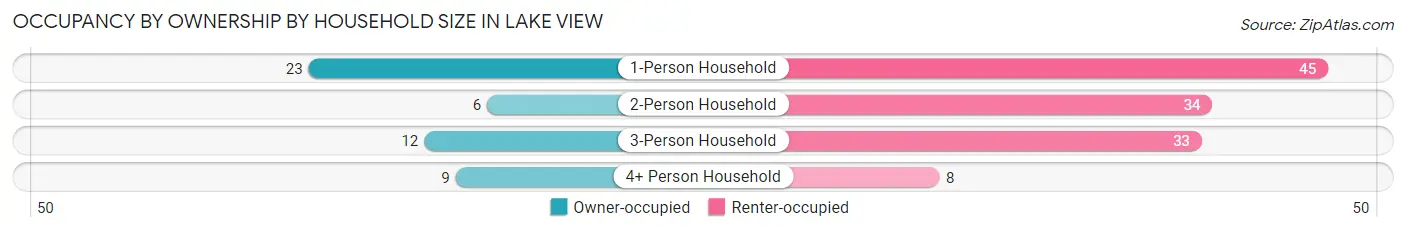
| Household Size | Owner-occupied | Renter-occupied |
| 1-Person Household | 23 (33.8%) | 45 (66.2%) |
| 2-Person Household | 6 (15.0%) | 34 (85.0%) |
| 3-Person Household | 12 (26.7%) | 33 (73.3%) |
| 4+ Person Household | 9 (52.9%) | 8 (47.1%) |
| Total Housing Units | 50 (29.4%) | 120 (70.6%) |
Occupancy by Educational Attainment in Lake View
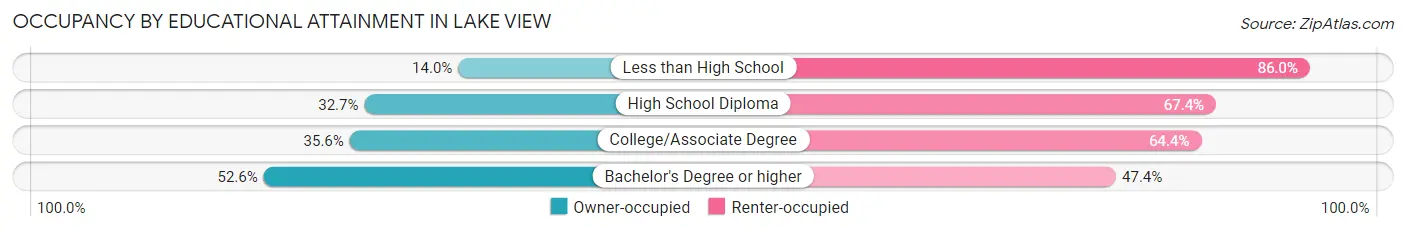
| Household Size | Owner-occupied | Renter-occupied |
| Less than High School | 8 (14.0%) | 49 (86.0%) |
| High School Diploma | 16 (32.7%) | 33 (67.3%) |
| College/Associate Degree | 16 (35.6%) | 29 (64.4%) |
| Bachelor's Degree or higher | 10 (52.6%) | 9 (47.4%) |
Occupancy by Age of Householder in Lake View
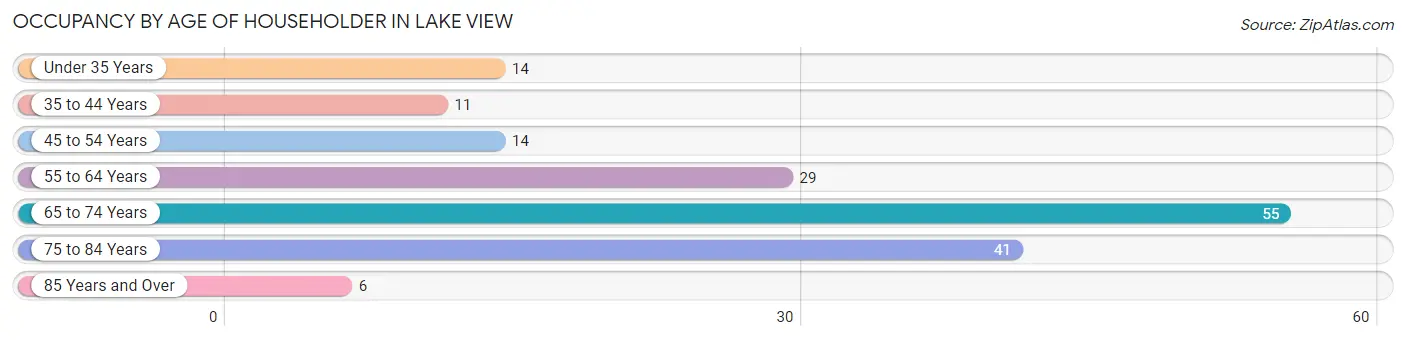
| Age Bracket | # Households | % Households |
| Under 35 Years | 14 | 8.2% |
| 35 to 44 Years | 11 | 6.5% |
| 45 to 54 Years | 14 | 8.2% |
| 55 to 64 Years | 29 | 17.1% |
| 65 to 74 Years | 55 | 32.4% |
| 75 to 84 Years | 41 | 24.1% |
| 85 Years and Over | 6 | 3.5% |
| Total | 170 | 100.0% |
Housing Finances in Lake View
Median Income by Occupancy in Lake View
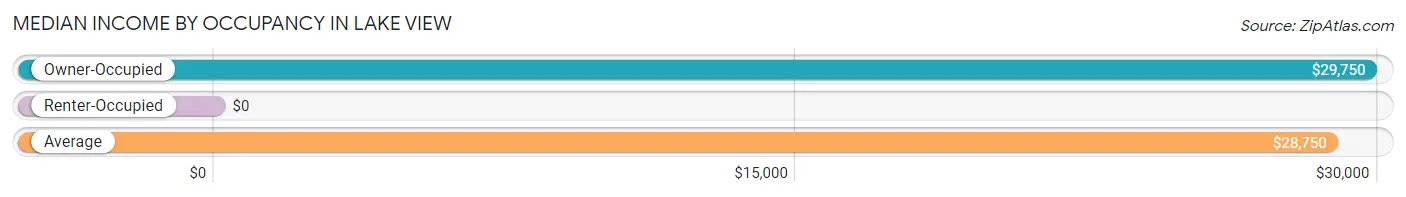
| Occupancy Type | # Households | Median Income |
| Owner-Occupied | 50 (29.4%) | $29,750 |
| Renter-Occupied | 120 (70.6%) | $0 |
| Average | 170 (100.0%) | $28,750 |
Occupancy by Householder Income Bracket in Lake View
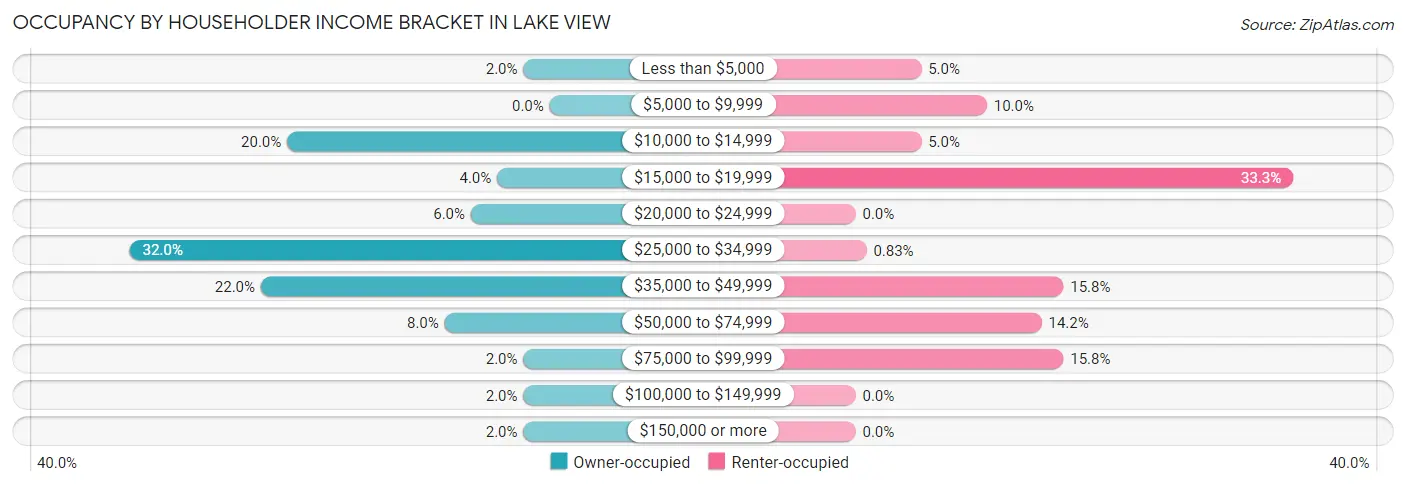
| Income Bracket | Owner-occupied | Renter-occupied |
| Less than $5,000 | 1 (2.0%) | 6 (5.0%) |
| $5,000 to $9,999 | 0 (0.0%) | 12 (10.0%) |
| $10,000 to $14,999 | 10 (20.0%) | 6 (5.0%) |
| $15,000 to $19,999 | 2 (4.0%) | 40 (33.3%) |
| $20,000 to $24,999 | 3 (6.0%) | 0 (0.0%) |
| $25,000 to $34,999 | 16 (32.0%) | 1 (0.8%) |
| $35,000 to $49,999 | 11 (22.0%) | 19 (15.8%) |
| $50,000 to $74,999 | 4 (8.0%) | 17 (14.2%) |
| $75,000 to $99,999 | 1 (2.0%) | 19 (15.8%) |
| $100,000 to $149,999 | 1 (2.0%) | 0 (0.0%) |
| $150,000 or more | 1 (2.0%) | 0 (0.0%) |
| Total | 50 (100.0%) | 120 (100.0%) |
Monthly Housing Cost Tiers in Lake View
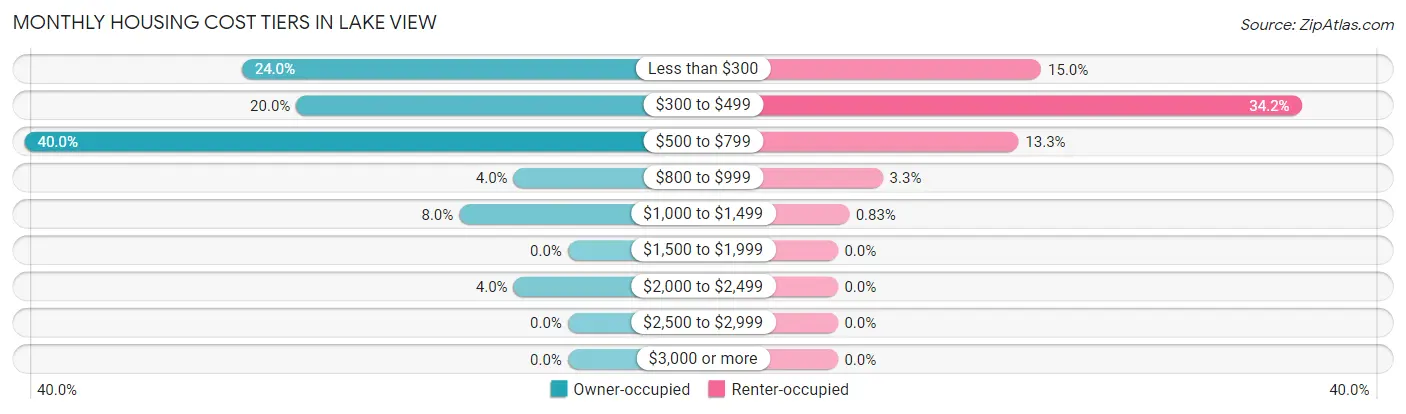
| Monthly Cost | Owner-occupied | Renter-occupied |
| Less than $300 | 12 (24.0%) | 18 (15.0%) |
| $300 to $499 | 10 (20.0%) | 41 (34.2%) |
| $500 to $799 | 20 (40.0%) | 16 (13.3%) |
| $800 to $999 | 2 (4.0%) | 4 (3.3%) |
| $1,000 to $1,499 | 4 (8.0%) | 1 (0.8%) |
| $1,500 to $1,999 | 0 (0.0%) | 0 (0.0%) |
| $2,000 to $2,499 | 2 (4.0%) | 0 (0.0%) |
| $2,500 to $2,999 | 0 (0.0%) | 0 (0.0%) |
| $3,000 or more | 0 (0.0%) | 0 (0.0%) |
| Total | 50 (100.0%) | 120 (100.0%) |
Physical Housing Characteristics in Lake View
Housing Structures in Lake View
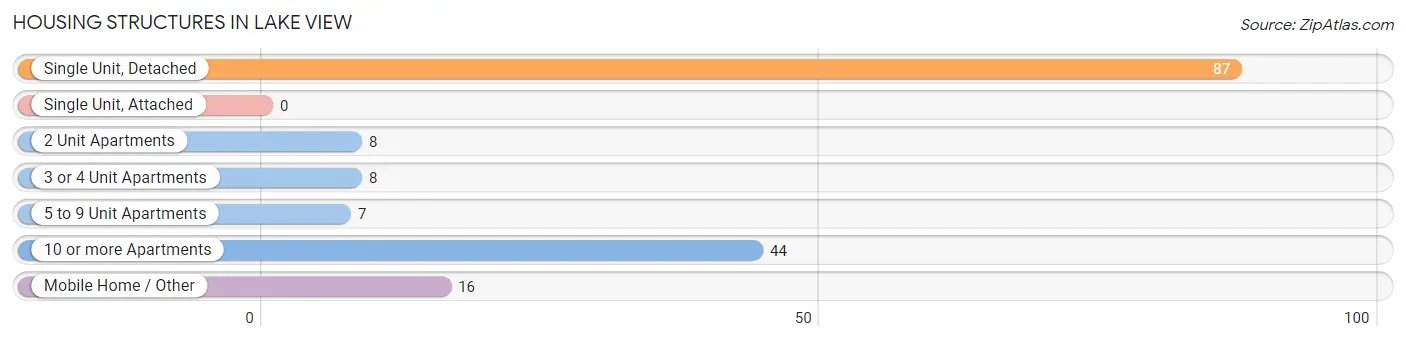
| Structure Type | # Housing Units | % Housing Units |
| Single Unit, Detached | 87 | 51.2% |
| Single Unit, Attached | 0 | 0.0% |
| 2 Unit Apartments | 8 | 4.7% |
| 3 or 4 Unit Apartments | 8 | 4.7% |
| 5 to 9 Unit Apartments | 7 | 4.1% |
| 10 or more Apartments | 44 | 25.9% |
| Mobile Home / Other | 16 | 9.4% |
| Total | 170 | 100.0% |
Housing Structures by Occupancy in Lake View
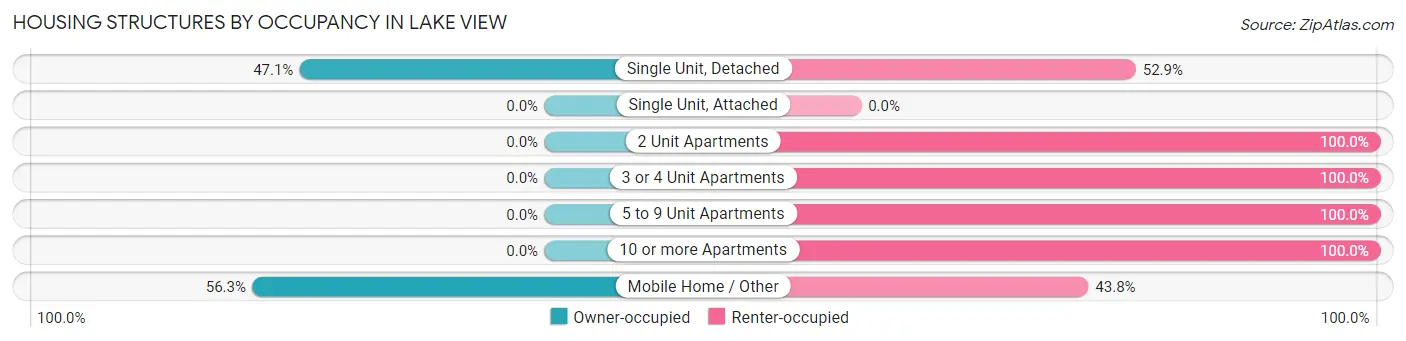
| Structure Type | Owner-occupied | Renter-occupied |
| Single Unit, Detached | 41 (47.1%) | 46 (52.9%) |
| Single Unit, Attached | 0 (0.0%) | 0 (0.0%) |
| 2 Unit Apartments | 0 (0.0%) | 8 (100.0%) |
| 3 or 4 Unit Apartments | 0 (0.0%) | 8 (100.0%) |
| 5 to 9 Unit Apartments | 0 (0.0%) | 7 (100.0%) |
| 10 or more Apartments | 0 (0.0%) | 44 (100.0%) |
| Mobile Home / Other | 9 (56.2%) | 7 (43.8%) |
| Total | 50 (29.4%) | 120 (70.6%) |
Housing Structures by Number of Rooms in Lake View
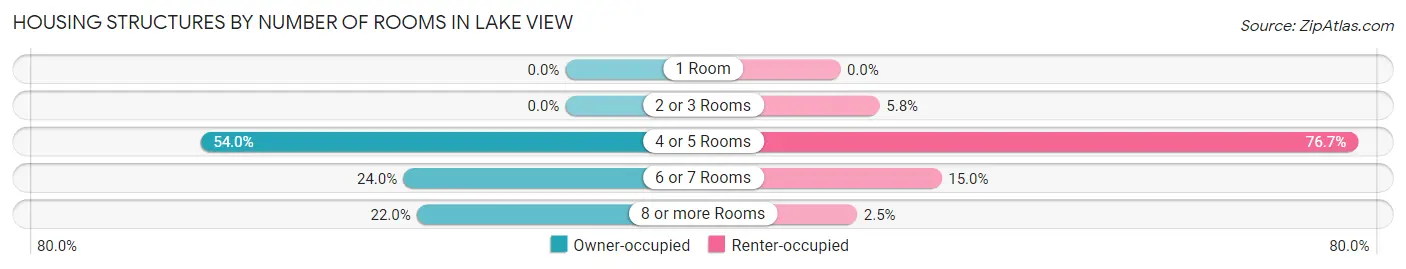
| Number of Rooms | Owner-occupied | Renter-occupied |
| 1 Room | 0 (0.0%) | 0 (0.0%) |
| 2 or 3 Rooms | 0 (0.0%) | 7 (5.8%) |
| 4 or 5 Rooms | 27 (54.0%) | 92 (76.7%) |
| 6 or 7 Rooms | 12 (24.0%) | 18 (15.0%) |
| 8 or more Rooms | 11 (22.0%) | 3 (2.5%) |
| Total | 50 (100.0%) | 120 (100.0%) |
Housing Structure by Heating Type in Lake View
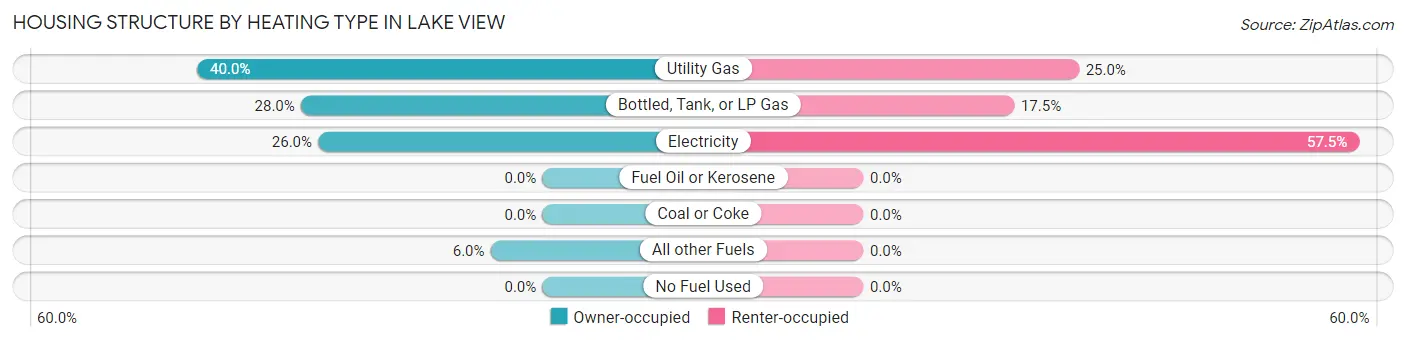
| Heating Type | Owner-occupied | Renter-occupied |
| Utility Gas | 20 (40.0%) | 30 (25.0%) |
| Bottled, Tank, or LP Gas | 14 (28.0%) | 21 (17.5%) |
| Electricity | 13 (26.0%) | 69 (57.5%) |
| Fuel Oil or Kerosene | 0 (0.0%) | 0 (0.0%) |
| Coal or Coke | 0 (0.0%) | 0 (0.0%) |
| All other Fuels | 3 (6.0%) | 0 (0.0%) |
| No Fuel Used | 0 (0.0%) | 0 (0.0%) |
| Total | 50 (100.0%) | 120 (100.0%) |
Household Vehicle Usage in Lake View
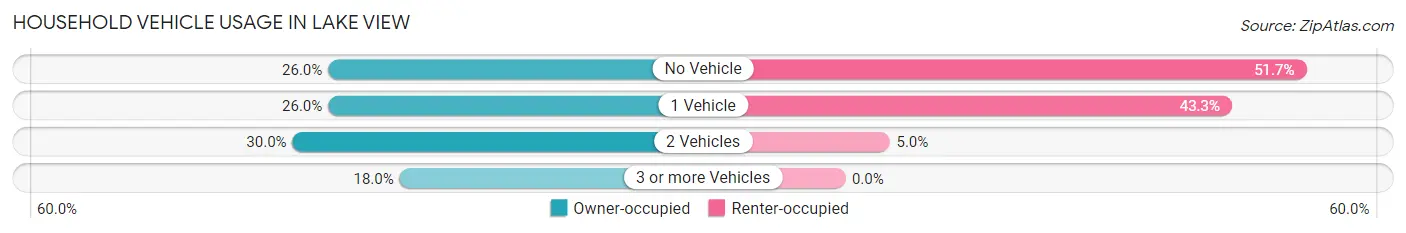
| Vehicles per Household | Owner-occupied | Renter-occupied |
| No Vehicle | 13 (26.0%) | 62 (51.7%) |
| 1 Vehicle | 13 (26.0%) | 52 (43.3%) |
| 2 Vehicles | 15 (30.0%) | 6 (5.0%) |
| 3 or more Vehicles | 9 (18.0%) | 0 (0.0%) |
| Total | 50 (100.0%) | 120 (100.0%) |
Real Estate & Mortgages in Lake View
Real Estate and Mortgage Overview in Lake View
| Characteristic | Without Mortgage | With Mortgage |
| Housing Units | 38 | 12 |
| Median Property Value | $42,700 | $0 |
| Median Household Income | $30,000 | $0 |
| Monthly Housing Costs | $450 | $0 |
| Real Estate Taxes | $199 | $0 |
Property Value by Mortgage Status in Lake View
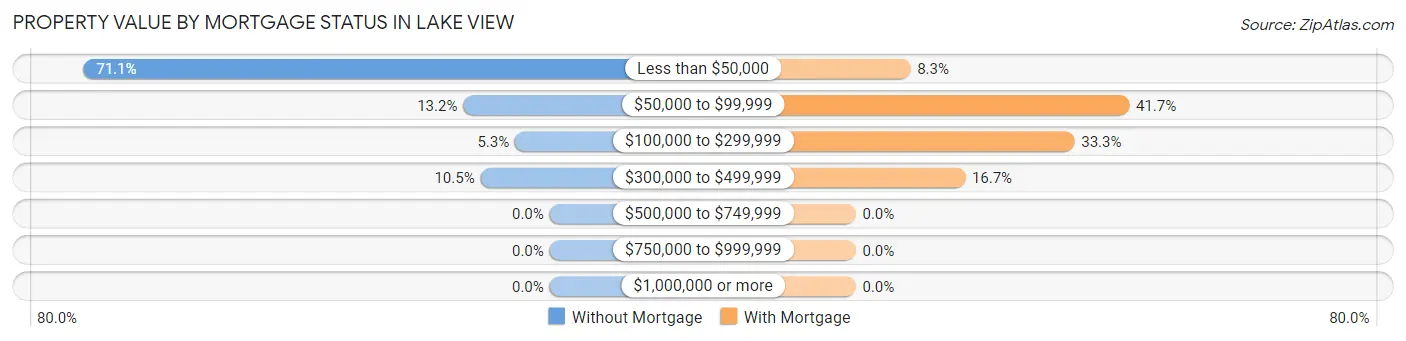
| Property Value | Without Mortgage | With Mortgage |
| Less than $50,000 | 27 (71.1%) | 1 (8.3%) |
| $50,000 to $99,999 | 5 (13.2%) | 5 (41.7%) |
| $100,000 to $299,999 | 2 (5.3%) | 4 (33.3%) |
| $300,000 to $499,999 | 4 (10.5%) | 2 (16.7%) |
| $500,000 to $749,999 | 0 (0.0%) | 0 (0.0%) |
| $750,000 to $999,999 | 0 (0.0%) | 0 (0.0%) |
| $1,000,000 or more | 0 (0.0%) | 0 (0.0%) |
| Total | 38 (100.0%) | 12 (100.0%) |
Household Income by Mortgage Status in Lake View
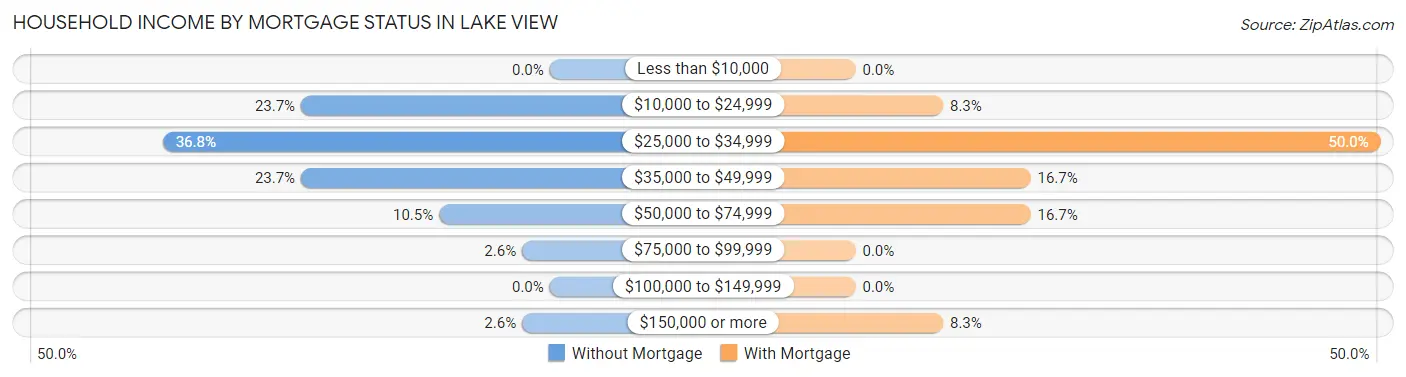
| Household Income | Without Mortgage | With Mortgage |
| Less than $10,000 | 0 (0.0%) | 0 (0.0%) |
| $10,000 to $24,999 | 9 (23.7%) | 1 (8.3%) |
| $25,000 to $34,999 | 14 (36.8%) | 6 (50.0%) |
| $35,000 to $49,999 | 9 (23.7%) | 2 (16.7%) |
| $50,000 to $74,999 | 4 (10.5%) | 2 (16.7%) |
| $75,000 to $99,999 | 1 (2.6%) | 0 (0.0%) |
| $100,000 to $149,999 | 0 (0.0%) | 0 (0.0%) |
| $150,000 or more | 1 (2.6%) | 1 (8.3%) |
| Total | 38 (100.0%) | 12 (100.0%) |
Property Value to Household Income Ratio in Lake View
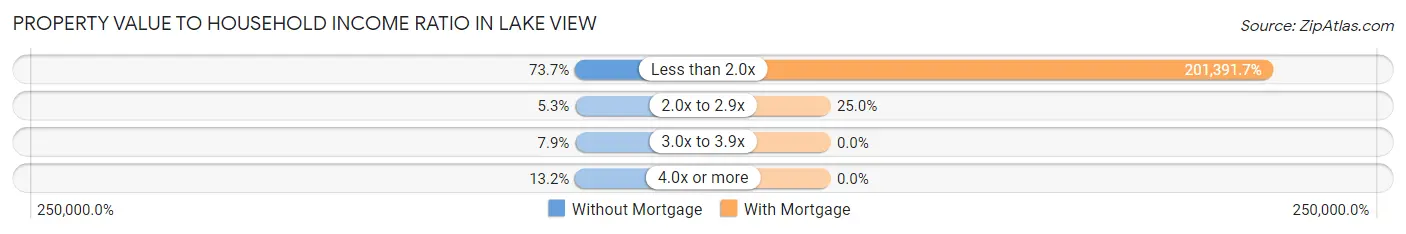
| Value-to-Income Ratio | Without Mortgage | With Mortgage |
| Less than 2.0x | 28 (73.7%) | 24,167 (201,391.7%) |
| 2.0x to 2.9x | 2 (5.3%) | 3 (25.0%) |
| 3.0x to 3.9x | 3 (7.9%) | 0 (0.0%) |
| 4.0x or more | 5 (13.2%) | 0 (0.0%) |
| Total | 38 (100.0%) | 12 (100.0%) |
Real Estate Taxes by Mortgage Status in Lake View
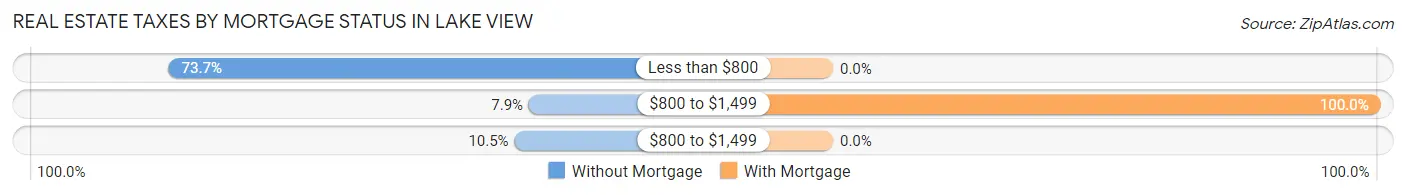
| Property Taxes | Without Mortgage | With Mortgage |
| Less than $800 | 28 (73.7%) | 0 (0.0%) |
| $800 to $1,499 | 3 (7.9%) | 12 (100.0%) |
| $800 to $1,499 | 4 (10.5%) | 0 (0.0%) |
| Total | 38 (100.0%) | 12 (100.0%) |
Health & Disability in Lake View
Health Insurance Coverage by Age in Lake View
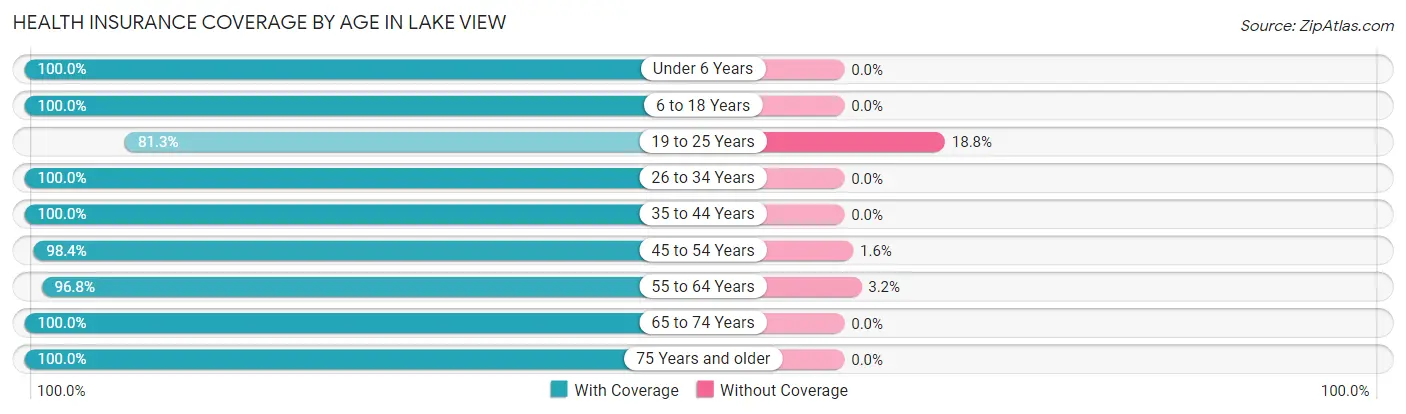
| Age Bracket | With Coverage | Without Coverage |
| Under 6 Years | 44 (100.0%) | 0 (0.0%) |
| 6 to 18 Years | 69 (100.0%) | 0 (0.0%) |
| 19 to 25 Years | 26 (81.2%) | 6 (18.8%) |
| 26 to 34 Years | 24 (100.0%) | 0 (0.0%) |
| 35 to 44 Years | 24 (100.0%) | 0 (0.0%) |
| 45 to 54 Years | 60 (98.4%) | 1 (1.6%) |
| 55 to 64 Years | 61 (96.8%) | 2 (3.2%) |
| 65 to 74 Years | 68 (100.0%) | 0 (0.0%) |
| 75 Years and older | 69 (100.0%) | 0 (0.0%) |
| Total | 445 (98.0%) | 9 (2.0%) |
Health Insurance Coverage by Citizenship Status in Lake View
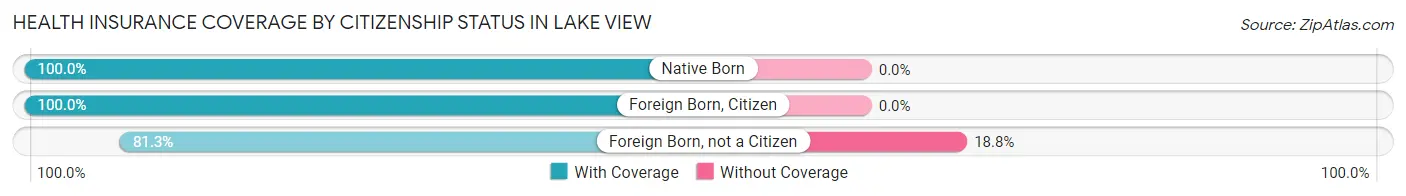
| Citizenship Status | With Coverage | Without Coverage |
| Native Born | 44 (100.0%) | 0 (0.0%) |
| Foreign Born, Citizen | 69 (100.0%) | 0 (0.0%) |
| Foreign Born, not a Citizen | 26 (81.2%) | 6 (18.8%) |
Health Insurance Coverage by Household Income in Lake View
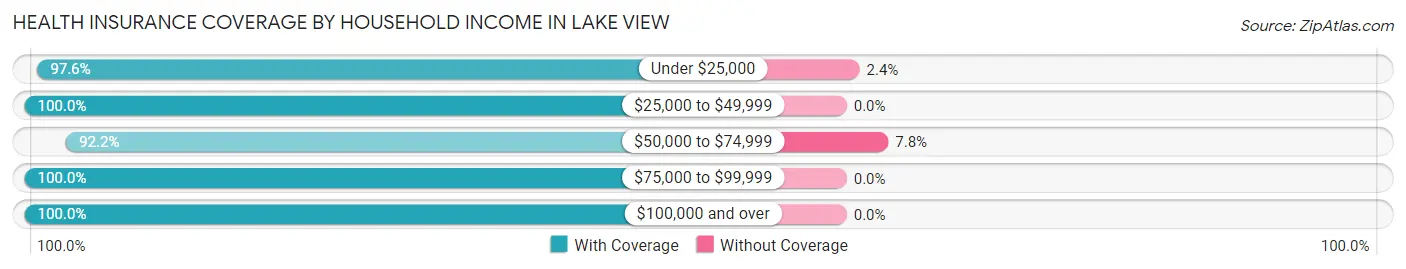
| Household Income | With Coverage | Without Coverage |
| Under $25,000 | 122 (97.6%) | 3 (2.4%) |
| $25,000 to $49,999 | 174 (100.0%) | 0 (0.0%) |
| $50,000 to $74,999 | 71 (92.2%) | 6 (7.8%) |
| $75,000 to $99,999 | 72 (100.0%) | 0 (0.0%) |
| $100,000 and over | 6 (100.0%) | 0 (0.0%) |
Public vs Private Health Insurance Coverage by Age in Lake View
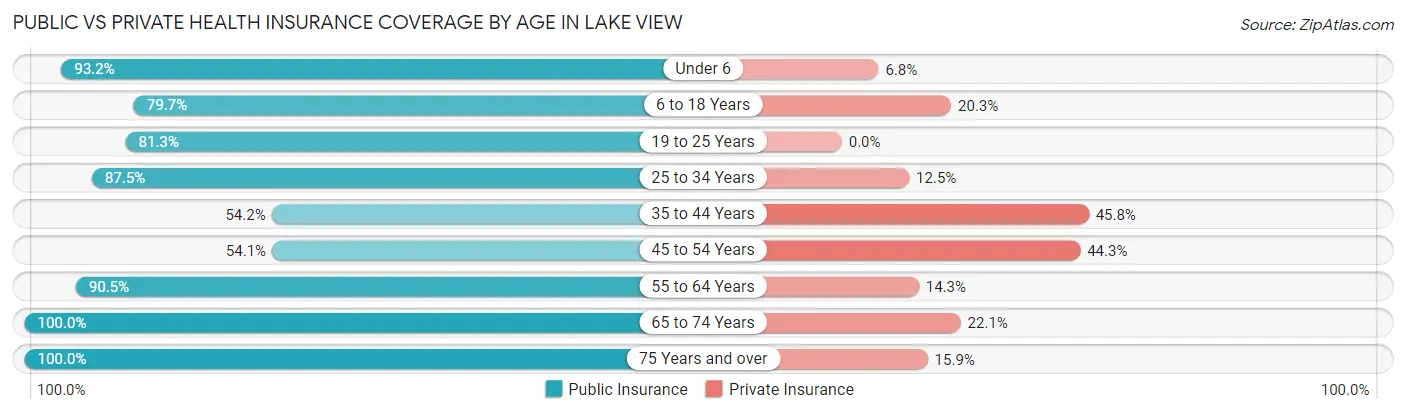
| Age Bracket | Public Insurance | Private Insurance |
| Under 6 | 41 (93.2%) | 3 (6.8%) |
| 6 to 18 Years | 55 (79.7%) | 14 (20.3%) |
| 19 to 25 Years | 26 (81.2%) | 0 (0.0%) |
| 25 to 34 Years | 21 (87.5%) | 3 (12.5%) |
| 35 to 44 Years | 13 (54.2%) | 11 (45.8%) |
| 45 to 54 Years | 33 (54.1%) | 27 (44.3%) |
| 55 to 64 Years | 57 (90.5%) | 9 (14.3%) |
| 65 to 74 Years | 68 (100.0%) | 15 (22.1%) |
| 75 Years and over | 69 (100.0%) | 11 (15.9%) |
| Total | 383 (84.4%) | 93 (20.5%) |
Disability Status by Sex by Age in Lake View
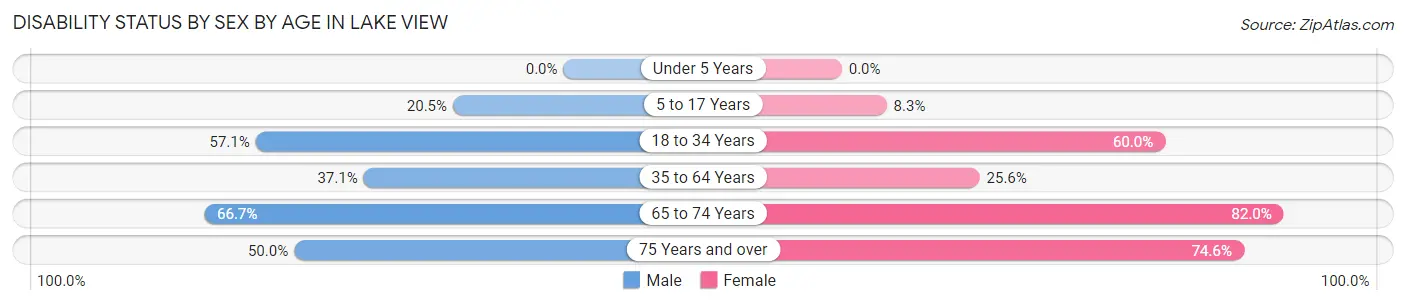
| Age Bracket | Male | Female |
| Under 5 Years | 0 (0.0%) | 0 (0.0%) |
| 5 to 17 Years | 8 (20.5%) | 2 (8.3%) |
| 18 to 34 Years | 12 (57.1%) | 30 (60.0%) |
| 35 to 64 Years | 23 (37.1%) | 22 (25.6%) |
| 65 to 74 Years | 12 (66.7%) | 41 (82.0%) |
| 75 Years and over | 3 (50.0%) | 47 (74.6%) |
Disability Class by Sex by Age in Lake View
Disability Class: Hearing Difficulty
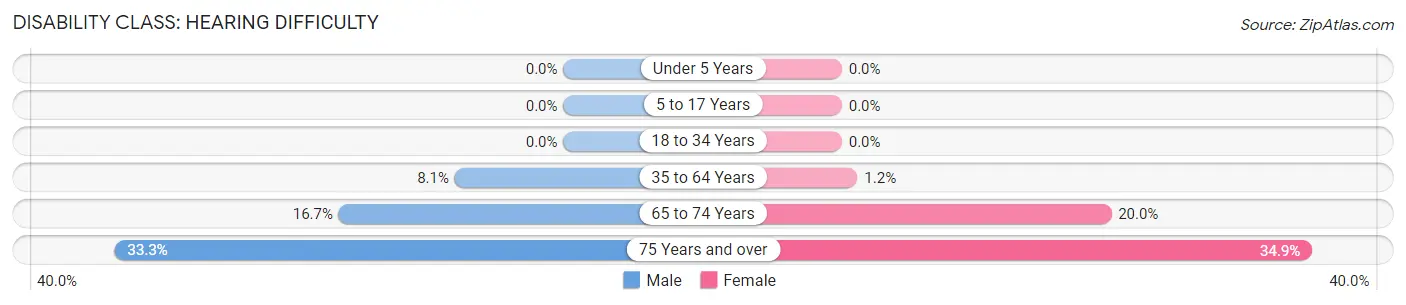
| Age Bracket | Male | Female |
| Under 5 Years | 0 (0.0%) | 0 (0.0%) |
| 5 to 17 Years | 0 (0.0%) | 0 (0.0%) |
| 18 to 34 Years | 0 (0.0%) | 0 (0.0%) |
| 35 to 64 Years | 5 (8.1%) | 1 (1.2%) |
| 65 to 74 Years | 3 (16.7%) | 10 (20.0%) |
| 75 Years and over | 2 (33.3%) | 22 (34.9%) |
Disability Class: Vision Difficulty
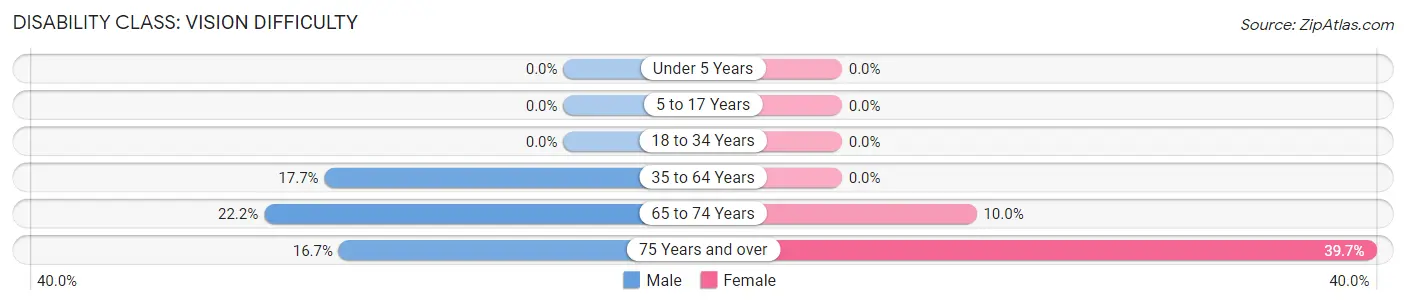
| Age Bracket | Male | Female |
| Under 5 Years | 0 (0.0%) | 0 (0.0%) |
| 5 to 17 Years | 0 (0.0%) | 0 (0.0%) |
| 18 to 34 Years | 0 (0.0%) | 0 (0.0%) |
| 35 to 64 Years | 11 (17.7%) | 0 (0.0%) |
| 65 to 74 Years | 4 (22.2%) | 5 (10.0%) |
| 75 Years and over | 1 (16.7%) | 25 (39.7%) |
Disability Class: Cognitive Difficulty
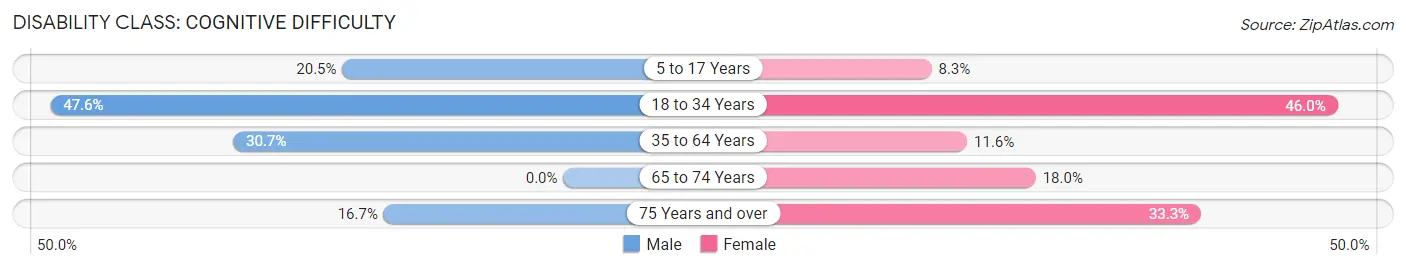
| Age Bracket | Male | Female |
| 5 to 17 Years | 8 (20.5%) | 2 (8.3%) |
| 18 to 34 Years | 10 (47.6%) | 23 (46.0%) |
| 35 to 64 Years | 19 (30.6%) | 10 (11.6%) |
| 65 to 74 Years | 0 (0.0%) | 9 (18.0%) |
| 75 Years and over | 1 (16.7%) | 21 (33.3%) |
Disability Class: Ambulatory Difficulty
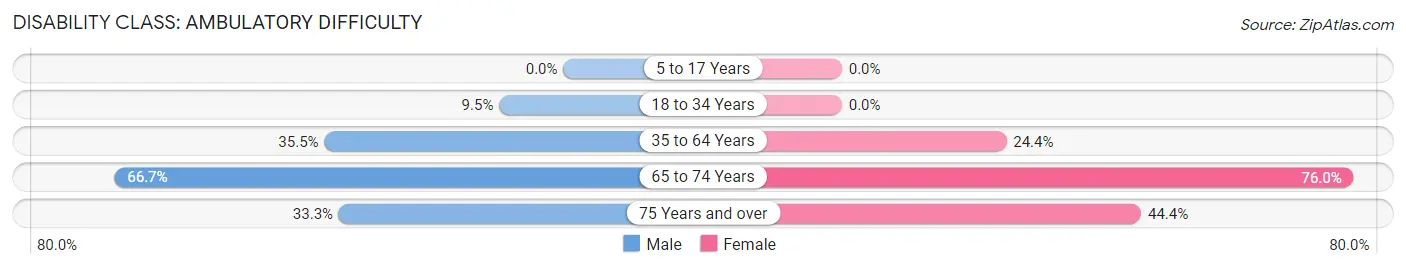
| Age Bracket | Male | Female |
| 5 to 17 Years | 0 (0.0%) | 0 (0.0%) |
| 18 to 34 Years | 2 (9.5%) | 0 (0.0%) |
| 35 to 64 Years | 22 (35.5%) | 21 (24.4%) |
| 65 to 74 Years | 12 (66.7%) | 38 (76.0%) |
| 75 Years and over | 2 (33.3%) | 28 (44.4%) |
Disability Class: Self-Care Difficulty
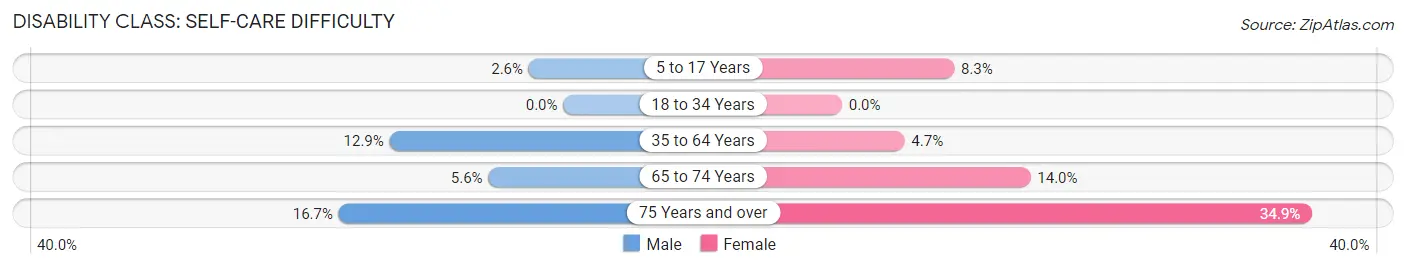
| Age Bracket | Male | Female |
| 5 to 17 Years | 1 (2.6%) | 2 (8.3%) |
| 18 to 34 Years | 0 (0.0%) | 0 (0.0%) |
| 35 to 64 Years | 8 (12.9%) | 4 (4.6%) |
| 65 to 74 Years | 1 (5.6%) | 7 (14.0%) |
| 75 Years and over | 1 (16.7%) | 22 (34.9%) |
Technology Access in Lake View
Computing Device Access in Lake View
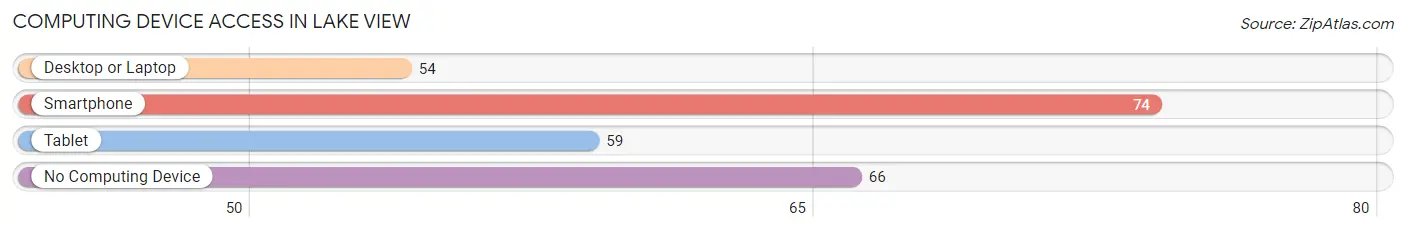
| Device Type | # Households | % Households |
| Desktop or Laptop | 54 | 31.8% |
| Smartphone | 74 | 43.5% |
| Tablet | 59 | 34.7% |
| No Computing Device | 66 | 38.8% |
| Total | 170 | 100.0% |
Internet Access in Lake View
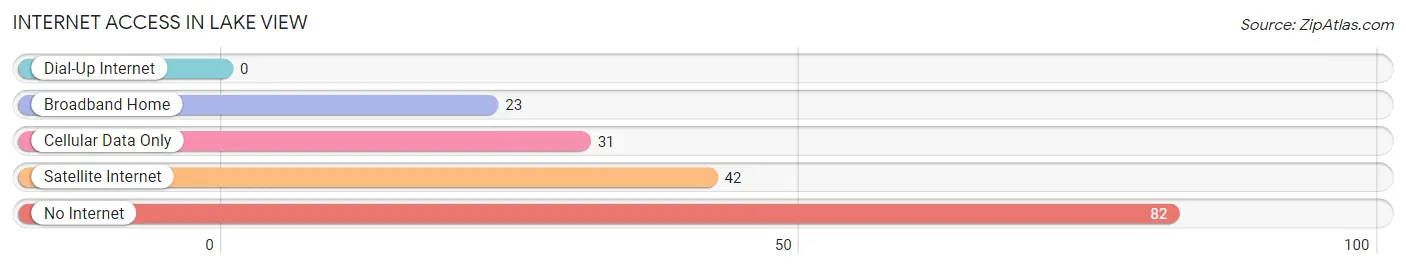
| Internet Type | # Households | % Households |
| Dial-Up Internet | 0 | 0.0% |
| Broadband Home | 23 | 13.5% |
| Cellular Data Only | 31 | 18.2% |
| Satellite Internet | 42 | 24.7% |
| No Internet | 82 | 48.2% |
| Total | 170 | 100.0% |
Lake View Summary
View, Arkansas is a small town located in the Ozark Mountains of northwest Arkansas. It is situated in the foothills of the Ozarks, about 20 miles south of Fayetteville and about 30 miles north of Fort Smith. The town is located in the Ozark National Forest and is surrounded by the Ozark Mountains.
View, Arkansas has a population of approximately 1,000 people. The town is predominantly white, with a small African American population. The median household income is $35,000, and the median age is 40. The town is home to a variety of businesses, including a grocery store, a hardware store, a gas station, and a few restaurants.
View, Arkansas is located in the Ozark Mountains, which are known for their rugged terrain and beautiful scenery. The town is surrounded by rolling hills, forests, and streams. The area is known for its outdoor activities, such as hiking, camping, fishing, and hunting. The town is also home to several state parks, including the Ozark National Forest and the Buffalo National River.
The economy of View, Arkansas is largely based on agriculture and tourism. The town is home to several farms, which produce a variety of crops, including corn, soybeans, wheat, and hay. The town is also home to several tourist attractions, such as the Ozark National Forest, the Buffalo National River, and the Ozark Folk Center.
View, Arkansas is served by the Fayetteville Public Schools, which includes two elementary schools, one middle school, and one high school. The town is also home to a community college, the University of Arkansas Community College at View.
View, Arkansas is a small town with a rich history. The town was founded in 1836 by settlers from Tennessee and Kentucky. The town was originally known as Viewville, but the name was changed to View in 1845. The town was an important stop on the Butterfield Overland Mail route, which ran from St. Louis to San Francisco. The town was also an important stop on the Arkansas and Missouri Railroad, which ran from St. Louis to Little Rock.
View, Arkansas is a small town with a rich history and a vibrant economy. The town is home to a variety of businesses, including a grocery store, a hardware store, a gas station, and a few restaurants. The town is also home to several tourist attractions, such as the Ozark National Forest, the Buffalo National River, and the Ozark Folk Center. The town is served by the Fayetteville Public Schools, which includes two elementary schools, one middle school, and one high school. The town is also home to a community college, the University of Arkansas Community College at View.
Common Questions
What is Per Capita Income in Lake View?
Per Capita income in Lake View is $16,610.
What is the Median Family Income in Lake View?
Median Family Income in Lake View is $44,318.
What is the Median Household income in Lake View?
Median Household Income in Lake View is $28,750.
What is Inequality or Gini Index in Lake View?
Inequality or Gini Index in Lake View is 0.40.
What is the Total Population of Lake View?
Total Population of Lake View is 454.
What is the Total Male Population of Lake View?
Total Male Population of Lake View is 179.
What is the Total Female Population of Lake View?
Total Female Population of Lake View is 275.
What is the Ratio of Males per 100 Females in Lake View?
There are 65.09 Males per 100 Females in Lake View.
What is the Ratio of Females per 100 Males in Lake View?
There are 153.63 Females per 100 Males in Lake View.
What is the Median Population Age in Lake View?
Median Population Age in Lake View is 52.3 Years.
What is the Average Family Size in Lake View
Average Family Size in Lake View is 3.8 People.
What is the Average Household Size in Lake View
Average Household Size in Lake View is 2.7 People.
How Large is the Labor Force in Lake View?
There are 126 People in the Labor Forcein in Lake View.
What is the Percentage of People in the Labor Force in Lake View?
34.1% of People are in the Labor Force in Lake View.
What is the Unemployment Rate in Lake View?
Unemployment Rate in Lake View is 25.4%.