Nashville, AR Map & Demographics
Nashville Map
Nashville Overview
$21,543
PER CAPITA INCOME
$49,455
AVG FAMILY INCOME
$39,836
AVG HOUSEHOLD INCOME
14.4%
WAGE / INCOME GAP [ % ]
85.6¢/ $1
WAGE / INCOME GAP [ $ ]
0.39
INEQUALITY / GINI INDEX
4,156
TOTAL POPULATION
1,960
MALE POPULATION
2,196
FEMALE POPULATION
89.25
MALES / 100 FEMALES
112.04
FEMALES / 100 MALES
39.1
MEDIAN AGE
3.0
AVG FAMILY SIZE
2.4
AVG HOUSEHOLD SIZE
2,031
LABOR FORCE [ PEOPLE ]
60.9%
PERCENT IN LABOR FORCE
10.0%
UNEMPLOYMENT RATE
Nashville Zip Codes
Nashville Area Codes
Income in Nashville
Income Overview in Nashville
Per Capita Income in Nashville is $21,543, while median incomes of families and households are $49,455 and $39,836 respectively.
| Characteristic | Number | Measure |
| Per Capita Income | 4,156 | $21,543 |
| Median Family Income | 1,105 | $49,455 |
| Mean Family Income | 1,105 | $62,154 |
| Median Household Income | 1,716 | $39,836 |
| Mean Household Income | 1,716 | $52,579 |
| Income Deficit | 1,105 | $0 |
| Wage / Income Gap (%) | 4,156 | 14.42% |
| Wage / Income Gap ($) | 4,156 | 85.58¢ per $1 |
| Gini / Inequality Index | 4,156 | 0.39 |
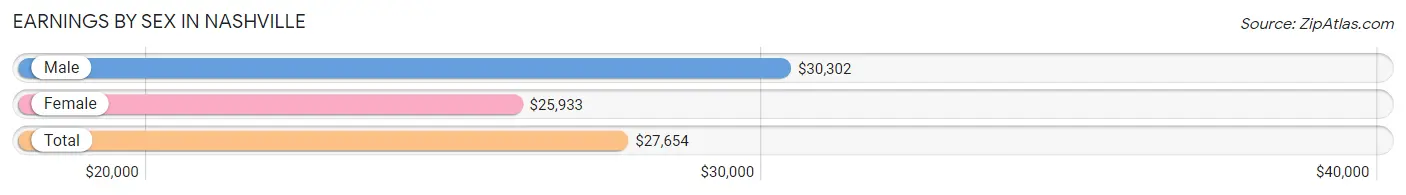
Earnings by Sex in Nashville
Average Earnings in Nashville are $27,654, $30,302 for men and $25,933 for women, a difference of 14.4%.
| Sex | Number | Average Earnings |
| Male | 1,007 (49.8%) | $30,302 |
| Female | 1,016 (50.2%) | $25,933 |
| Total | 2,023 (100.0%) | $27,654 |
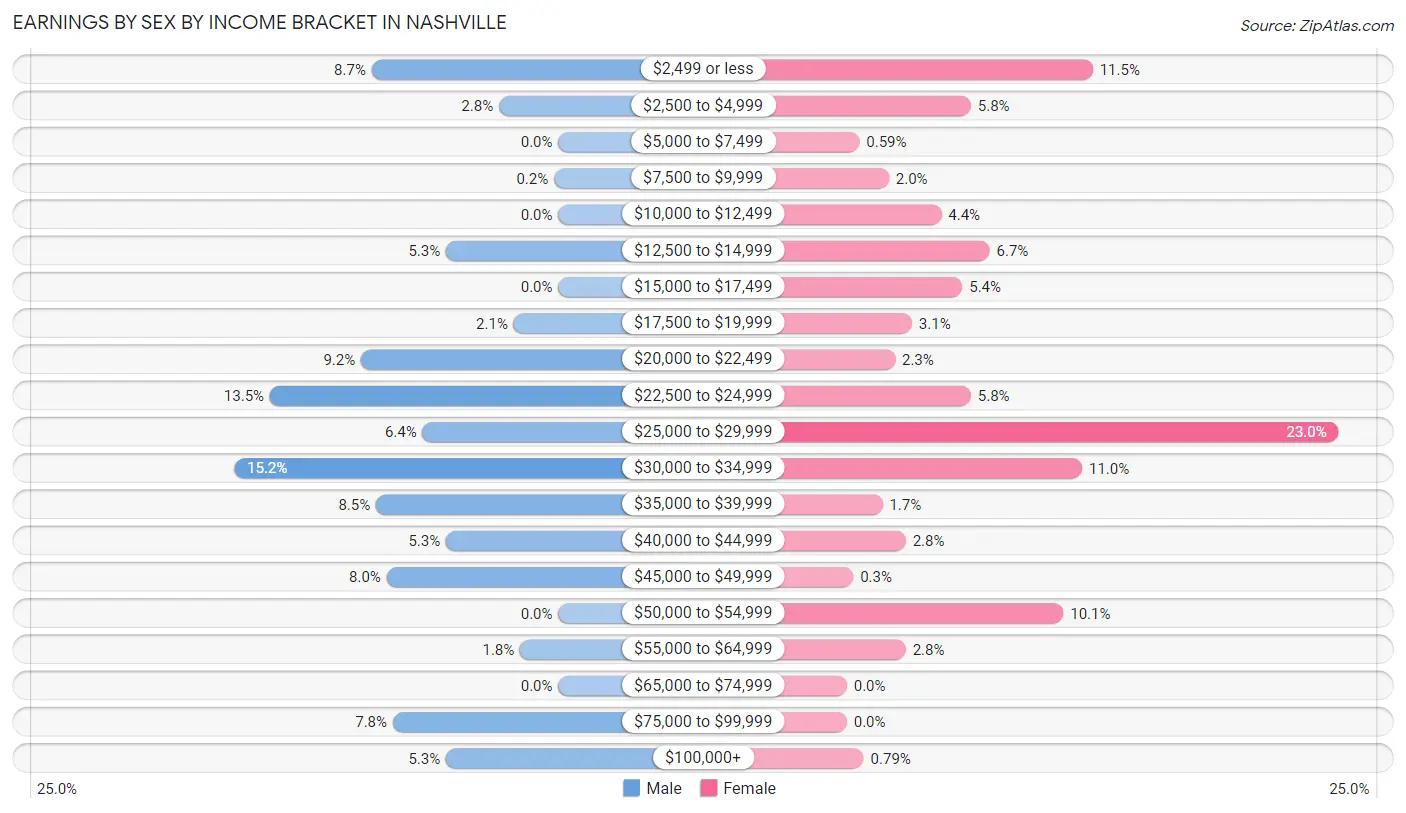
Earnings by Sex by Income Bracket in Nashville
The most common earnings brackets in Nashville are $30,000 to $34,999 for men (153 | 15.2%) and $25,000 to $29,999 for women (234 | 23.0%).
| Income | Male | Female |
| $2,499 or less | 88 (8.7%) | 117 (11.5%) |
| $2,500 to $4,999 | 28 (2.8%) | 59 (5.8%) |
| $5,000 to $7,499 | 0 (0.0%) | 6 (0.6%) |
| $7,500 to $9,999 | 2 (0.2%) | 20 (2.0%) |
| $10,000 to $12,499 | 0 (0.0%) | 45 (4.4%) |
| $12,500 to $14,999 | 53 (5.3%) | 68 (6.7%) |
| $15,000 to $17,499 | 0 (0.0%) | 55 (5.4%) |
| $17,500 to $19,999 | 21 (2.1%) | 31 (3.0%) |
| $20,000 to $22,499 | 93 (9.2%) | 23 (2.3%) |
| $22,500 to $24,999 | 136 (13.5%) | 59 (5.8%) |
| $25,000 to $29,999 | 64 (6.4%) | 234 (23.0%) |
| $30,000 to $34,999 | 153 (15.2%) | 112 (11.0%) |
| $35,000 to $39,999 | 86 (8.5%) | 17 (1.7%) |
| $40,000 to $44,999 | 53 (5.3%) | 28 (2.8%) |
| $45,000 to $49,999 | 81 (8.0%) | 3 (0.3%) |
| $50,000 to $54,999 | 0 (0.0%) | 103 (10.1%) |
| $55,000 to $64,999 | 18 (1.8%) | 28 (2.8%) |
| $65,000 to $74,999 | 0 (0.0%) | 0 (0.0%) |
| $75,000 to $99,999 | 78 (7.7%) | 0 (0.0%) |
| $100,000+ | 53 (5.3%) | 8 (0.8%) |
| Total | 1,007 (100.0%) | 1,016 (100.0%) |
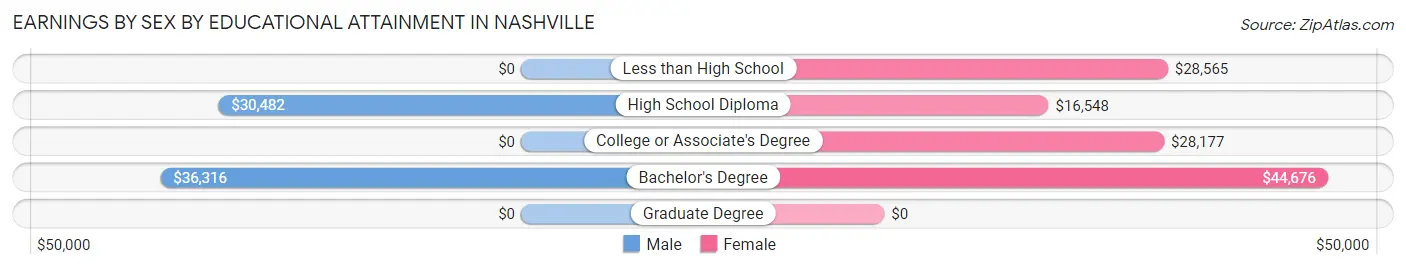
Earnings by Sex by Educational Attainment in Nashville
Average earnings in Nashville are $30,940 for men and $27,562 for women, a difference of 10.9%. Men with an educational attainment of bachelor's degree enjoy the highest average annual earnings of $36,316, while those with high school diploma education earn the least with $30,482. Women with an educational attainment of bachelor's degree earn the most with the average annual earnings of $44,676, while those with high school diploma education have the smallest earnings of $16,548.
| Educational Attainment | Male Income | Female Income |
| Less than High School | - | - |
| High School Diploma | $30,482 | $16,548 |
| College or Associate's Degree | - | - |
| Bachelor's Degree | $36,316 | $44,676 |
| Graduate Degree | - | - |
| Total | $30,940 | $27,562 |
Family Income in Nashville
Family Income Brackets in Nashville
According to the Nashville family income data, there are 248 families falling into the $50,000 to $74,999 income range, which is the most common income bracket and makes up 22.4% of all families. Conversely, the less than $10,000 income bracket is the least frequent group with only 27 families (2.4%) belonging to this category.
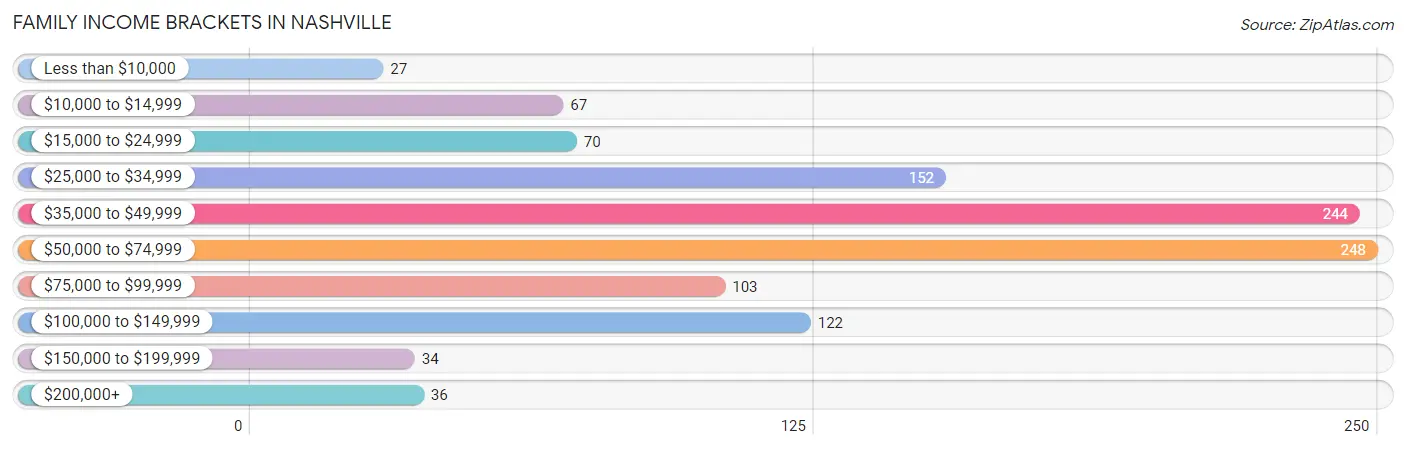
| Income Bracket | # Families | % Families |
| Less than $10,000 | 27 | 2.4% |
| $10,000 to $14,999 | 67 | 6.1% |
| $15,000 to $24,999 | 70 | 6.3% |
| $25,000 to $34,999 | 152 | 13.8% |
| $35,000 to $49,999 | 244 | 22.1% |
| $50,000 to $74,999 | 248 | 22.4% |
| $75,000 to $99,999 | 103 | 9.3% |
| $100,000 to $149,999 | 122 | 11.0% |
| $150,000 to $199,999 | 34 | 3.1% |
| $200,000+ | 36 | 3.3% |
Family Income by Famaliy Size in Nashville
4-person families (125 | 11.3%) account for the highest median family income in Nashville with $75,327 per family, while 2-person families (432 | 39.1%) have the highest median income of $24,231 per family member.
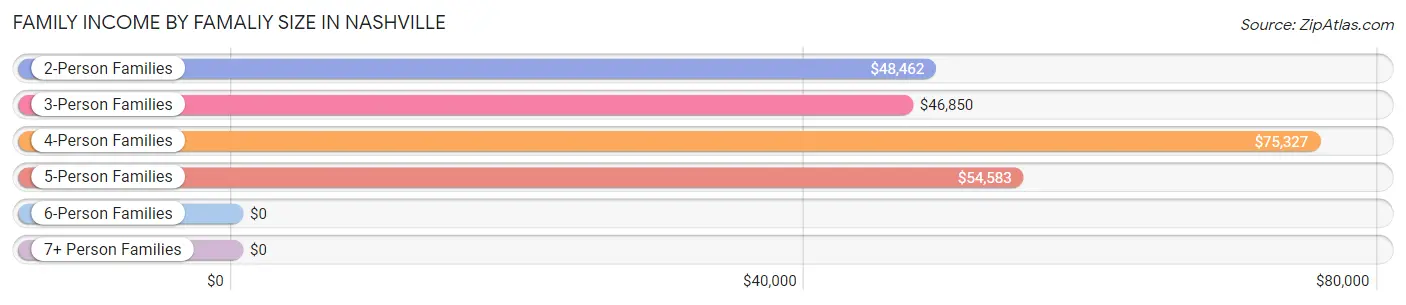
| Income Bracket | # Families | Median Income |
| 2-Person Families | 432 (39.1%) | $48,462 |
| 3-Person Families | 366 (33.1%) | $46,850 |
| 4-Person Families | 125 (11.3%) | $75,327 |
| 5-Person Families | 96 (8.7%) | $54,583 |
| 6-Person Families | 12 (1.1%) | $0 |
| 7+ Person Families | 74 (6.7%) | $0 |
| Total | 1,105 (100.0%) | $49,455 |
Family Income by Number of Earners in Nashville
The median family income in Nashville is $49,455, with families comprising 3+ earners (212) having the highest median family income of $75,179, while families with 1 earner (435) have the lowest median family income of $35,528, accounting for 19.2% and 39.4% of families, respectively.
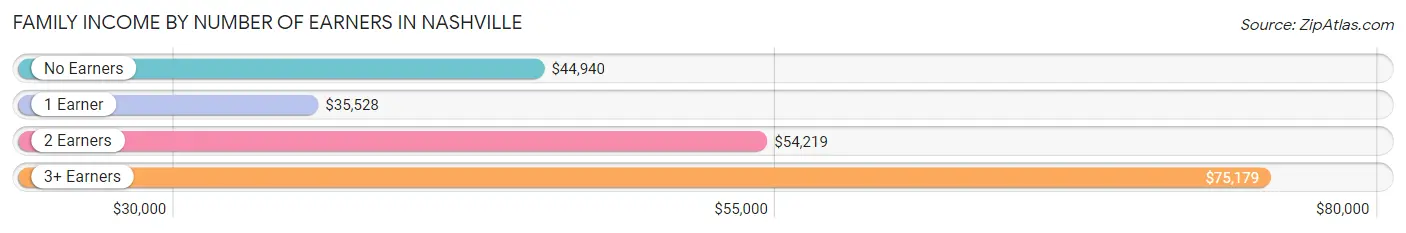
| Number of Earners | # Families | Median Income |
| No Earners | 181 (16.4%) | $44,940 |
| 1 Earner | 435 (39.4%) | $35,528 |
| 2 Earners | 277 (25.1%) | $54,219 |
| 3+ Earners | 212 (19.2%) | $75,179 |
| Total | 1,105 (100.0%) | $49,455 |
Household Income in Nashville
Household Income Brackets in Nashville
With 383 households falling in the category, the $50,000 to $74,999 income range is the most frequent in Nashville, accounting for 22.3% of all households. In contrast, only 34 households (2.0%) fall into the $150,000 to $199,999 income bracket, making it the least populous group.
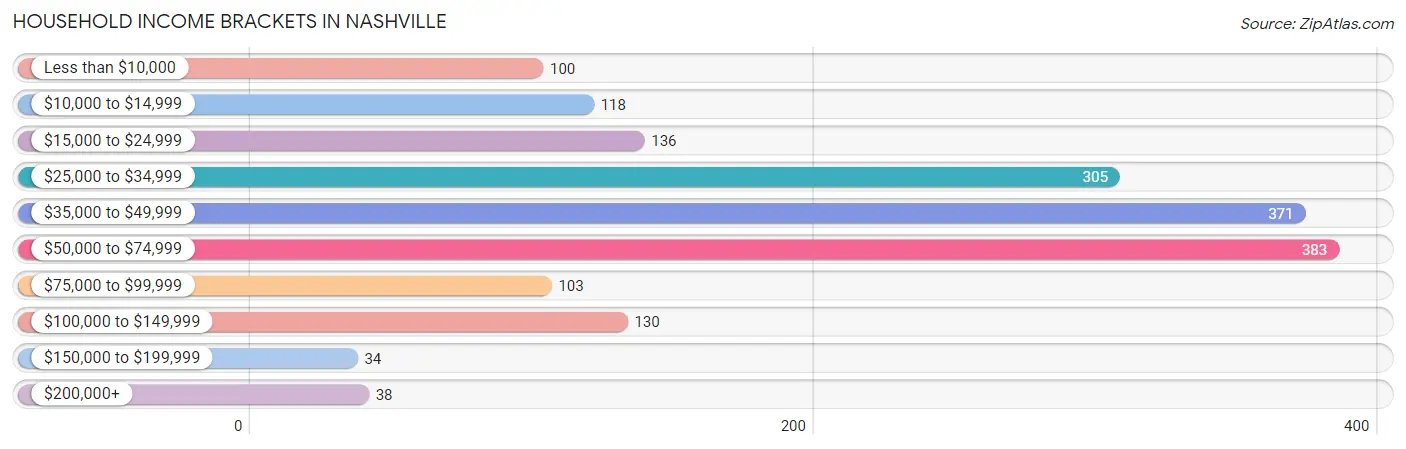
| Income Bracket | # Households | % Households |
| Less than $10,000 | 100 | 5.8% |
| $10,000 to $14,999 | 118 | 6.9% |
| $15,000 to $24,999 | 136 | 7.9% |
| $25,000 to $34,999 | 305 | 17.8% |
| $35,000 to $49,999 | 371 | 21.6% |
| $50,000 to $74,999 | 383 | 22.3% |
| $75,000 to $99,999 | 103 | 6.0% |
| $100,000 to $149,999 | 130 | 7.6% |
| $150,000 to $199,999 | 34 | 2.0% |
| $200,000+ | 38 | 2.2% |
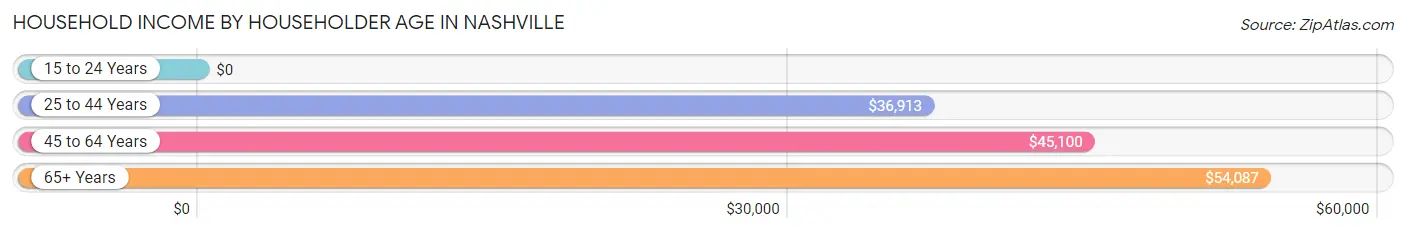
Household Income by Householder Age in Nashville
The median household income in Nashville is $39,836, with the highest median household income of $54,087 found in the 65+ years age bracket for the primary householder. A total of 507 households (29.5%) fall into this category. Meanwhile, the 15 to 24 years age bracket for the primary householder has the lowest median household income of $0, with 16 households (0.9%) in this group.
| Income Bracket | # Households | Median Income |
| 15 to 24 Years | 16 (0.9%) | $0 |
| 25 to 44 Years | 603 (35.1%) | $36,913 |
| 45 to 64 Years | 590 (34.4%) | $45,100 |
| 65+ Years | 507 (29.5%) | $54,087 |
| Total | 1,716 (100.0%) | $39,836 |
Poverty in Nashville
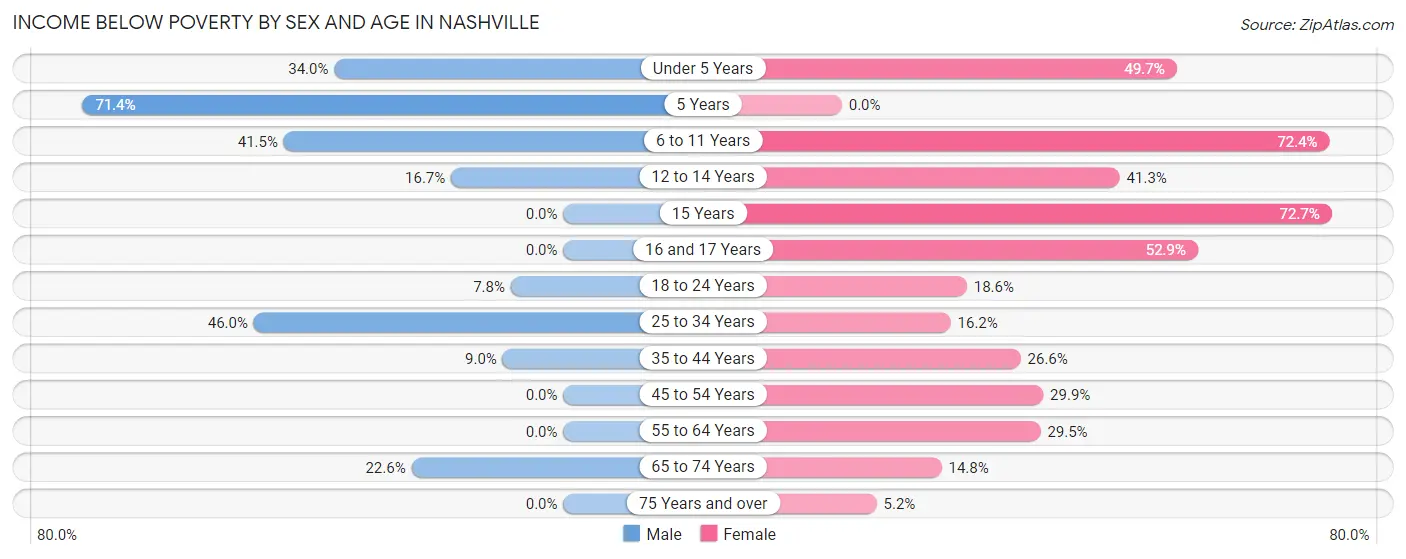
Income Below Poverty by Sex and Age in Nashville
With 17.0% poverty level for males and 28.3% for females among the residents of Nashville, 5 year old males and 15 year old females are the most vulnerable to poverty, with 25 males (71.4%) and 16 females (72.7%) in their respective age groups living below the poverty level.
| Age Bracket | Male | Female |
| Under 5 Years | 67 (34.0%) | 84 (49.7%) |
| 5 Years | 25 (71.4%) | 0 (0.0%) |
| 6 to 11 Years | 44 (41.5%) | 63 (72.4%) |
| 12 to 14 Years | 7 (16.7%) | 59 (41.3%) |
| 15 Years | 0 (0.0%) | 16 (72.7%) |
| 16 and 17 Years | 0 (0.0%) | 37 (52.9%) |
| 18 to 24 Years | 15 (7.8%) | 36 (18.6%) |
| 25 to 34 Years | 91 (46.0%) | 37 (16.2%) |
| 35 to 44 Years | 32 (9.0%) | 94 (26.6%) |
| 45 to 54 Years | 0 (0.0%) | 61 (29.9%) |
| 55 to 64 Years | 0 (0.0%) | 77 (29.5%) |
| 65 to 74 Years | 46 (22.6%) | 36 (14.8%) |
| 75 Years and over | 0 (0.0%) | 9 (5.2%) |
| Total | 327 (17.0%) | 609 (28.3%) |
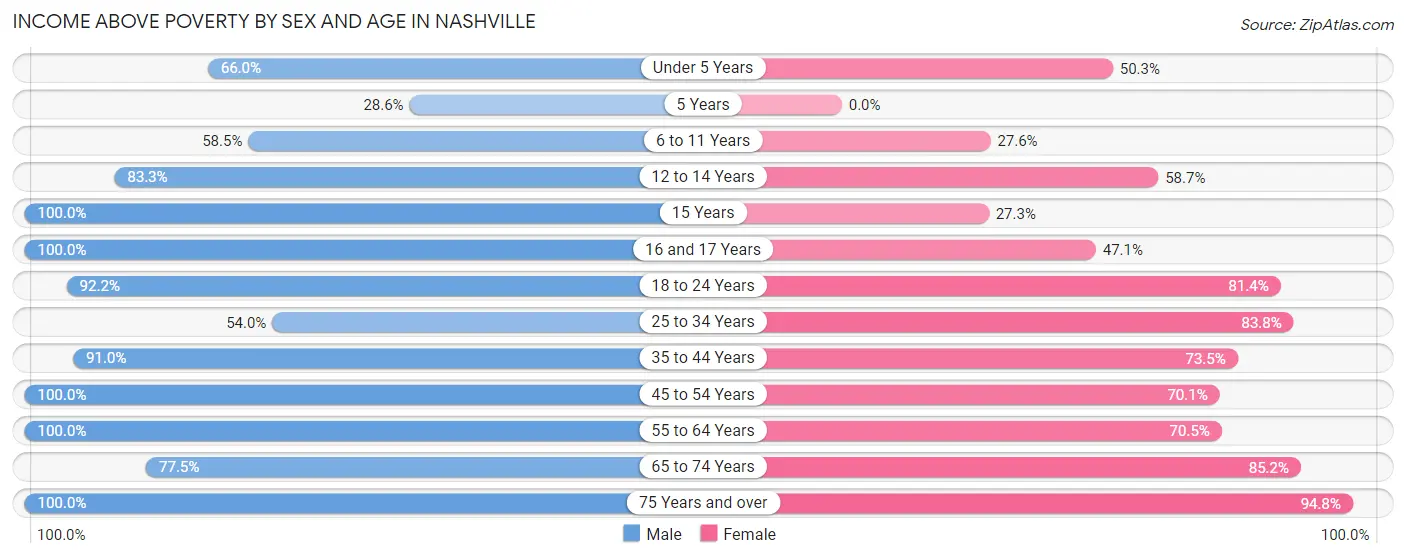
Income Above Poverty by Sex and Age in Nashville
According to the poverty statistics in Nashville, males aged 15 years and females aged 75 years and over are the age groups that are most secure financially, with 100.0% of males and 94.8% of females in these age groups living above the poverty line.
| Age Bracket | Male | Female |
| Under 5 Years | 130 (66.0%) | 85 (50.3%) |
| 5 Years | 10 (28.6%) | 0 (0.0%) |
| 6 to 11 Years | 62 (58.5%) | 24 (27.6%) |
| 12 to 14 Years | 35 (83.3%) | 84 (58.7%) |
| 15 Years | 6 (100.0%) | 6 (27.3%) |
| 16 and 17 Years | 67 (100.0%) | 33 (47.1%) |
| 18 to 24 Years | 177 (92.2%) | 158 (81.4%) |
| 25 to 34 Years | 107 (54.0%) | 192 (83.8%) |
| 35 to 44 Years | 323 (91.0%) | 260 (73.5%) |
| 45 to 54 Years | 101 (100.0%) | 143 (70.1%) |
| 55 to 64 Years | 306 (100.0%) | 184 (70.5%) |
| 65 to 74 Years | 158 (77.4%) | 207 (85.2%) |
| 75 Years and over | 115 (100.0%) | 165 (94.8%) |
| Total | 1,597 (83.0%) | 1,541 (71.7%) |
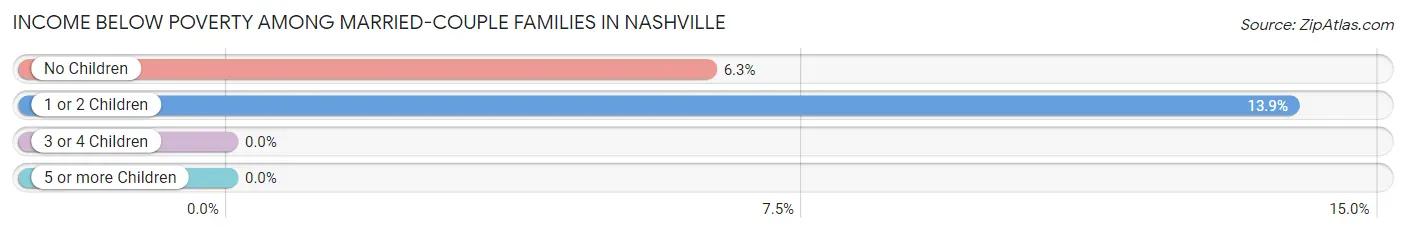
Income Below Poverty Among Married-Couple Families in Nashville
The poverty statistics for married-couple families in Nashville show that 7.9% or 53 of the total 669 families live below the poverty line. Families with 1 or 2 children have the highest poverty rate of 13.9%, comprising of 28 families. On the other hand, families with 3 or 4 children have the lowest poverty rate of 0.0%, which includes 0 families.
| Children | Above Poverty | Below Poverty |
| No Children | 375 (93.8%) | 25 (6.2%) |
| 1 or 2 Children | 174 (86.1%) | 28 (13.9%) |
| 3 or 4 Children | 67 (100.0%) | 0 (0.0%) |
| 5 or more Children | 0 (0.0%) | 0 (0.0%) |
| Total | 616 (92.1%) | 53 (7.9%) |
Income Below Poverty Among Single-Parent Households in Nashville
According to the poverty data in Nashville, 24.8% or 39 single-father households and 43.7% or 122 single-mother households are living below the poverty line. Among single-father households, those with 3 or 4 children have the highest poverty rate, with 7 households (100.0%) experiencing poverty. Likewise, among single-mother households, those with 5 or more children have the highest poverty rate, with 56 households (100.0%) falling below the poverty line.
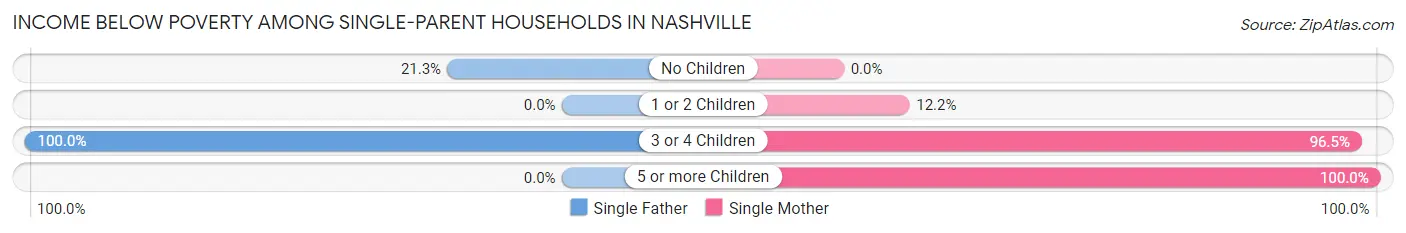
| Children | Single Father | Single Mother |
| No Children | 32 (21.3%) | 0 (0.0%) |
| 1 or 2 Children | 0 (0.0%) | 11 (12.2%) |
| 3 or 4 Children | 7 (100.0%) | 55 (96.5%) |
| 5 or more Children | 0 (0.0%) | 56 (100.0%) |
| Total | 39 (24.8%) | 122 (43.7%) |
Income Below Poverty Among Married-Couple vs Single-Parent Households in Nashville
The poverty data for Nashville shows that 53 of the married-couple family households (7.9%) and 161 of the single-parent households (36.9%) are living below the poverty level. Within the married-couple family households, those with 1 or 2 children have the highest poverty rate, with 28 households (13.9%) falling below the poverty line. Among the single-parent households, those with 5 or more children have the highest poverty rate, with 56 household (100.0%) living below poverty.
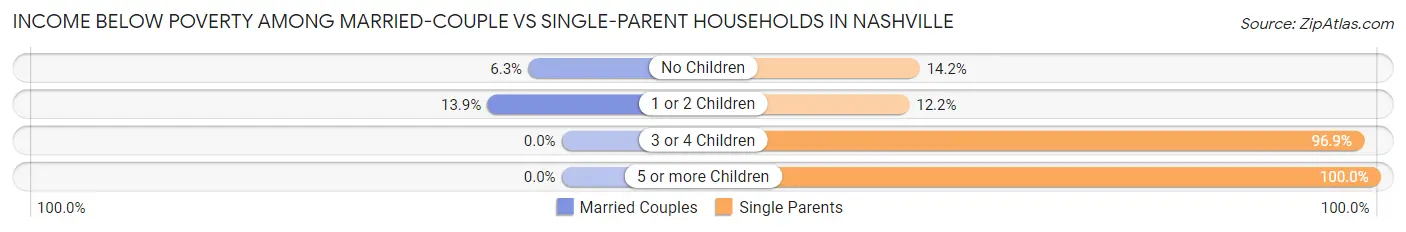
| Children | Married-Couple Families | Single-Parent Households |
| No Children | 25 (6.2%) | 32 (14.2%) |
| 1 or 2 Children | 28 (13.9%) | 11 (12.2%) |
| 3 or 4 Children | 0 (0.0%) | 62 (96.9%) |
| 5 or more Children | 0 (0.0%) | 56 (100.0%) |
| Total | 53 (7.9%) | 161 (36.9%) |
Race in Nashville
The most populous races in Nashville are White / Caucasian (1,824 | 43.9%), Black / African American (1,415 | 34.1%), and Hispanic or Latino (891 | 21.4%).
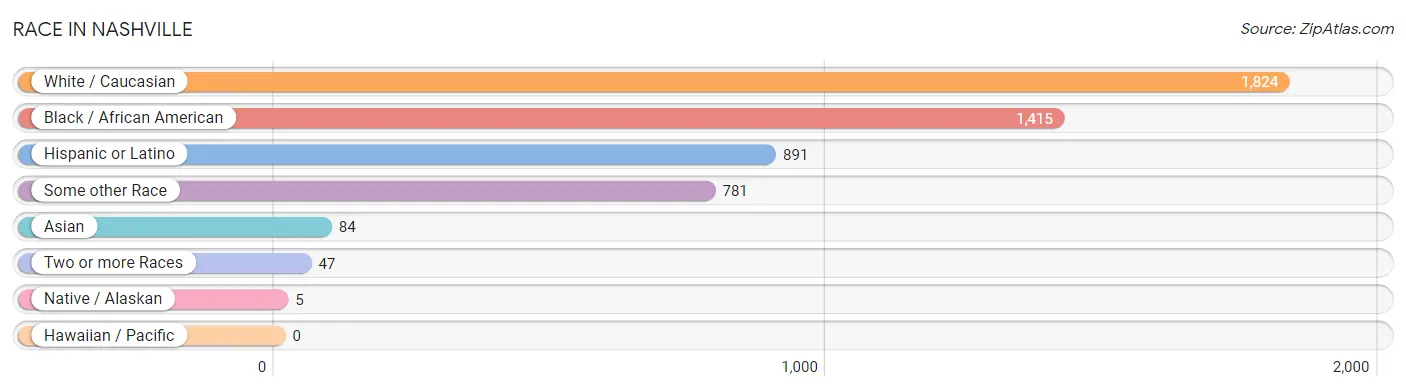
| Race | # Population | % Population |
| Asian | 84 | 2.0% |
| Black / African American | 1,415 | 34.1% |
| Hawaiian / Pacific | 0 | 0.0% |
| Hispanic or Latino | 891 | 21.4% |
| Native / Alaskan | 5 | 0.1% |
| White / Caucasian | 1,824 | 43.9% |
| Two or more Races | 47 | 1.1% |
| Some other Race | 781 | 18.8% |
| Total | 4,156 | 100.0% |
Ancestry in Nashville
The most populous ancestries reported in Nashville are Mexican (785 | 18.9%), German (345 | 8.3%), English (327 | 7.9%), Irish (197 | 4.7%), and American (166 | 4.0%), together accounting for 43.8% of all Nashville residents.
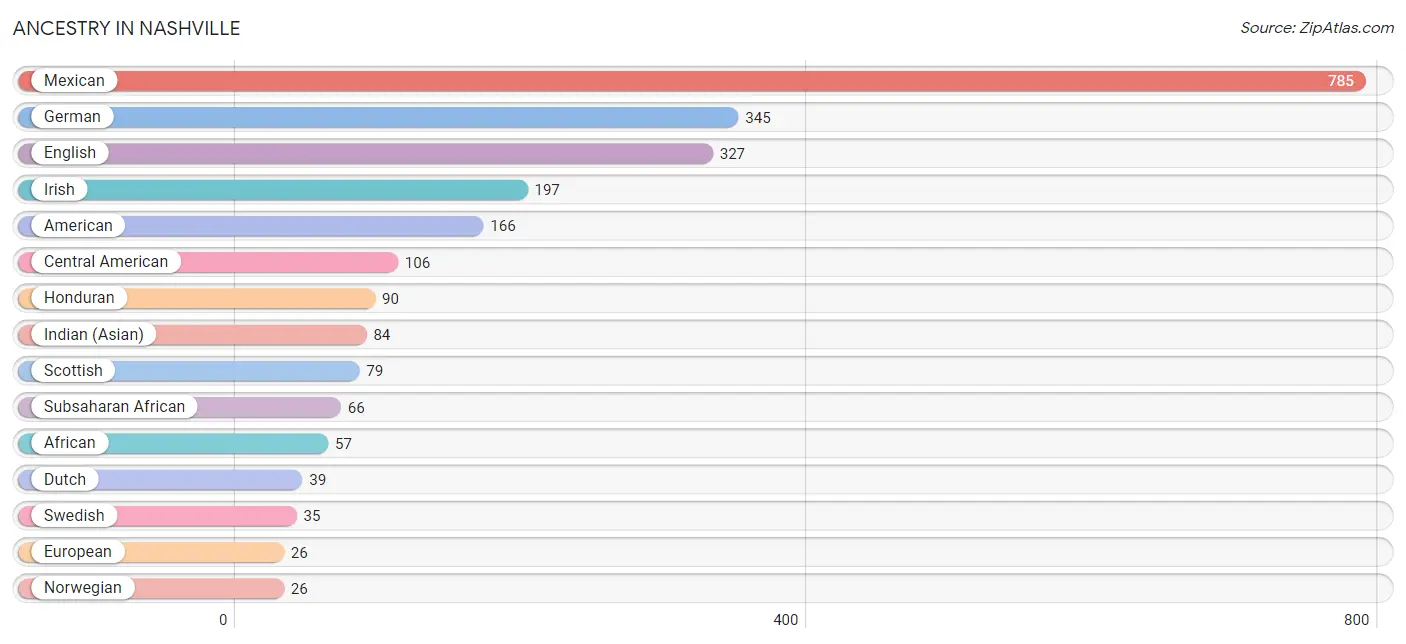
| Ancestry | # Population | % Population |
| African | 57 | 1.4% |
| American | 166 | 4.0% |
| British | 8 | 0.2% |
| Central American | 106 | 2.5% |
| Creek | 5 | 0.1% |
| Czech | 8 | 0.2% |
| Dutch | 39 | 0.9% |
| English | 327 | 7.9% |
| European | 26 | 0.6% |
| French Canadian | 1 | 0.0% |
| German | 345 | 8.3% |
| Honduran | 90 | 2.2% |
| Indian (Asian) | 84 | 2.0% |
| Irish | 197 | 4.7% |
| Italian | 22 | 0.5% |
| Mexican | 785 | 18.9% |
| Nigerian | 9 | 0.2% |
| Norwegian | 26 | 0.6% |
| Polish | 12 | 0.3% |
| Salvadoran | 16 | 0.4% |
| Scandinavian | 5 | 0.1% |
| Scotch-Irish | 12 | 0.3% |
| Scottish | 79 | 1.9% |
| Sierra Leonean | 9 | 0.2% |
| Subsaharan African | 66 | 1.6% |
| Swedish | 35 | 0.8% |
| Swiss | 16 | 0.4% |
| Ukrainian | 9 | 0.2% | View All 28 Rows |
Immigrants in Nashville
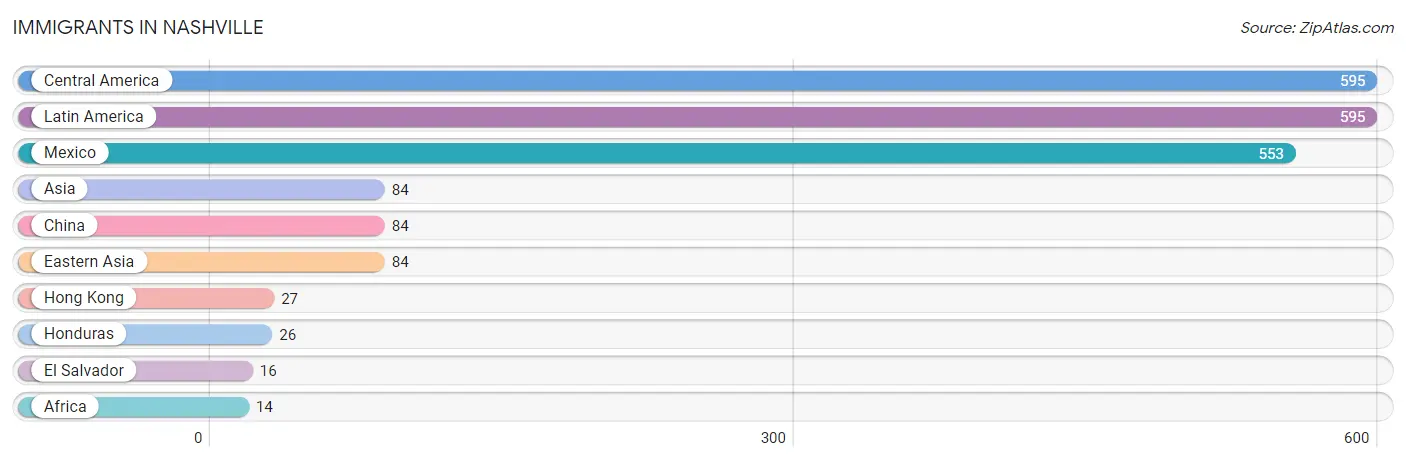
The most numerous immigrant groups reported in Nashville came from Central America (595 | 14.3%), Latin America (595 | 14.3%), Mexico (553 | 13.3%), Asia (84 | 2.0%), and China (84 | 2.0%), together accounting for 46.0% of all Nashville residents.
| Immigration Origin | # Population | % Population |
| Africa | 14 | 0.3% |
| Asia | 84 | 2.0% |
| Central America | 595 | 14.3% |
| China | 84 | 2.0% |
| Eastern Asia | 84 | 2.0% |
| El Salvador | 16 | 0.4% |
| Honduras | 26 | 0.6% |
| Hong Kong | 27 | 0.6% |
| Latin America | 595 | 14.3% |
| Mexico | 553 | 13.3% | View All 10 Rows |
Sex and Age in Nashville
Sex and Age in Nashville
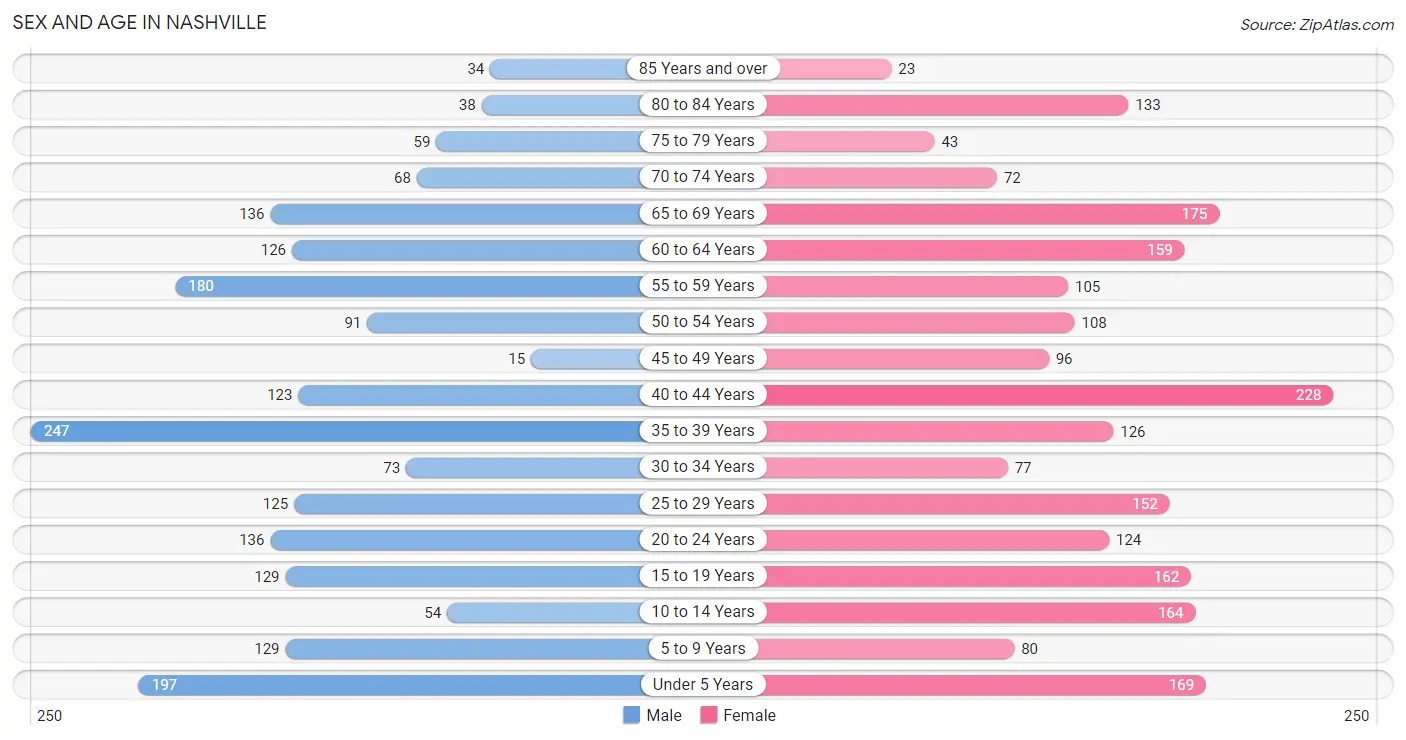
The most populous age groups in Nashville are 35 to 39 Years (247 | 12.6%) for men and 40 to 44 Years (228 | 10.4%) for women.
| Age Bracket | Male | Female |
| Under 5 Years | 197 (10.1%) | 169 (7.7%) |
| 5 to 9 Years | 129 (6.6%) | 80 (3.6%) |
| 10 to 14 Years | 54 (2.8%) | 164 (7.5%) |
| 15 to 19 Years | 129 (6.6%) | 162 (7.4%) |
| 20 to 24 Years | 136 (6.9%) | 124 (5.7%) |
| 25 to 29 Years | 125 (6.4%) | 152 (6.9%) |
| 30 to 34 Years | 73 (3.7%) | 77 (3.5%) |
| 35 to 39 Years | 247 (12.6%) | 126 (5.7%) |
| 40 to 44 Years | 123 (6.3%) | 228 (10.4%) |
| 45 to 49 Years | 15 (0.8%) | 96 (4.4%) |
| 50 to 54 Years | 91 (4.6%) | 108 (4.9%) |
| 55 to 59 Years | 180 (9.2%) | 105 (4.8%) |
| 60 to 64 Years | 126 (6.4%) | 159 (7.2%) |
| 65 to 69 Years | 136 (6.9%) | 175 (8.0%) |
| 70 to 74 Years | 68 (3.5%) | 72 (3.3%) |
| 75 to 79 Years | 59 (3.0%) | 43 (2.0%) |
| 80 to 84 Years | 38 (1.9%) | 133 (6.1%) |
| 85 Years and over | 34 (1.7%) | 23 (1.1%) |
| Total | 1,960 (100.0%) | 2,196 (100.0%) |
Families and Households in Nashville
Median Family Size in Nashville
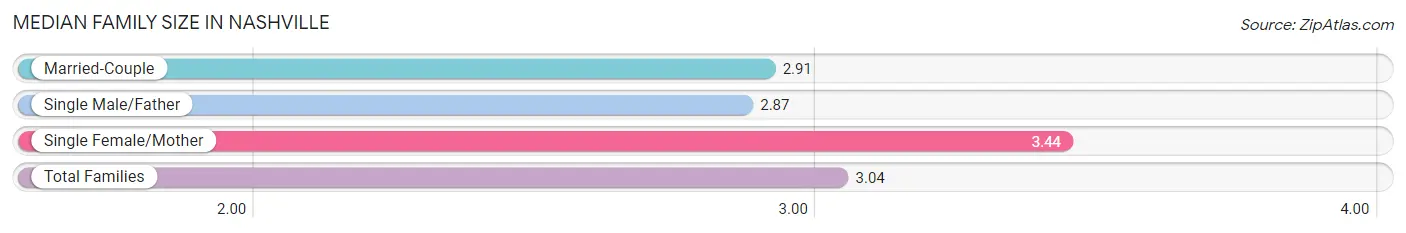
The median family size in Nashville is 3.04 persons per family, with single female/mother families (279 | 25.3%) accounting for the largest median family size of 3.44 persons per family. On the other hand, single male/father families (157 | 14.2%) represent the smallest median family size with 2.87 persons per family.
| Family Type | # Families | Family Size |
| Married-Couple | 669 (60.5%) | 2.91 |
| Single Male/Father | 157 (14.2%) | 2.87 |
| Single Female/Mother | 279 (25.3%) | 3.44 |
| Total Families | 1,105 (100.0%) | 3.04 |
Median Household Size in Nashville
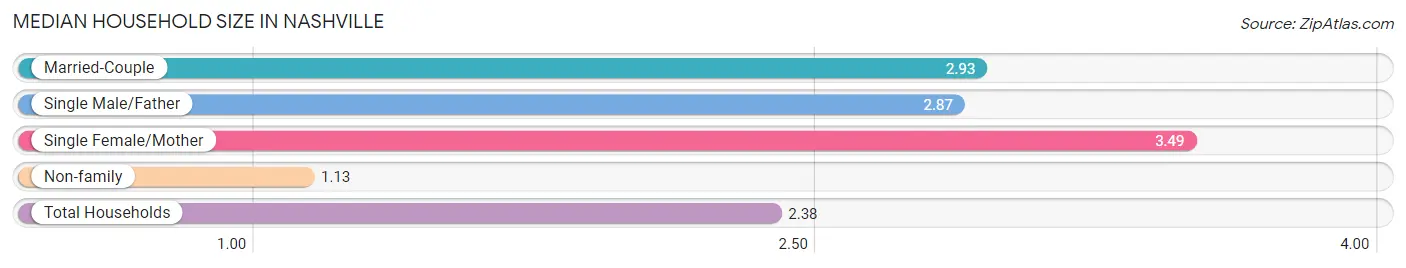
The median household size in Nashville is 2.38 persons per household, with single female/mother households (279 | 16.3%) accounting for the largest median household size of 3.49 persons per household. non-family households (611 | 35.6%) represent the smallest median household size with 1.13 persons per household.
| Household Type | # Households | Household Size |
| Married-Couple | 669 (39.0%) | 2.93 |
| Single Male/Father | 157 (9.1%) | 2.87 |
| Single Female/Mother | 279 (16.3%) | 3.49 |
| Non-family | 611 (35.6%) | 1.13 |
| Total Households | 1,716 (100.0%) | 2.38 |
Household Size by Marriage Status in Nashville
Out of a total of 1,716 households in Nashville, 1,105 (64.4%) are family households, while 611 (35.6%) are nonfamily households. The most numerous type of family households are 2-person households, comprising 410, and the most common type of nonfamily households are 1-person households, comprising 474.
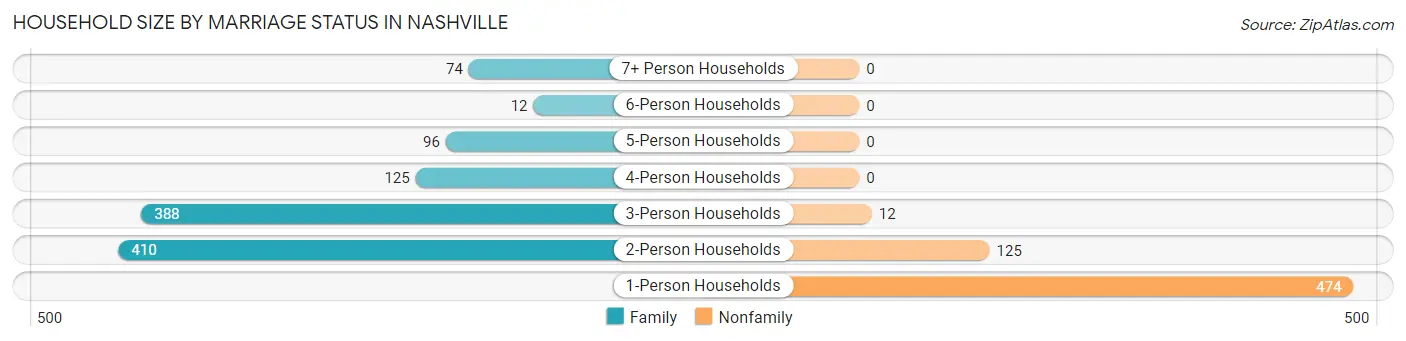
| Household Size | Family Households | Nonfamily Households |
| 1-Person Households | - | 474 (27.6%) |
| 2-Person Households | 410 (23.9%) | 125 (7.3%) |
| 3-Person Households | 388 (22.6%) | 12 (0.7%) |
| 4-Person Households | 125 (7.3%) | 0 (0.0%) |
| 5-Person Households | 96 (5.6%) | 0 (0.0%) |
| 6-Person Households | 12 (0.7%) | 0 (0.0%) |
| 7+ Person Households | 74 (4.3%) | 0 (0.0%) |
| Total | 1,105 (64.4%) | 611 (35.6%) |
Female Fertility in Nashville
Fertility by Age in Nashville
Average fertility rate in Nashville is 93.0 births per 1,000 women. Women in the age bracket of 15 to 19 years have the highest fertility rate with 179.0 births per 1,000 women. Women in the age bracket of 20 to 34 years acount for 68.1% of all women with births.
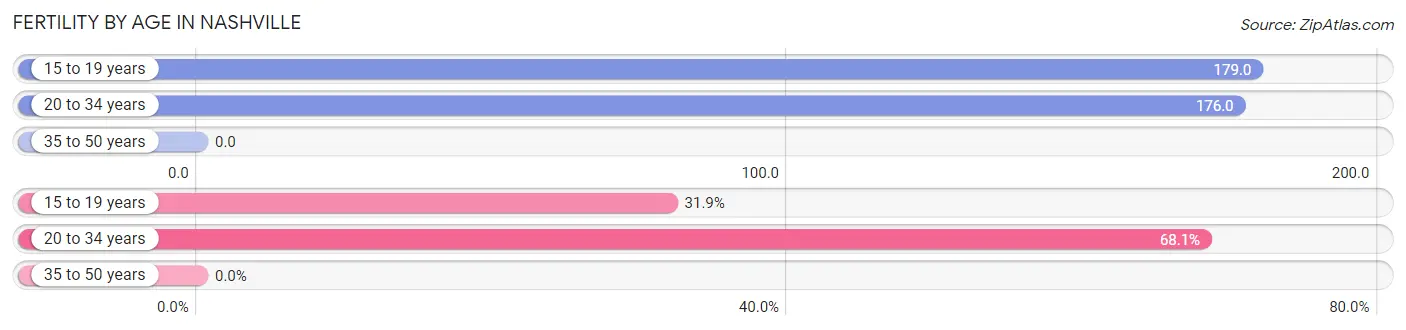
| Age Bracket | Women with Births | Births / 1,000 Women |
| 15 to 19 years | 29 (31.9%) | 179.0 |
| 20 to 34 years | 62 (68.1%) | 176.0 |
| 35 to 50 years | 0 (0.0%) | 0.0 |
| Total | 91 (100.0%) | 93.0 |
Fertility by Age by Marriage Status in Nashville
29.7% of women with births (91) in Nashville are married. The highest percentage of unmarried women with births falls into 15 to 19 years age bracket with 100.0% of them unmarried at the time of birth, while the lowest percentage of unmarried women with births belong to 20 to 34 years age bracket with 56.5% of them unmarried.
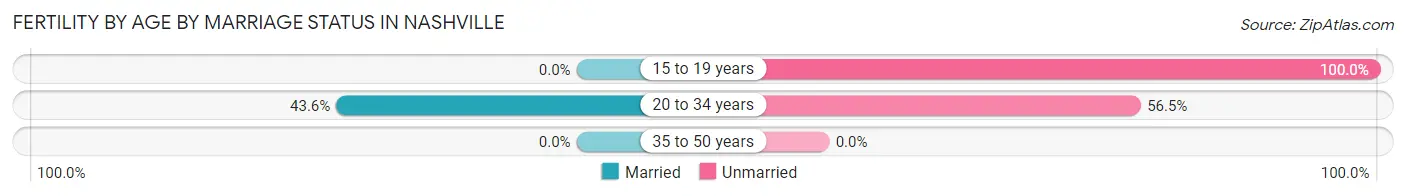
| Age Bracket | Married | Unmarried |
| 15 to 19 years | 0 (0.0%) | 29 (100.0%) |
| 20 to 34 years | 27 (43.5%) | 35 (56.5%) |
| 35 to 50 years | 0 (0.0%) | 0 (0.0%) |
| Total | 27 (29.7%) | 64 (70.3%) |
Fertility by Education in Nashville
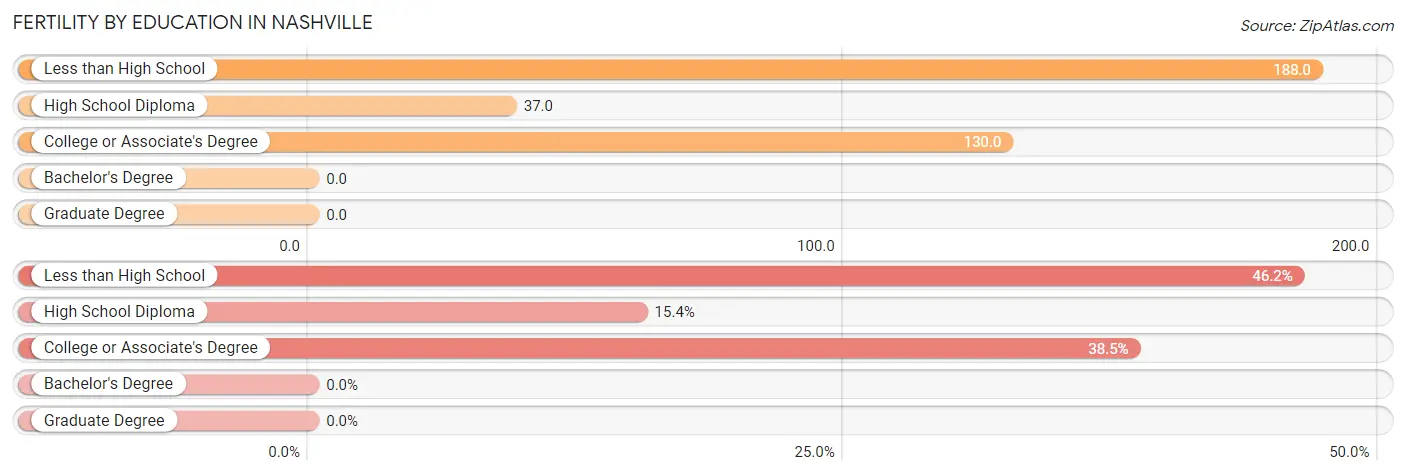
| Educational Attainment | Women with Births | Births / 1,000 Women |
| Less than High School | 42 (46.2%) | 188.0 |
| High School Diploma | 14 (15.4%) | 37.0 |
| College or Associate's Degree | 35 (38.5%) | 130.0 |
| Bachelor's Degree | 0 (0.0%) | 0.0 |
| Graduate Degree | 0 (0.0%) | 0.0 |
| Total | 91 (100.0%) | 93.0 |
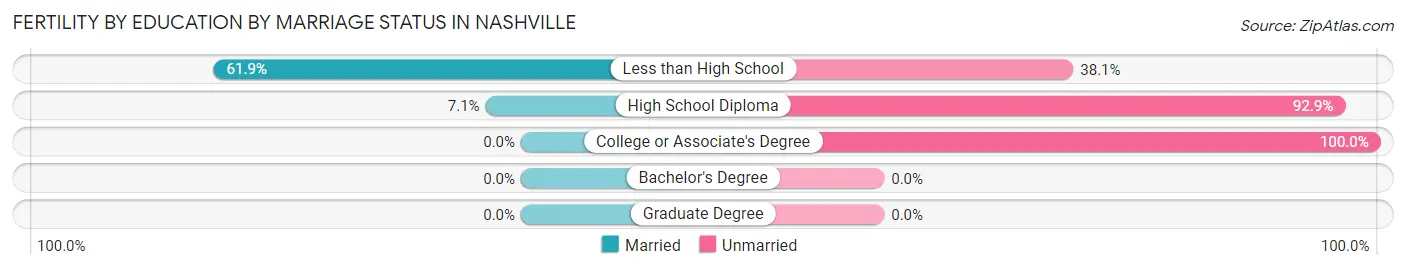
Fertility by Education by Marriage Status in Nashville
70.3% of women with births in Nashville are unmarried. Women with the educational attainment of less than high school are most likely to be married with 61.9% of them married at childbirth, while women with the educational attainment of college or associate's degree are least likely to be married with 100.0% of them unmarried at childbirth.
| Educational Attainment | Married | Unmarried |
| Less than High School | 26 (61.9%) | 16 (38.1%) |
| High School Diploma | 1 (7.1%) | 13 (92.9%) |
| College or Associate's Degree | 0 (0.0%) | 35 (100.0%) |
| Bachelor's Degree | 0 (0.0%) | 0 (0.0%) |
| Graduate Degree | 0 (0.0%) | 0 (0.0%) |
| Total | 27 (29.7%) | 64 (70.3%) |
Employment Characteristics in Nashville
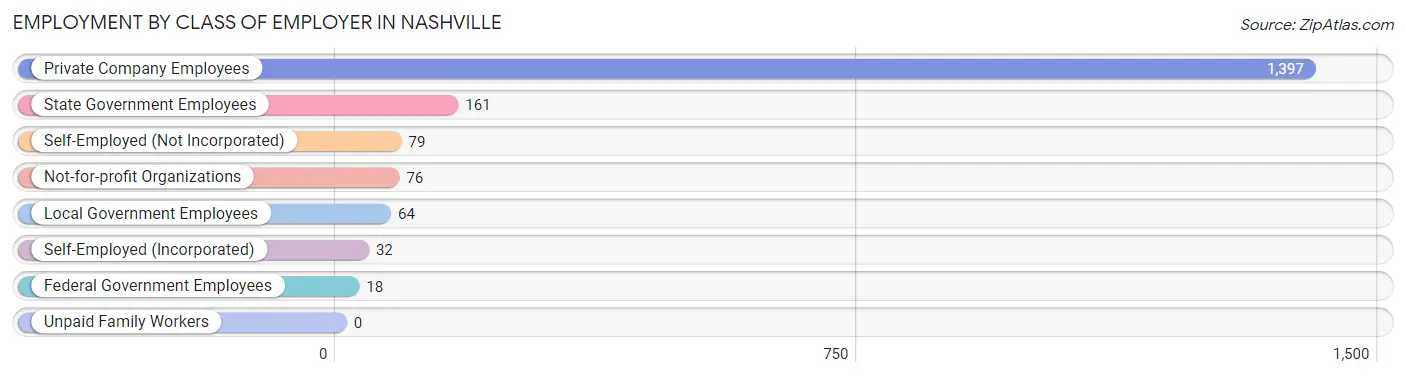
Employment by Class of Employer in Nashville
Among the 1,827 employed individuals in Nashville, private company employees (1,397 | 76.5%), state government employees (161 | 8.8%), and self-employed (not incorporated) (79 | 4.3%) make up the most common classes of employment.
| Employer Class | # Employees | % Employees |
| Private Company Employees | 1,397 | 76.5% |
| Self-Employed (Incorporated) | 32 | 1.8% |
| Self-Employed (Not Incorporated) | 79 | 4.3% |
| Not-for-profit Organizations | 76 | 4.2% |
| Local Government Employees | 64 | 3.5% |
| State Government Employees | 161 | 8.8% |
| Federal Government Employees | 18 | 1.0% |
| Unpaid Family Workers | 0 | 0.0% |
| Total | 1,827 | 100.0% |
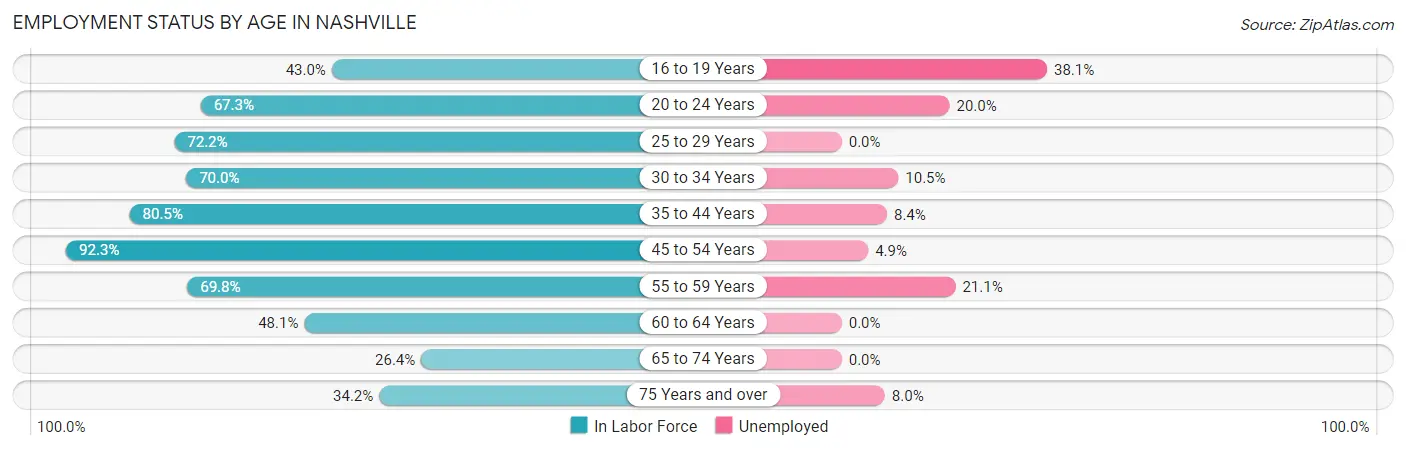
Employment Status by Age in Nashville
According to the labor force statistics for Nashville, out of the total population over 16 years of age (3,335), 60.9% or 2,031 individuals are in the labor force, with 10.0% or 203 of them unemployed. The age group with the highest labor force participation rate is 45 to 54 years, with 92.3% or 286 individuals in the labor force. Within the labor force, the 16 to 19 years age range has the highest percentage of unemployed individuals, with 38.1% or 43 of them being unemployed.
| Age Bracket | In Labor Force | Unemployed |
| 16 to 19 Years | 113 (43.0%) | 43 (38.1%) |
| 20 to 24 Years | 175 (67.3%) | 35 (20.0%) |
| 25 to 29 Years | 200 (72.2%) | 0 (0.0%) |
| 30 to 34 Years | 105 (70.0%) | 11 (10.5%) |
| 35 to 44 Years | 583 (80.5%) | 49 (8.4%) |
| 45 to 54 Years | 286 (92.3%) | 14 (4.9%) |
| 55 to 59 Years | 199 (69.8%) | 42 (21.1%) |
| 60 to 64 Years | 137 (48.1%) | 0 (0.0%) |
| 65 to 74 Years | 119 (26.4%) | 0 (0.0%) |
| 75 Years and over | 113 (34.2%) | 9 (8.0%) |
| Total | 2,031 (60.9%) | 203 (10.0%) |
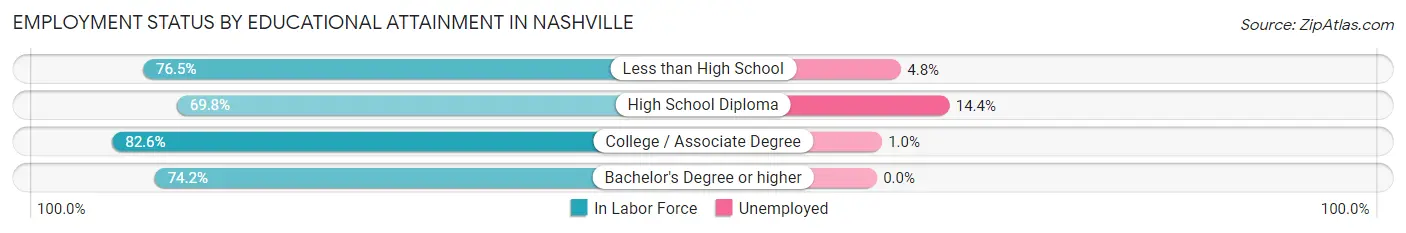
Employment Status by Educational Attainment in Nashville
According to labor force statistics for Nashville, 74.3% of individuals (1,509) out of the total population between 25 and 64 years of age (2,031) are in the labor force, with 7.7% or 116 of them being unemployed. The group with the highest labor force participation rate are those with the educational attainment of college / associate degree, with 82.6% or 400 individuals in the labor force. Within the labor force, individuals with high school diploma education have the highest percentage of unemployment, with 14.4% or 101 of them being unemployed.
| Educational Attainment | In Labor Force | Unemployed |
| Less than High School | 228 (76.5%) | 14 (4.8%) |
| High School Diploma | 701 (69.8%) | 145 (14.4%) |
| College / Associate Degree | 400 (82.6%) | 5 (1.0%) |
| Bachelor's Degree or higher | 181 (74.2%) | 0 (0.0%) |
| Total | 1,509 (74.3%) | 156 (7.7%) |
Employment Occupations by Sex in Nashville
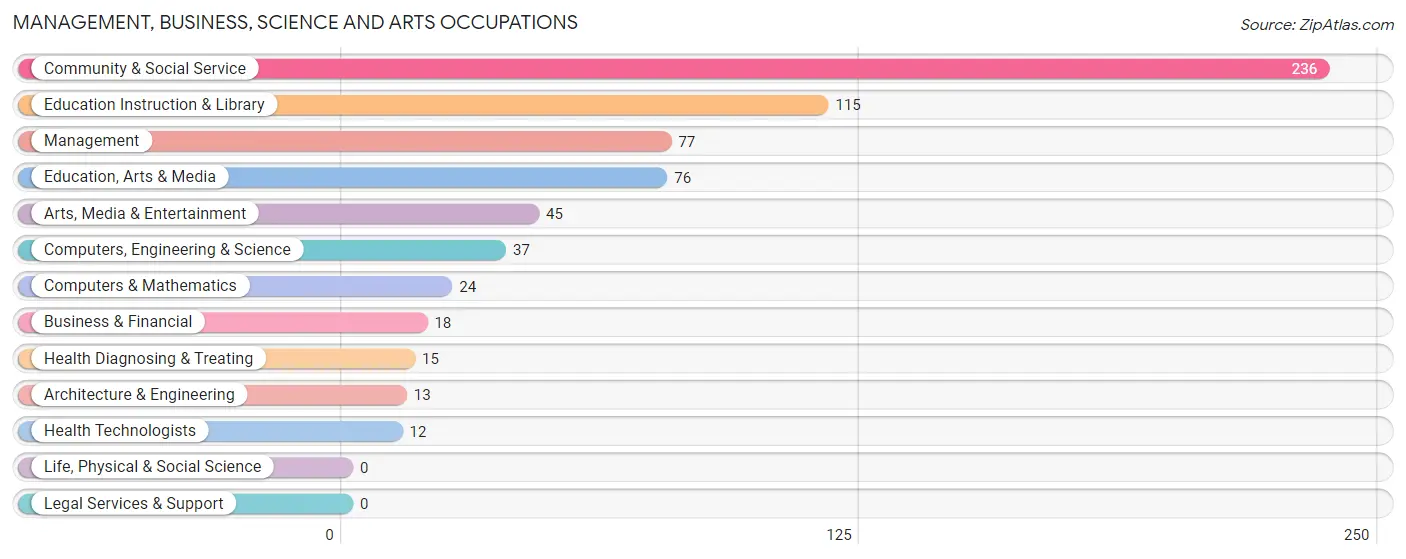
Management, Business, Science and Arts Occupations
The most common Management, Business, Science and Arts occupations in Nashville are Community & Social Service (236 | 12.9%), Education Instruction & Library (115 | 6.3%), Management (77 | 4.2%), Education, Arts & Media (76 | 4.2%), and Arts, Media & Entertainment (45 | 2.5%).
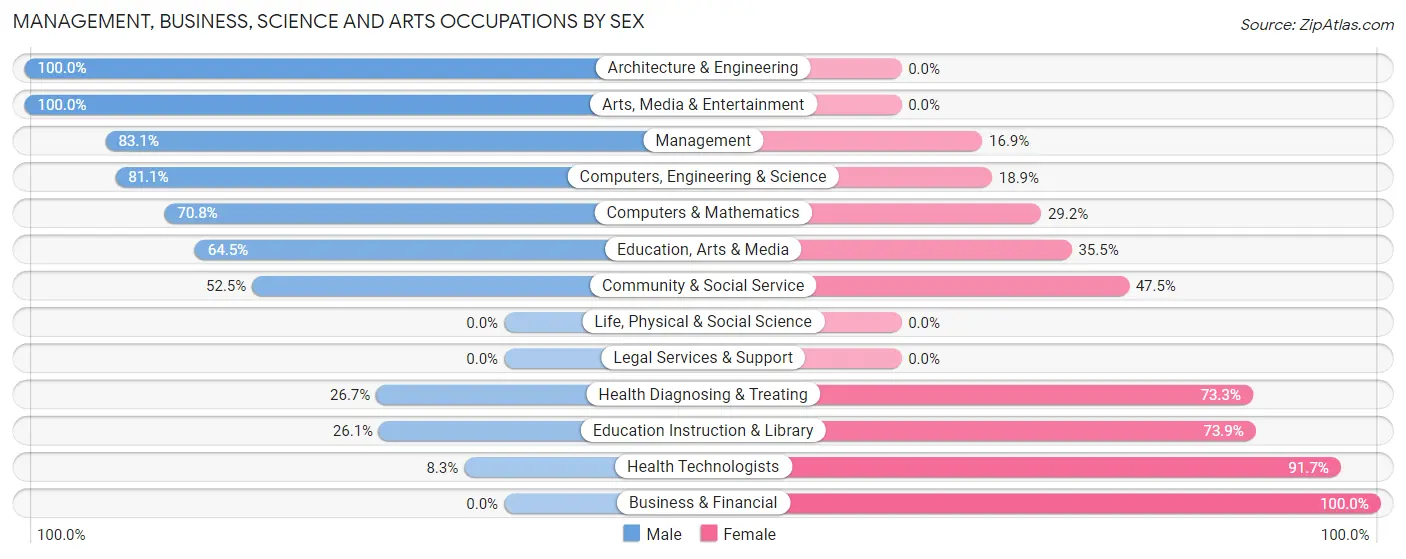
Management, Business, Science and Arts Occupations by Sex
Within the Management, Business, Science and Arts occupations in Nashville, the most male-oriented occupations are Architecture & Engineering (100.0%), Arts, Media & Entertainment (100.0%), and Management (83.1%), while the most female-oriented occupations are Business & Financial (100.0%), Health Technologists (91.7%), and Education Instruction & Library (73.9%).
| Occupation | Male | Female |
| Management | 64 (83.1%) | 13 (16.9%) |
| Business & Financial | 0 (0.0%) | 18 (100.0%) |
| Computers, Engineering & Science | 30 (81.1%) | 7 (18.9%) |
| Computers & Mathematics | 17 (70.8%) | 7 (29.2%) |
| Architecture & Engineering | 13 (100.0%) | 0 (0.0%) |
| Life, Physical & Social Science | 0 (0.0%) | 0 (0.0%) |
| Community & Social Service | 124 (52.5%) | 112 (47.5%) |
| Education, Arts & Media | 49 (64.5%) | 27 (35.5%) |
| Legal Services & Support | 0 (0.0%) | 0 (0.0%) |
| Education Instruction & Library | 30 (26.1%) | 85 (73.9%) |
| Arts, Media & Entertainment | 45 (100.0%) | 0 (0.0%) |
| Health Diagnosing & Treating | 4 (26.7%) | 11 (73.3%) |
| Health Technologists | 1 (8.3%) | 11 (91.7%) |
| Total (Category) | 222 (58.0%) | 161 (42.0%) |
| Total (Overall) | 924 (50.6%) | 903 (49.4%) |
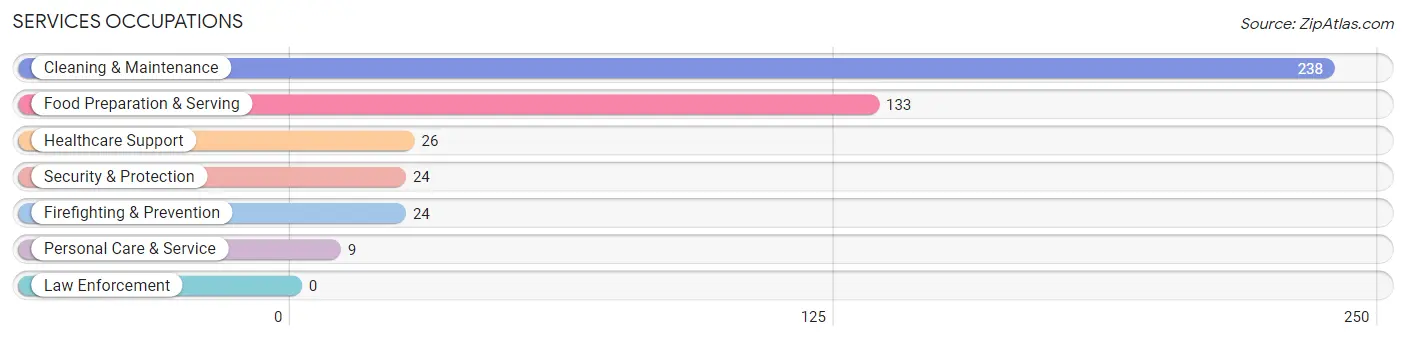
Services Occupations
The most common Services occupations in Nashville are Cleaning & Maintenance (238 | 13.0%), Food Preparation & Serving (133 | 7.3%), Healthcare Support (26 | 1.4%), Security & Protection (24 | 1.3%), and Firefighting & Prevention (24 | 1.3%).
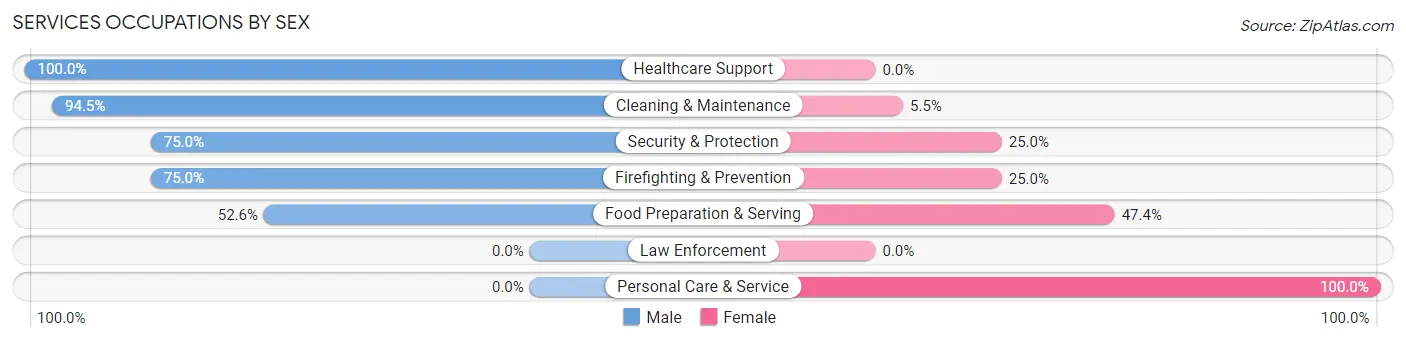
Services Occupations by Sex
Within the Services occupations in Nashville, the most male-oriented occupations are Healthcare Support (100.0%), Cleaning & Maintenance (94.5%), and Security & Protection (75.0%), while the most female-oriented occupations are Personal Care & Service (100.0%), Food Preparation & Serving (47.4%), and Security & Protection (25.0%).
| Occupation | Male | Female |
| Healthcare Support | 26 (100.0%) | 0 (0.0%) |
| Security & Protection | 18 (75.0%) | 6 (25.0%) |
| Firefighting & Prevention | 18 (75.0%) | 6 (25.0%) |
| Law Enforcement | 0 (0.0%) | 0 (0.0%) |
| Food Preparation & Serving | 70 (52.6%) | 63 (47.4%) |
| Cleaning & Maintenance | 225 (94.5%) | 13 (5.5%) |
| Personal Care & Service | 0 (0.0%) | 9 (100.0%) |
| Total (Category) | 339 (78.8%) | 91 (21.2%) |
| Total (Overall) | 924 (50.6%) | 903 (49.4%) |
Sales and Office Occupations
The most common Sales and Office occupations in Nashville are Office & Administration (188 | 10.3%), and Sales & Related (147 | 8.1%).

Sales and Office Occupations by Sex
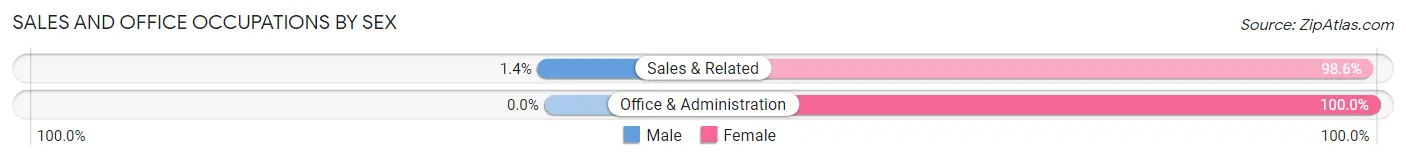
| Occupation | Male | Female |
| Sales & Related | 2 (1.4%) | 145 (98.6%) |
| Office & Administration | 0 (0.0%) | 188 (100.0%) |
| Total (Category) | 2 (0.6%) | 333 (99.4%) |
| Total (Overall) | 924 (50.6%) | 903 (49.4%) |
Natural Resources, Construction and Maintenance Occupations
The most common Natural Resources, Construction and Maintenance occupations in Nashville are Installation, Maintenance & Repair (61 | 3.3%), Farming, Fishing & Forestry (51 | 2.8%), and Construction & Extraction (20 | 1.1%).

Natural Resources, Construction and Maintenance Occupations by Sex
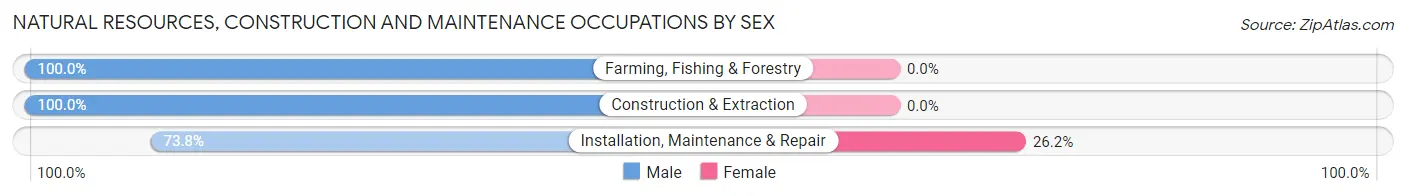
| Occupation | Male | Female |
| Farming, Fishing & Forestry | 51 (100.0%) | 0 (0.0%) |
| Construction & Extraction | 20 (100.0%) | 0 (0.0%) |
| Installation, Maintenance & Repair | 45 (73.8%) | 16 (26.2%) |
| Total (Category) | 116 (87.9%) | 16 (12.1%) |
| Total (Overall) | 924 (50.6%) | 903 (49.4%) |
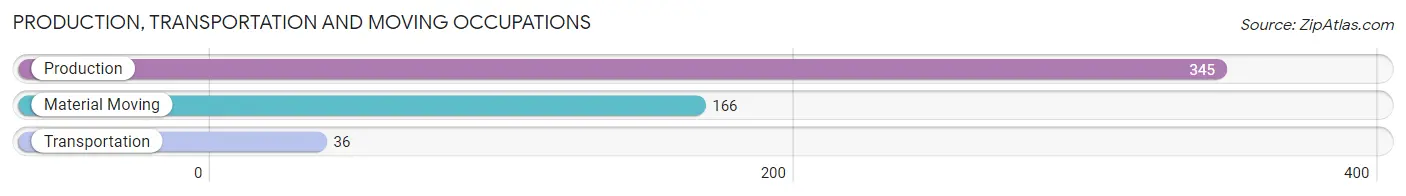
Production, Transportation and Moving Occupations
The most common Production, Transportation and Moving occupations in Nashville are Production (345 | 18.9%), Material Moving (166 | 9.1%), and Transportation (36 | 2.0%).
Production, Transportation and Moving Occupations by Sex
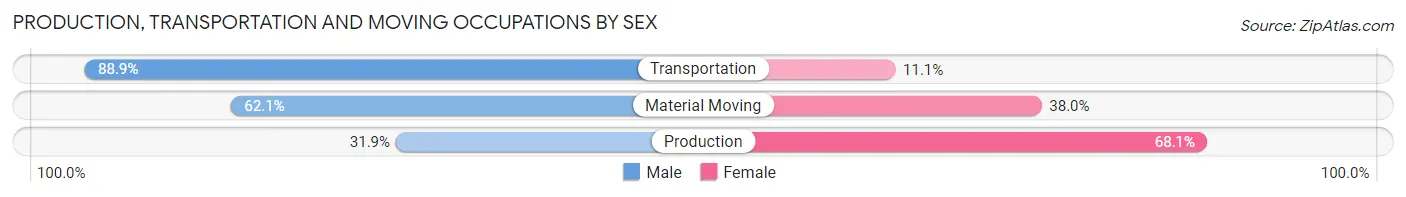
| Occupation | Male | Female |
| Production | 110 (31.9%) | 235 (68.1%) |
| Transportation | 32 (88.9%) | 4 (11.1%) |
| Material Moving | 103 (62.1%) | 63 (38.0%) |
| Total (Category) | 245 (44.8%) | 302 (55.2%) |
| Total (Overall) | 924 (50.6%) | 903 (49.4%) |
Employment Industries by Sex in Nashville
Employment Industries in Nashville
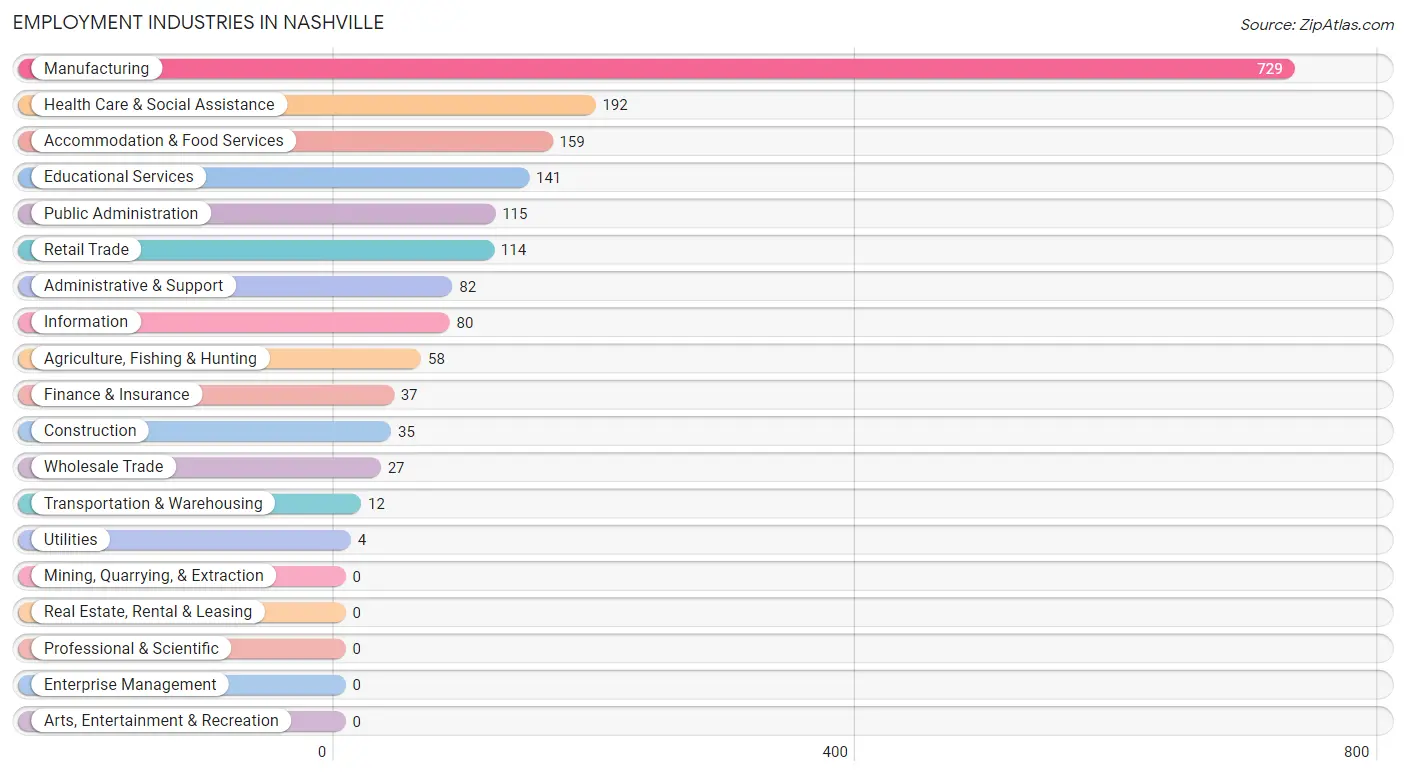
The major employment industries in Nashville include Manufacturing (729 | 39.9%), Health Care & Social Assistance (192 | 10.5%), Accommodation & Food Services (159 | 8.7%), Educational Services (141 | 7.7%), and Public Administration (115 | 6.3%).
Employment Industries by Sex in Nashville
The Nashville industries that see more men than women are Transportation & Warehousing (100.0%), Utilities (100.0%), and Agriculture, Fishing & Hunting (87.9%), whereas the industries that tend to have a higher number of women are Finance & Insurance (100.0%), Retail Trade (71.1%), and Educational Services (67.4%).
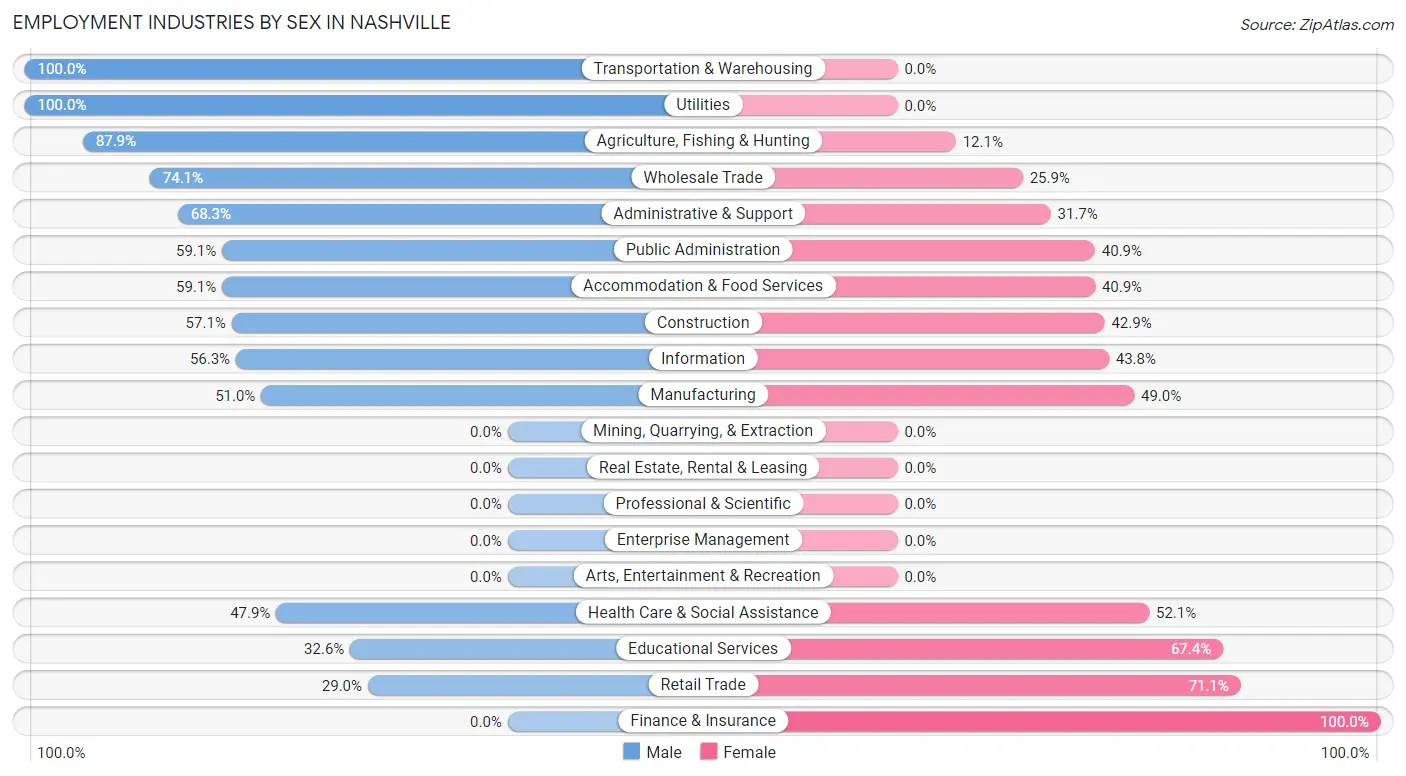
| Industry | Male | Female |
| Agriculture, Fishing & Hunting | 51 (87.9%) | 7 (12.1%) |
| Mining, Quarrying, & Extraction | 0 (0.0%) | 0 (0.0%) |
| Construction | 20 (57.1%) | 15 (42.9%) |
| Manufacturing | 372 (51.0%) | 357 (49.0%) |
| Wholesale Trade | 20 (74.1%) | 7 (25.9%) |
| Retail Trade | 33 (28.9%) | 81 (71.1%) |
| Transportation & Warehousing | 12 (100.0%) | 0 (0.0%) |
| Utilities | 4 (100.0%) | 0 (0.0%) |
| Information | 45 (56.2%) | 35 (43.8%) |
| Finance & Insurance | 0 (0.0%) | 37 (100.0%) |
| Real Estate, Rental & Leasing | 0 (0.0%) | 0 (0.0%) |
| Professional & Scientific | 0 (0.0%) | 0 (0.0%) |
| Enterprise Management | 0 (0.0%) | 0 (0.0%) |
| Administrative & Support | 56 (68.3%) | 26 (31.7%) |
| Educational Services | 46 (32.6%) | 95 (67.4%) |
| Health Care & Social Assistance | 92 (47.9%) | 100 (52.1%) |
| Arts, Entertainment & Recreation | 0 (0.0%) | 0 (0.0%) |
| Accommodation & Food Services | 94 (59.1%) | 65 (40.9%) |
| Public Administration | 68 (59.1%) | 47 (40.9%) |
| Total | 924 (50.6%) | 903 (49.4%) |
Education in Nashville
School Enrollment in Nashville
The most common levels of schooling among the 938 students in Nashville are high school (223 | 23.8%), elementary school (215 | 22.9%), and middle school (162 | 17.3%).
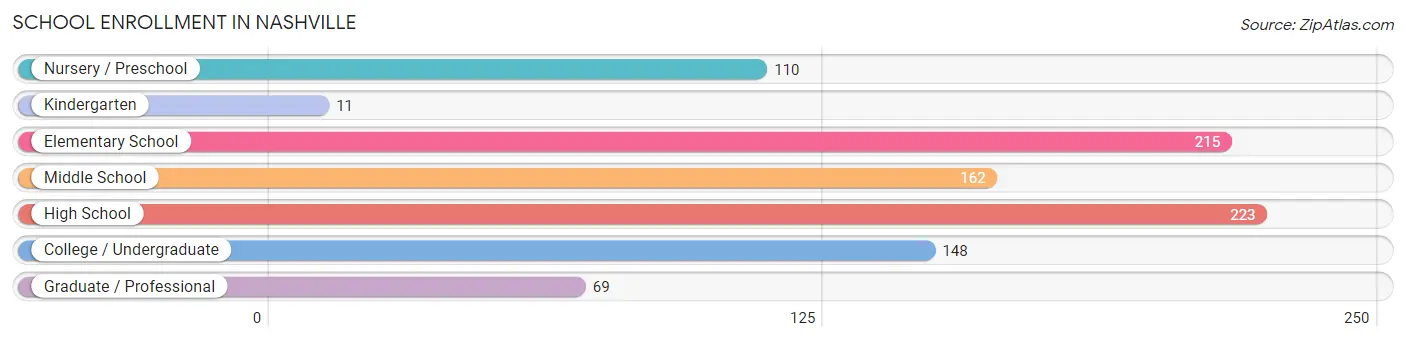
| School Level | # Students | % Students |
| Nursery / Preschool | 110 | 11.7% |
| Kindergarten | 11 | 1.2% |
| Elementary School | 215 | 22.9% |
| Middle School | 162 | 17.3% |
| High School | 223 | 23.8% |
| College / Undergraduate | 148 | 15.8% |
| Graduate / Professional | 69 | 7.4% |
| Total | 938 | 100.0% |
School Enrollment by Age by Funding Source in Nashville
Out of a total of 938 students who are enrolled in schools in Nashville, 59 (6.3%) attend a private institution, while the remaining 879 (93.7%) are enrolled in public schools. The age group of 3 to 4 year olds has the highest likelihood of being enrolled in private schools, with 41 (41.0% in the age bracket) enrolled. Conversely, the age group of 5 to 9 year old has the lowest likelihood of being enrolled in a private school, with 209 (100.0% in the age bracket) attending a public institution.
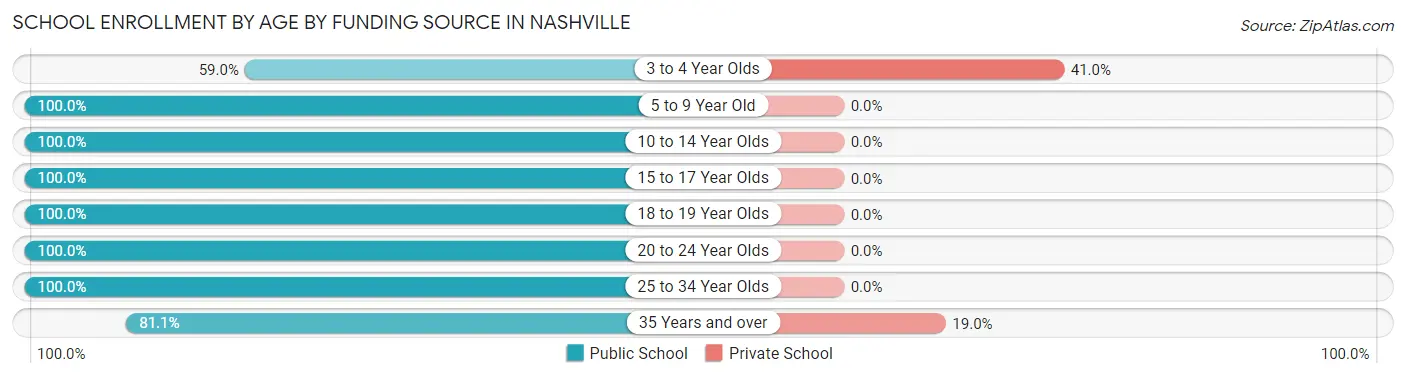
| Age Bracket | Public School | Private School |
| 3 to 4 Year Olds | 59 (59.0%) | 41 (41.0%) |
| 5 to 9 Year Old | 209 (100.0%) | 0 (0.0%) |
| 10 to 14 Year Olds | 218 (100.0%) | 0 (0.0%) |
| 15 to 17 Year Olds | 154 (100.0%) | 0 (0.0%) |
| 18 to 19 Year Olds | 92 (100.0%) | 0 (0.0%) |
| 20 to 24 Year Olds | 35 (100.0%) | 0 (0.0%) |
| 25 to 34 Year Olds | 35 (100.0%) | 0 (0.0%) |
| 35 Years and over | 77 (81.0%) | 18 (19.0%) |
| Total | 879 (93.7%) | 59 (6.3%) |
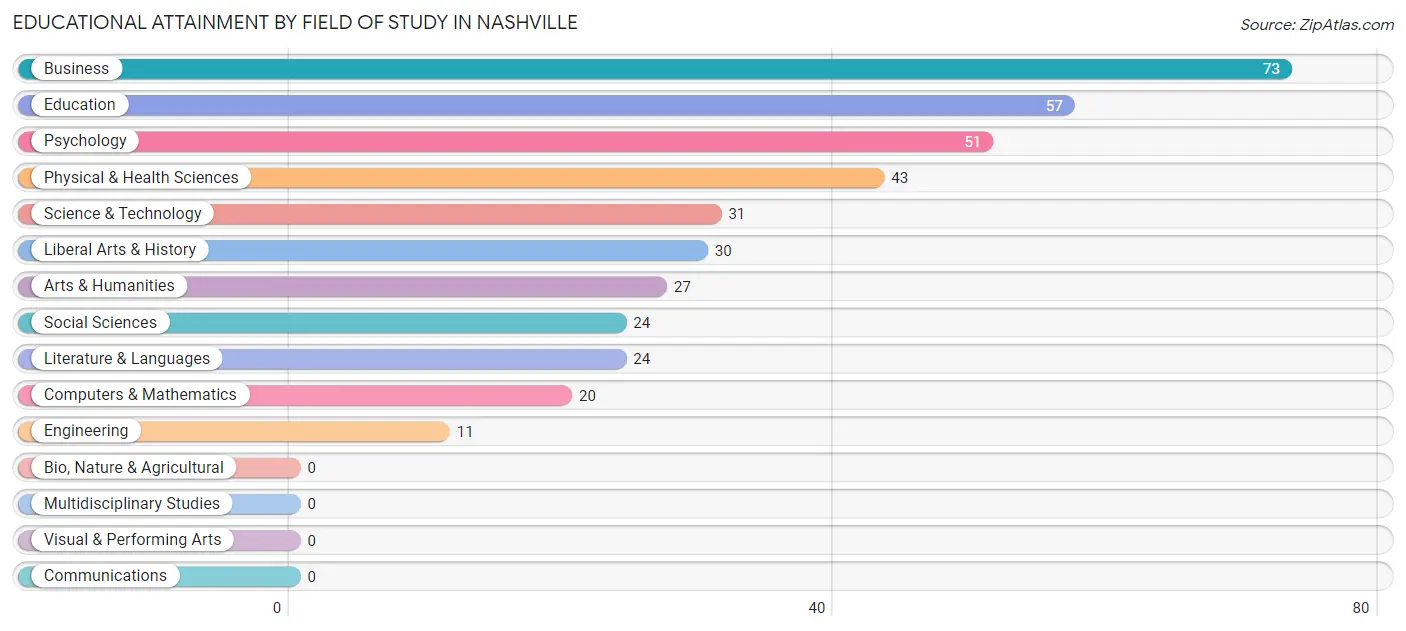
Educational Attainment by Field of Study in Nashville
Business (73 | 18.7%), education (57 | 14.6%), psychology (51 | 13.0%), physical & health sciences (43 | 11.0%), and science & technology (31 | 7.9%) are the most common fields of study among 391 individuals in Nashville who have obtained a bachelor's degree or higher.
| Field of Study | # Graduates | % Graduates |
| Computers & Mathematics | 20 | 5.1% |
| Bio, Nature & Agricultural | 0 | 0.0% |
| Physical & Health Sciences | 43 | 11.0% |
| Psychology | 51 | 13.0% |
| Social Sciences | 24 | 6.1% |
| Engineering | 11 | 2.8% |
| Multidisciplinary Studies | 0 | 0.0% |
| Science & Technology | 31 | 7.9% |
| Business | 73 | 18.7% |
| Education | 57 | 14.6% |
| Literature & Languages | 24 | 6.1% |
| Liberal Arts & History | 30 | 7.7% |
| Visual & Performing Arts | 0 | 0.0% |
| Communications | 0 | 0.0% |
| Arts & Humanities | 27 | 6.9% |
| Total | 391 | 100.0% |
Transportation & Commute in Nashville
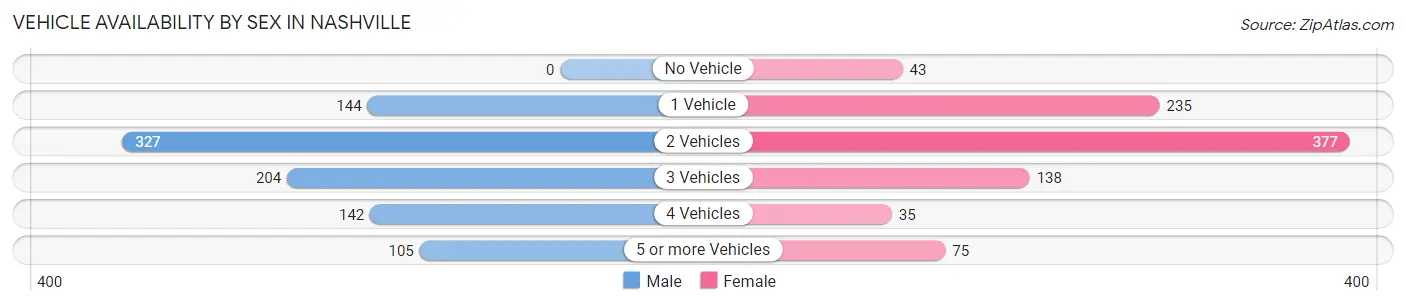
Vehicle Availability by Sex in Nashville
The most prevalent vehicle ownership categories in Nashville are males with 2 vehicles (327, accounting for 35.5%) and females with 2 vehicles (377, making up 36.2%).
| Vehicles Available | Male | Female |
| No Vehicle | 0 (0.0%) | 43 (4.8%) |
| 1 Vehicle | 144 (15.6%) | 235 (26.0%) |
| 2 Vehicles | 327 (35.5%) | 377 (41.7%) |
| 3 Vehicles | 204 (22.1%) | 138 (15.3%) |
| 4 Vehicles | 142 (15.4%) | 35 (3.9%) |
| 5 or more Vehicles | 105 (11.4%) | 75 (8.3%) |
| Total | 922 (100.0%) | 903 (100.0%) |
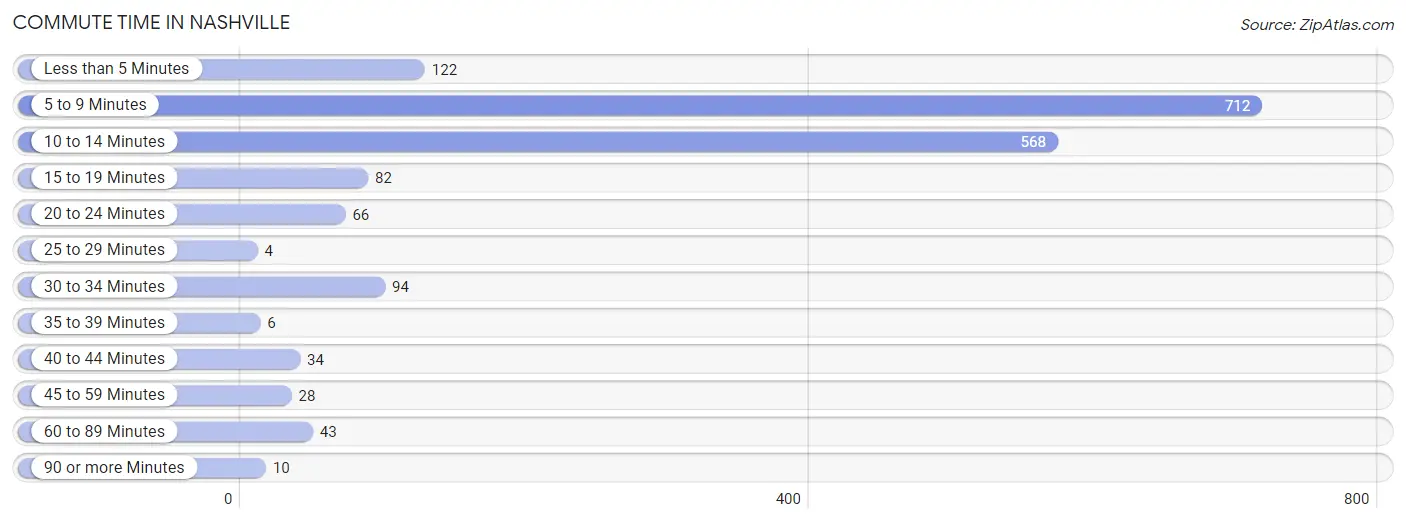
Commute Time in Nashville
The most frequently occuring commute durations in Nashville are 5 to 9 minutes (712 commuters, 40.3%), 10 to 14 minutes (568 commuters, 32.1%), and less than 5 minutes (122 commuters, 6.9%).
| Commute Time | # Commuters | % Commuters |
| Less than 5 Minutes | 122 | 6.9% |
| 5 to 9 Minutes | 712 | 40.3% |
| 10 to 14 Minutes | 568 | 32.1% |
| 15 to 19 Minutes | 82 | 4.6% |
| 20 to 24 Minutes | 66 | 3.7% |
| 25 to 29 Minutes | 4 | 0.2% |
| 30 to 34 Minutes | 94 | 5.3% |
| 35 to 39 Minutes | 6 | 0.3% |
| 40 to 44 Minutes | 34 | 1.9% |
| 45 to 59 Minutes | 28 | 1.6% |
| 60 to 89 Minutes | 43 | 2.4% |
| 90 or more Minutes | 10 | 0.6% |
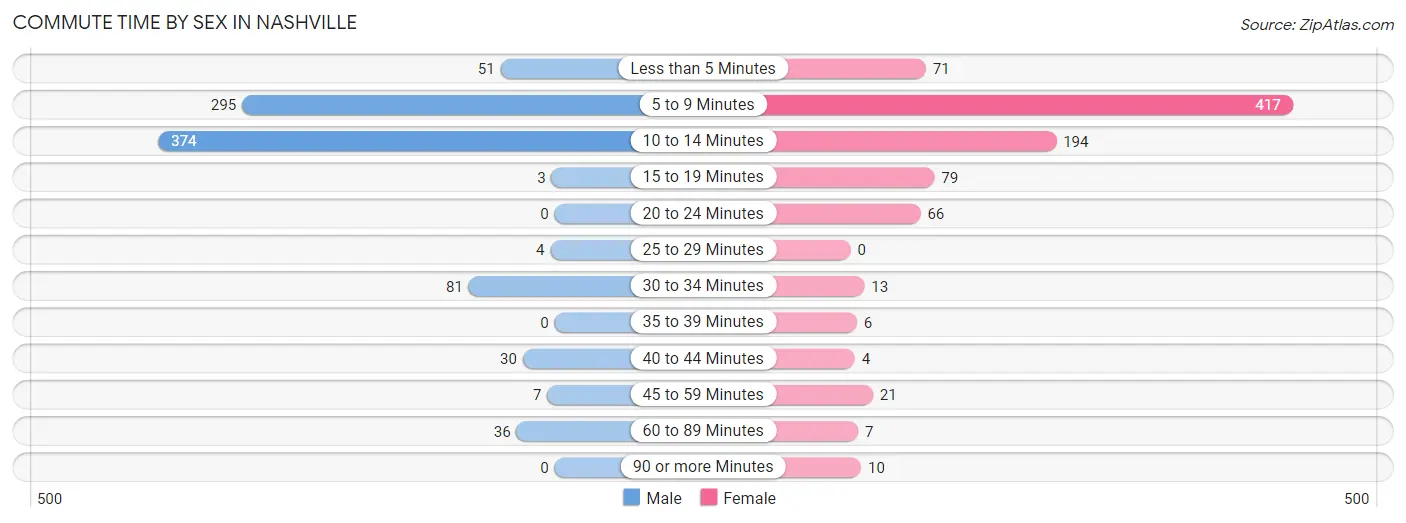
Commute Time by Sex in Nashville
The most common commute times in Nashville are 10 to 14 minutes (374 commuters, 42.4%) for males and 5 to 9 minutes (417 commuters, 47.0%) for females.
| Commute Time | Male | Female |
| Less than 5 Minutes | 51 (5.8%) | 71 (8.0%) |
| 5 to 9 Minutes | 295 (33.5%) | 417 (47.0%) |
| 10 to 14 Minutes | 374 (42.4%) | 194 (21.8%) |
| 15 to 19 Minutes | 3 (0.3%) | 79 (8.9%) |
| 20 to 24 Minutes | 0 (0.0%) | 66 (7.4%) |
| 25 to 29 Minutes | 4 (0.4%) | 0 (0.0%) |
| 30 to 34 Minutes | 81 (9.2%) | 13 (1.5%) |
| 35 to 39 Minutes | 0 (0.0%) | 6 (0.7%) |
| 40 to 44 Minutes | 30 (3.4%) | 4 (0.4%) |
| 45 to 59 Minutes | 7 (0.8%) | 21 (2.4%) |
| 60 to 89 Minutes | 36 (4.1%) | 7 (0.8%) |
| 90 or more Minutes | 0 (0.0%) | 10 (1.1%) |
Time of Departure to Work by Sex in Nashville
The most frequent times of departure to work in Nashville are 12:00 AM to 4:59 AM (191, 21.7%) for males and 12:00 PM to 3:59 PM (145, 16.3%) for females.
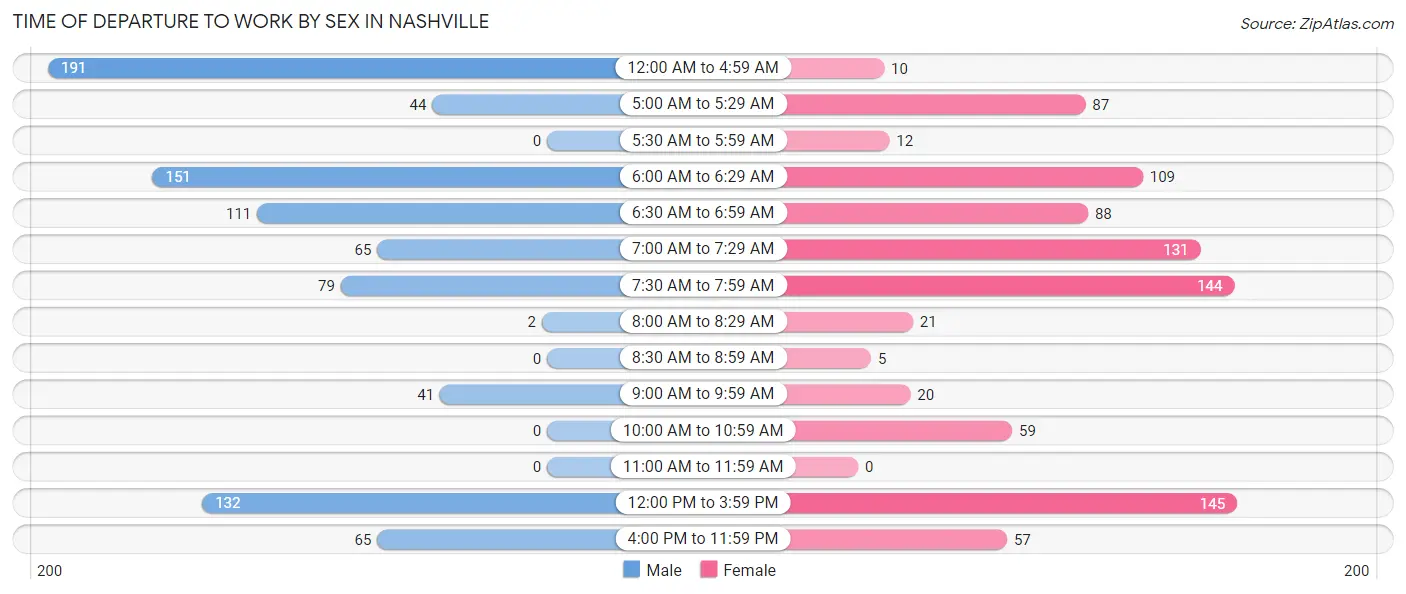
| Time of Departure | Male | Female |
| 12:00 AM to 4:59 AM | 191 (21.7%) | 10 (1.1%) |
| 5:00 AM to 5:29 AM | 44 (5.0%) | 87 (9.8%) |
| 5:30 AM to 5:59 AM | 0 (0.0%) | 12 (1.3%) |
| 6:00 AM to 6:29 AM | 151 (17.1%) | 109 (12.3%) |
| 6:30 AM to 6:59 AM | 111 (12.6%) | 88 (9.9%) |
| 7:00 AM to 7:29 AM | 65 (7.4%) | 131 (14.7%) |
| 7:30 AM to 7:59 AM | 79 (9.0%) | 144 (16.2%) |
| 8:00 AM to 8:29 AM | 2 (0.2%) | 21 (2.4%) |
| 8:30 AM to 8:59 AM | 0 (0.0%) | 5 (0.6%) |
| 9:00 AM to 9:59 AM | 41 (4.6%) | 20 (2.2%) |
| 10:00 AM to 10:59 AM | 0 (0.0%) | 59 (6.6%) |
| 11:00 AM to 11:59 AM | 0 (0.0%) | 0 (0.0%) |
| 12:00 PM to 3:59 PM | 132 (15.0%) | 145 (16.3%) |
| 4:00 PM to 11:59 PM | 65 (7.4%) | 57 (6.4%) |
| Total | 881 (100.0%) | 888 (100.0%) |
Housing Occupancy in Nashville
Occupancy by Ownership in Nashville
Of the total 1,716 dwellings in Nashville, owner-occupied units account for 1,010 (58.9%), while renter-occupied units make up 706 (41.1%).
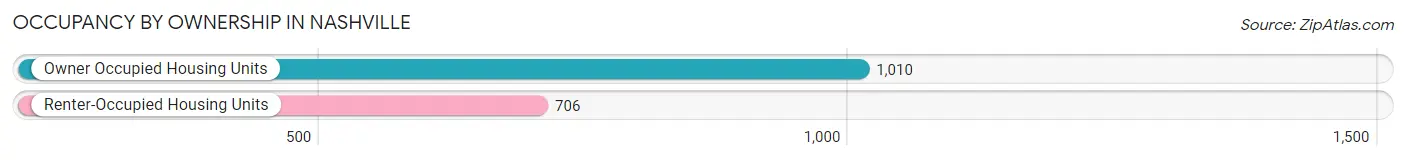
| Occupancy | # Housing Units | % Housing Units |
| Owner Occupied Housing Units | 1,010 | 58.9% |
| Renter-Occupied Housing Units | 706 | 41.1% |
| Total Occupied Housing Units | 1,716 | 100.0% |
Occupancy by Household Size in Nashville
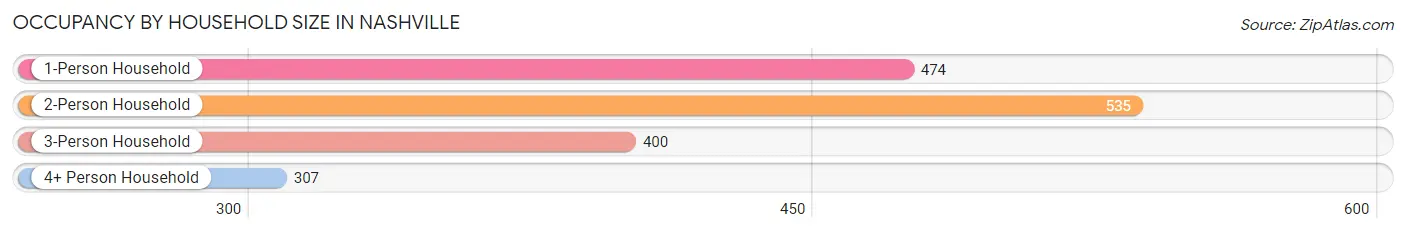
| Household Size | # Housing Units | % Housing Units |
| 1-Person Household | 474 | 27.6% |
| 2-Person Household | 535 | 31.2% |
| 3-Person Household | 400 | 23.3% |
| 4+ Person Household | 307 | 17.9% |
| Total Housing Units | 1,716 | 100.0% |
Occupancy by Ownership by Household Size in Nashville
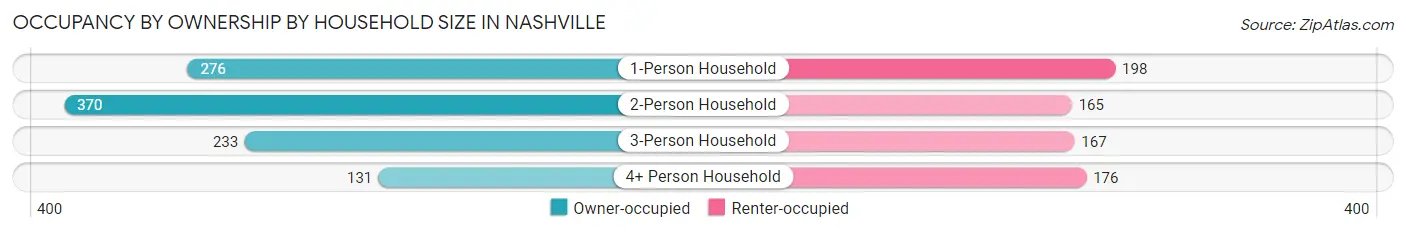
| Household Size | Owner-occupied | Renter-occupied |
| 1-Person Household | 276 (58.2%) | 198 (41.8%) |
| 2-Person Household | 370 (69.2%) | 165 (30.8%) |
| 3-Person Household | 233 (58.3%) | 167 (41.7%) |
| 4+ Person Household | 131 (42.7%) | 176 (57.3%) |
| Total Housing Units | 1,010 (58.9%) | 706 (41.1%) |
Occupancy by Educational Attainment in Nashville
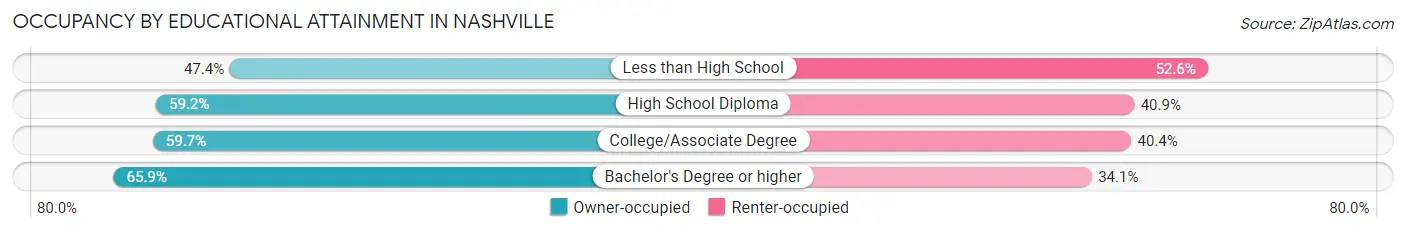
| Household Size | Owner-occupied | Renter-occupied |
| Less than High School | 101 (47.4%) | 112 (52.6%) |
| High School Diploma | 430 (59.2%) | 297 (40.8%) |
| College/Associate Degree | 309 (59.7%) | 209 (40.4%) |
| Bachelor's Degree or higher | 170 (65.9%) | 88 (34.1%) |
Occupancy by Age of Householder in Nashville
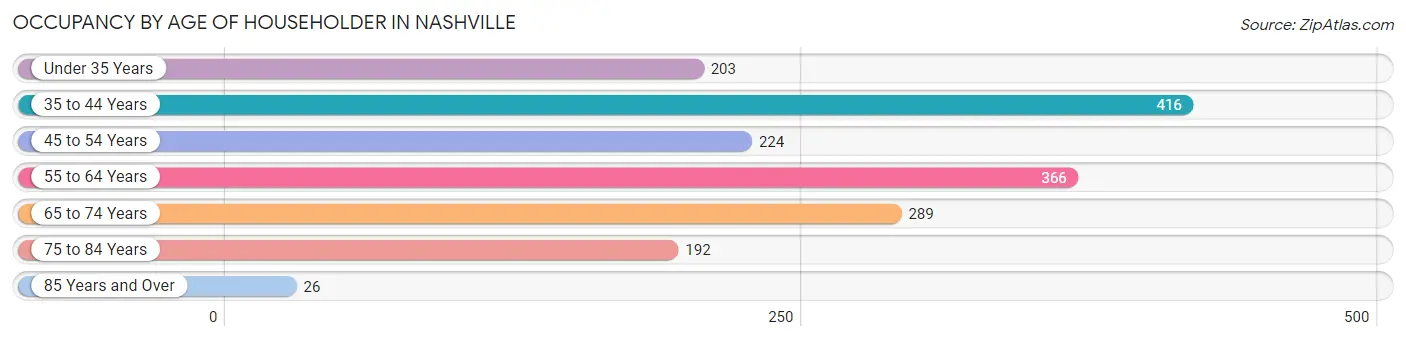
| Age Bracket | # Households | % Households |
| Under 35 Years | 203 | 11.8% |
| 35 to 44 Years | 416 | 24.2% |
| 45 to 54 Years | 224 | 13.1% |
| 55 to 64 Years | 366 | 21.3% |
| 65 to 74 Years | 289 | 16.8% |
| 75 to 84 Years | 192 | 11.2% |
| 85 Years and Over | 26 | 1.5% |
| Total | 1,716 | 100.0% |
Housing Finances in Nashville
Median Income by Occupancy in Nashville
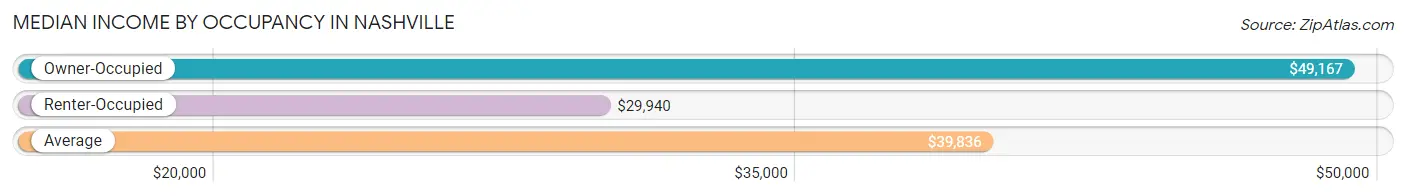
| Occupancy Type | # Households | Median Income |
| Owner-Occupied | 1,010 (58.9%) | $49,167 |
| Renter-Occupied | 706 (41.1%) | $29,940 |
| Average | 1,716 (100.0%) | $39,836 |
Occupancy by Householder Income Bracket in Nashville
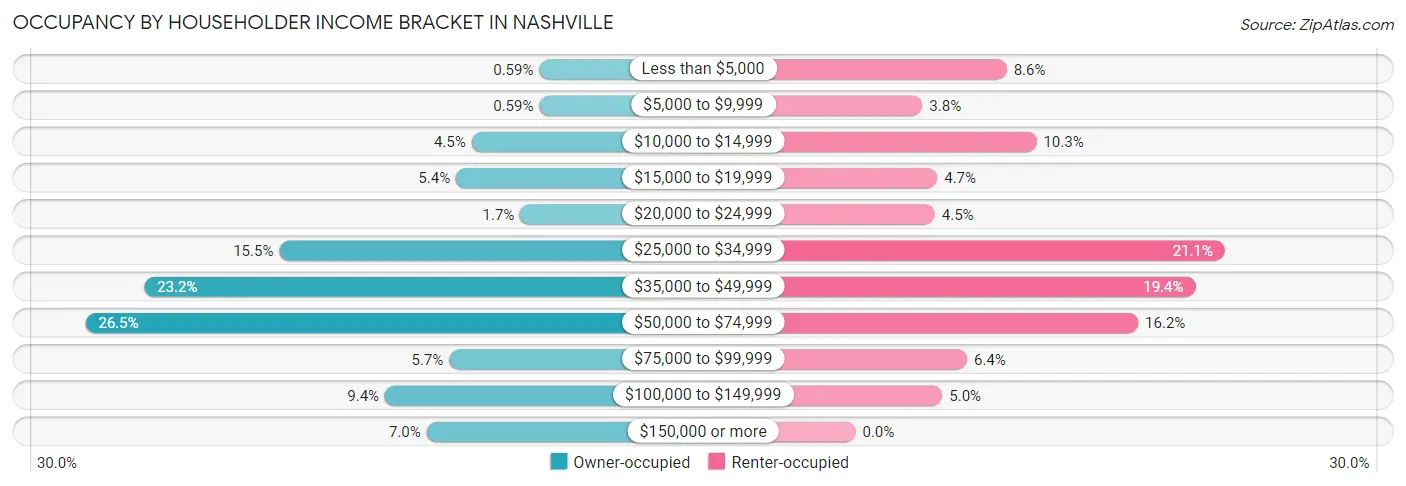
| Income Bracket | Owner-occupied | Renter-occupied |
| Less than $5,000 | 6 (0.6%) | 61 (8.6%) |
| $5,000 to $9,999 | 6 (0.6%) | 27 (3.8%) |
| $10,000 to $14,999 | 45 (4.5%) | 73 (10.3%) |
| $15,000 to $19,999 | 54 (5.3%) | 33 (4.7%) |
| $20,000 to $24,999 | 17 (1.7%) | 32 (4.5%) |
| $25,000 to $34,999 | 156 (15.4%) | 149 (21.1%) |
| $35,000 to $49,999 | 234 (23.2%) | 137 (19.4%) |
| $50,000 to $74,999 | 268 (26.5%) | 114 (16.2%) |
| $75,000 to $99,999 | 58 (5.7%) | 45 (6.4%) |
| $100,000 to $149,999 | 95 (9.4%) | 35 (5.0%) |
| $150,000 or more | 71 (7.0%) | 0 (0.0%) |
| Total | 1,010 (100.0%) | 706 (100.0%) |
Monthly Housing Cost Tiers in Nashville
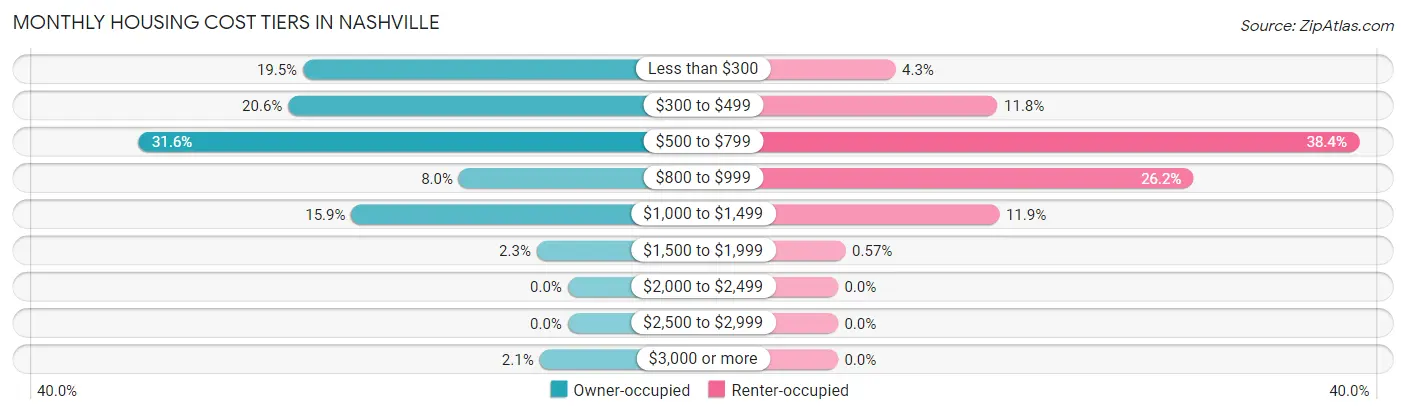
| Monthly Cost | Owner-occupied | Renter-occupied |
| Less than $300 | 197 (19.5%) | 30 (4.3%) |
| $300 to $499 | 208 (20.6%) | 83 (11.8%) |
| $500 to $799 | 319 (31.6%) | 271 (38.4%) |
| $800 to $999 | 81 (8.0%) | 185 (26.2%) |
| $1,000 to $1,499 | 161 (15.9%) | 84 (11.9%) |
| $1,500 to $1,999 | 23 (2.3%) | 4 (0.6%) |
| $2,000 to $2,499 | 0 (0.0%) | 0 (0.0%) |
| $2,500 to $2,999 | 0 (0.0%) | 0 (0.0%) |
| $3,000 or more | 21 (2.1%) | 0 (0.0%) |
| Total | 1,010 (100.0%) | 706 (100.0%) |
Physical Housing Characteristics in Nashville
Housing Structures in Nashville
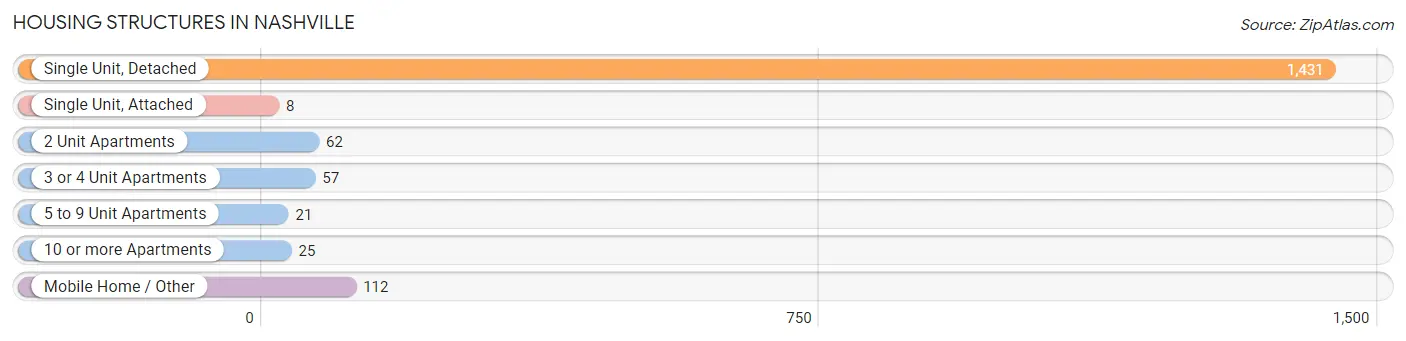
| Structure Type | # Housing Units | % Housing Units |
| Single Unit, Detached | 1,431 | 83.4% |
| Single Unit, Attached | 8 | 0.5% |
| 2 Unit Apartments | 62 | 3.6% |
| 3 or 4 Unit Apartments | 57 | 3.3% |
| 5 to 9 Unit Apartments | 21 | 1.2% |
| 10 or more Apartments | 25 | 1.5% |
| Mobile Home / Other | 112 | 6.5% |
| Total | 1,716 | 100.0% |
Housing Structures by Occupancy in Nashville
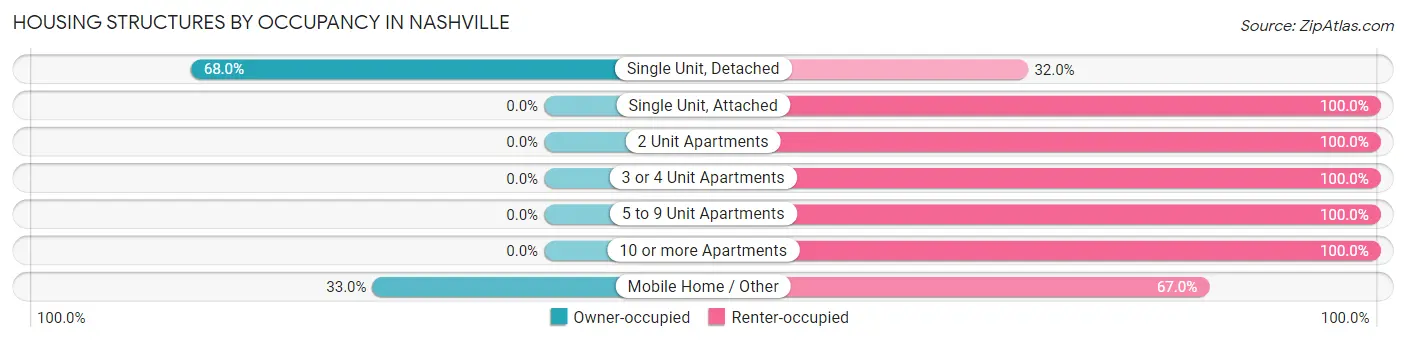
| Structure Type | Owner-occupied | Renter-occupied |
| Single Unit, Detached | 973 (68.0%) | 458 (32.0%) |
| Single Unit, Attached | 0 (0.0%) | 8 (100.0%) |
| 2 Unit Apartments | 0 (0.0%) | 62 (100.0%) |
| 3 or 4 Unit Apartments | 0 (0.0%) | 57 (100.0%) |
| 5 to 9 Unit Apartments | 0 (0.0%) | 21 (100.0%) |
| 10 or more Apartments | 0 (0.0%) | 25 (100.0%) |
| Mobile Home / Other | 37 (33.0%) | 75 (67.0%) |
| Total | 1,010 (58.9%) | 706 (41.1%) |
Housing Structures by Number of Rooms in Nashville
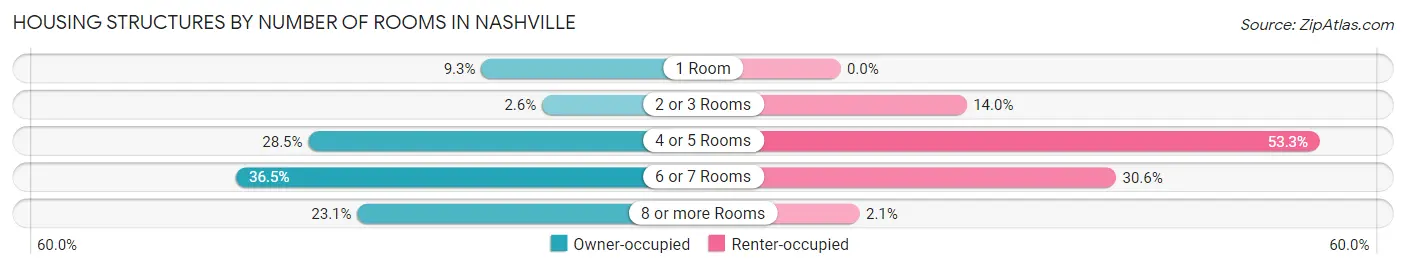
| Number of Rooms | Owner-occupied | Renter-occupied |
| 1 Room | 94 (9.3%) | 0 (0.0%) |
| 2 or 3 Rooms | 26 (2.6%) | 99 (14.0%) |
| 4 or 5 Rooms | 288 (28.5%) | 376 (53.3%) |
| 6 or 7 Rooms | 369 (36.5%) | 216 (30.6%) |
| 8 or more Rooms | 233 (23.1%) | 15 (2.1%) |
| Total | 1,010 (100.0%) | 706 (100.0%) |
Housing Structure by Heating Type in Nashville
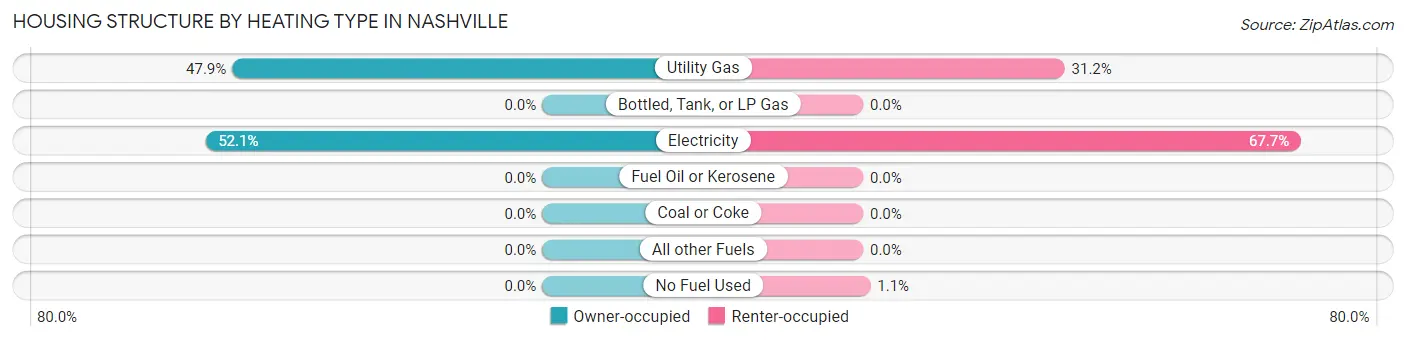
| Heating Type | Owner-occupied | Renter-occupied |
| Utility Gas | 484 (47.9%) | 220 (31.2%) |
| Bottled, Tank, or LP Gas | 0 (0.0%) | 0 (0.0%) |
| Electricity | 526 (52.1%) | 478 (67.7%) |
| Fuel Oil or Kerosene | 0 (0.0%) | 0 (0.0%) |
| Coal or Coke | 0 (0.0%) | 0 (0.0%) |
| All other Fuels | 0 (0.0%) | 0 (0.0%) |
| No Fuel Used | 0 (0.0%) | 8 (1.1%) |
| Total | 1,010 (100.0%) | 706 (100.0%) |
Household Vehicle Usage in Nashville
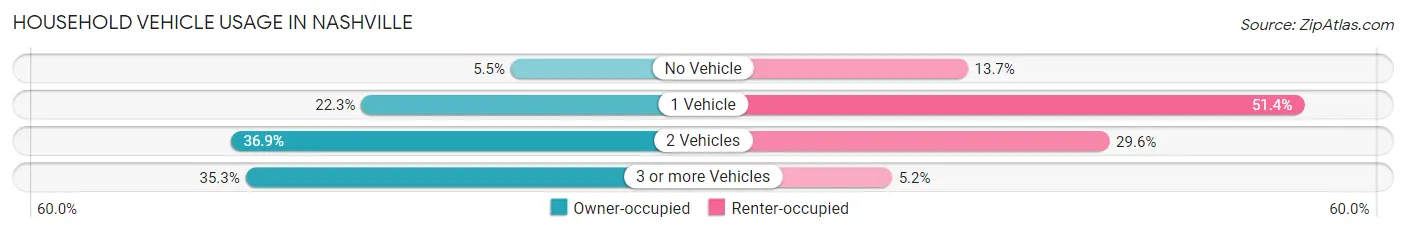
| Vehicles per Household | Owner-occupied | Renter-occupied |
| No Vehicle | 56 (5.5%) | 97 (13.7%) |
| 1 Vehicle | 225 (22.3%) | 363 (51.4%) |
| 2 Vehicles | 373 (36.9%) | 209 (29.6%) |
| 3 or more Vehicles | 356 (35.2%) | 37 (5.2%) |
| Total | 1,010 (100.0%) | 706 (100.0%) |
Real Estate & Mortgages in Nashville
Real Estate and Mortgage Overview in Nashville
| Characteristic | Without Mortgage | With Mortgage |
| Housing Units | 642 | 368 |
| Median Property Value | $122,500 | $136,000 |
| Median Household Income | $45,820 | $46 |
| Monthly Housing Costs | $381 | $21 |
| Real Estate Taxes | $635 | $32 |
Property Value by Mortgage Status in Nashville
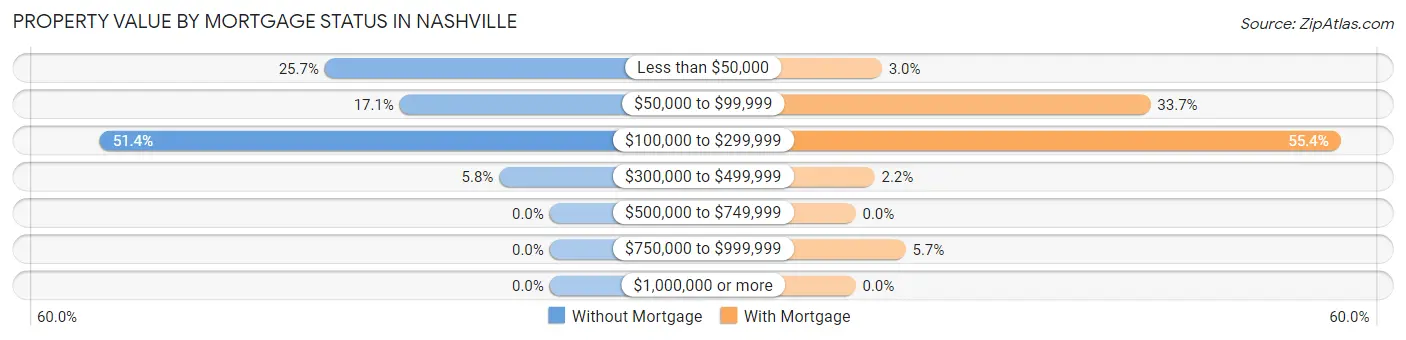
| Property Value | Without Mortgage | With Mortgage |
| Less than $50,000 | 165 (25.7%) | 11 (3.0%) |
| $50,000 to $99,999 | 110 (17.1%) | 124 (33.7%) |
| $100,000 to $299,999 | 330 (51.4%) | 204 (55.4%) |
| $300,000 to $499,999 | 37 (5.8%) | 8 (2.2%) |
| $500,000 to $749,999 | 0 (0.0%) | 0 (0.0%) |
| $750,000 to $999,999 | 0 (0.0%) | 21 (5.7%) |
| $1,000,000 or more | 0 (0.0%) | 0 (0.0%) |
| Total | 642 (100.0%) | 368 (100.0%) |
Household Income by Mortgage Status in Nashville
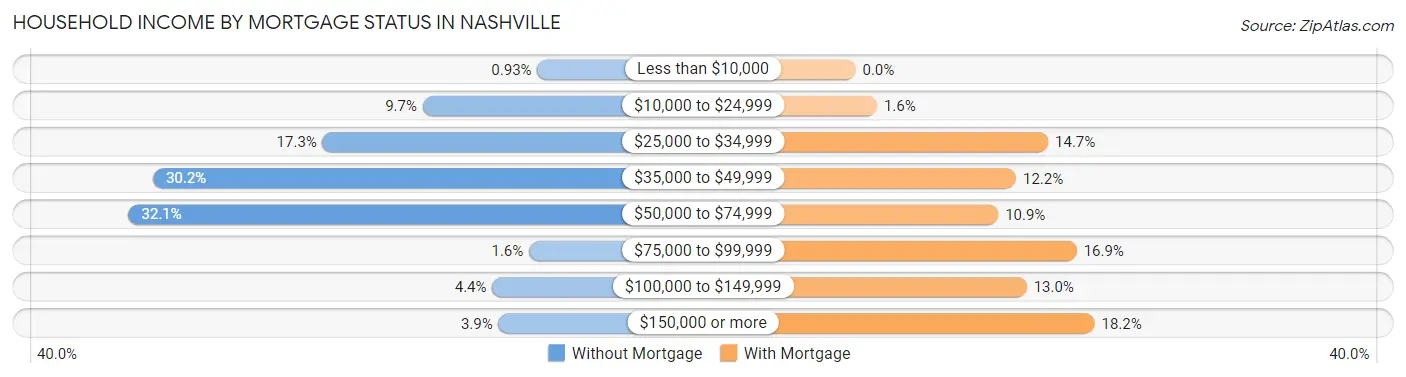
| Household Income | Without Mortgage | With Mortgage |
| Less than $10,000 | 6 (0.9%) | 0 (0.0%) |
| $10,000 to $24,999 | 62 (9.7%) | 6 (1.6%) |
| $25,000 to $34,999 | 111 (17.3%) | 54 (14.7%) |
| $35,000 to $49,999 | 194 (30.2%) | 45 (12.2%) |
| $50,000 to $74,999 | 206 (32.1%) | 40 (10.9%) |
| $75,000 to $99,999 | 10 (1.6%) | 62 (16.9%) |
| $100,000 to $149,999 | 28 (4.4%) | 48 (13.0%) |
| $150,000 or more | 25 (3.9%) | 67 (18.2%) |
| Total | 642 (100.0%) | 368 (100.0%) |
Property Value to Household Income Ratio in Nashville
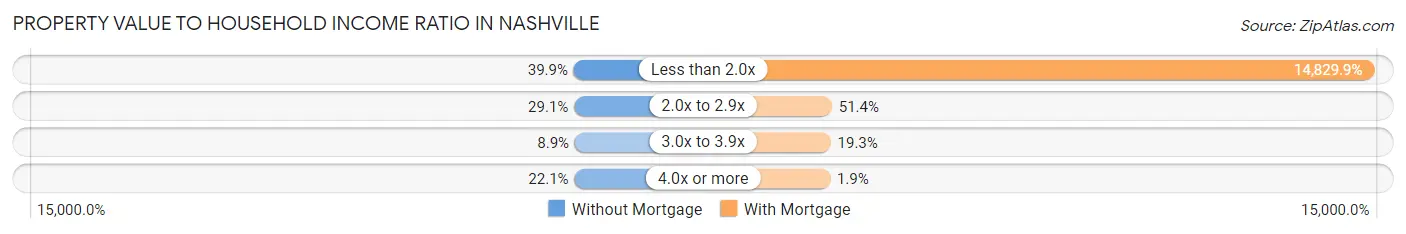
| Value-to-Income Ratio | Without Mortgage | With Mortgage |
| Less than 2.0x | 256 (39.9%) | 54,574 (14,829.9%) |
| 2.0x to 2.9x | 187 (29.1%) | 189 (51.4%) |
| 3.0x to 3.9x | 57 (8.9%) | 71 (19.3%) |
| 4.0x or more | 142 (22.1%) | 7 (1.9%) |
| Total | 642 (100.0%) | 368 (100.0%) |
Real Estate Taxes by Mortgage Status in Nashville
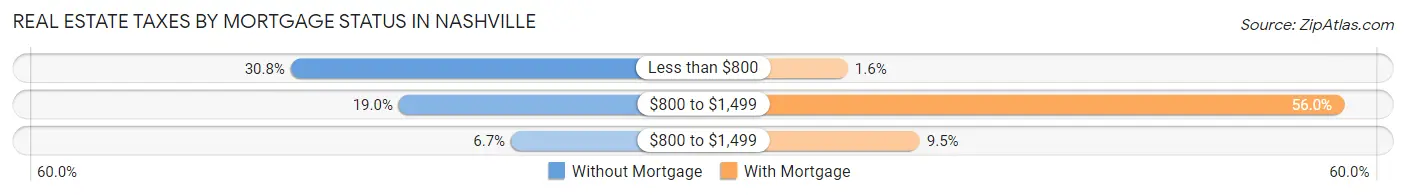
| Property Taxes | Without Mortgage | With Mortgage |
| Less than $800 | 198 (30.8%) | 6 (1.6%) |
| $800 to $1,499 | 122 (19.0%) | 206 (56.0%) |
| $800 to $1,499 | 43 (6.7%) | 35 (9.5%) |
| Total | 642 (100.0%) | 368 (100.0%) |
Health & Disability in Nashville
Health Insurance Coverage by Age in Nashville
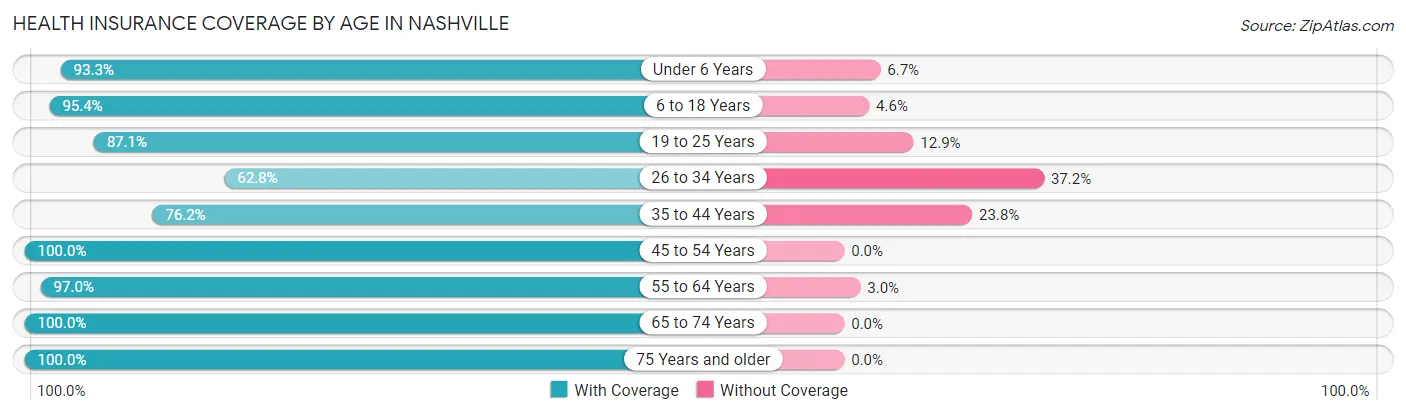
| Age Bracket | With Coverage | Without Coverage |
| Under 6 Years | 374 (93.3%) | 27 (6.7%) |
| 6 to 18 Years | 596 (95.4%) | 29 (4.6%) |
| 19 to 25 Years | 277 (87.1%) | 41 (12.9%) |
| 26 to 34 Years | 268 (62.8%) | 159 (37.2%) |
| 35 to 44 Years | 540 (76.2%) | 169 (23.8%) |
| 45 to 54 Years | 305 (100.0%) | 0 (0.0%) |
| 55 to 64 Years | 550 (97.0%) | 17 (3.0%) |
| 65 to 74 Years | 447 (100.0%) | 0 (0.0%) |
| 75 Years and older | 289 (100.0%) | 0 (0.0%) |
| Total | 3,646 (89.2%) | 442 (10.8%) |
Health Insurance Coverage by Citizenship Status in Nashville
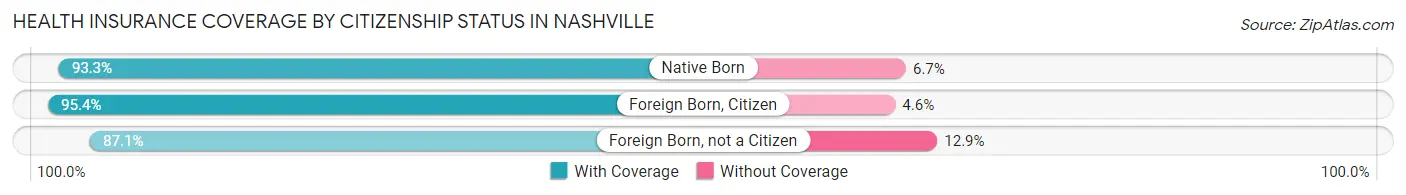
| Citizenship Status | With Coverage | Without Coverage |
| Native Born | 374 (93.3%) | 27 (6.7%) |
| Foreign Born, Citizen | 596 (95.4%) | 29 (4.6%) |
| Foreign Born, not a Citizen | 277 (87.1%) | 41 (12.9%) |
Health Insurance Coverage by Household Income in Nashville
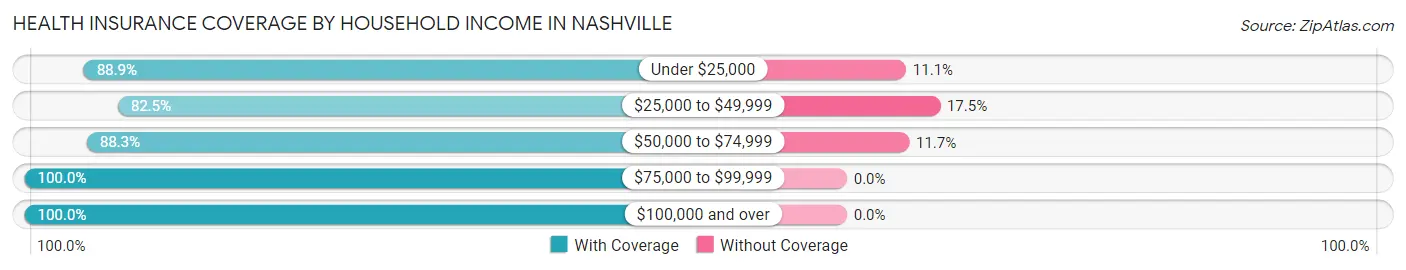
| Household Income | With Coverage | Without Coverage |
| Under $25,000 | 602 (88.9%) | 75 (11.1%) |
| $25,000 to $49,999 | 1,201 (82.5%) | 254 (17.5%) |
| $50,000 to $74,999 | 856 (88.3%) | 113 (11.7%) |
| $75,000 to $99,999 | 268 (100.0%) | 0 (0.0%) |
| $100,000 and over | 709 (100.0%) | 0 (0.0%) |
Public vs Private Health Insurance Coverage by Age in Nashville
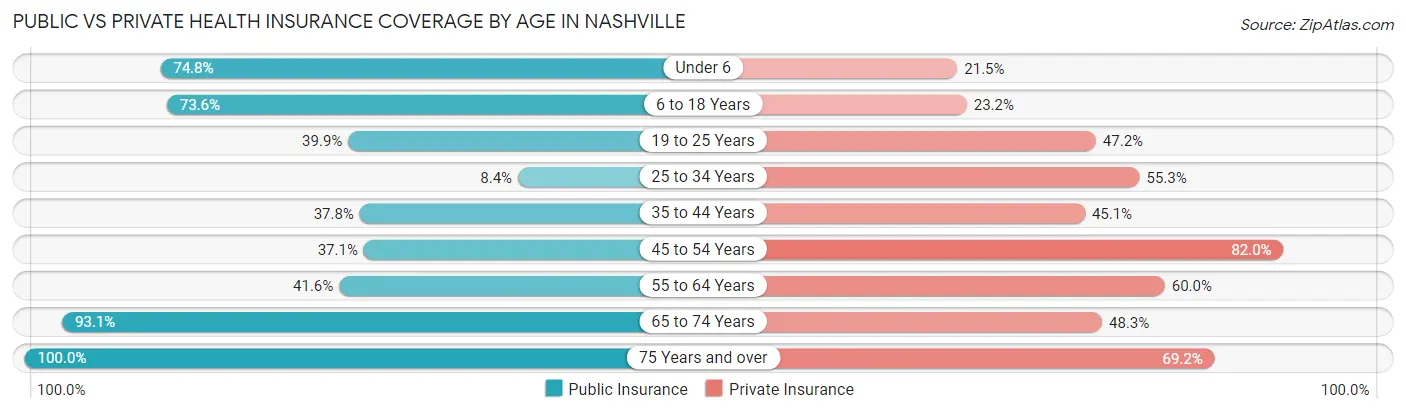
| Age Bracket | Public Insurance | Private Insurance |
| Under 6 | 300 (74.8%) | 86 (21.4%) |
| 6 to 18 Years | 460 (73.6%) | 145 (23.2%) |
| 19 to 25 Years | 127 (39.9%) | 150 (47.2%) |
| 25 to 34 Years | 36 (8.4%) | 236 (55.3%) |
| 35 to 44 Years | 268 (37.8%) | 320 (45.1%) |
| 45 to 54 Years | 113 (37.0%) | 250 (82.0%) |
| 55 to 64 Years | 236 (41.6%) | 340 (60.0%) |
| 65 to 74 Years | 416 (93.1%) | 216 (48.3%) |
| 75 Years and over | 289 (100.0%) | 200 (69.2%) |
| Total | 2,245 (54.9%) | 1,943 (47.5%) |
Disability Status by Sex by Age in Nashville
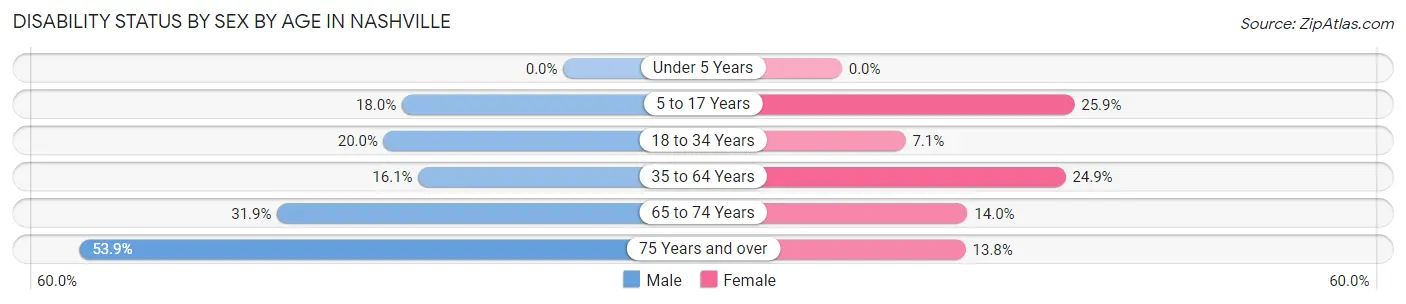
| Age Bracket | Male | Female |
| Under 5 Years | 0 (0.0%) | 0 (0.0%) |
| 5 to 17 Years | 46 (18.0%) | 87 (25.9%) |
| 18 to 34 Years | 78 (20.0%) | 30 (7.1%) |
| 35 to 64 Years | 123 (16.1%) | 204 (24.9%) |
| 65 to 74 Years | 65 (31.9%) | 34 (14.0%) |
| 75 Years and over | 62 (53.9%) | 24 (13.8%) |
Disability Class by Sex by Age in Nashville
Disability Class: Hearing Difficulty
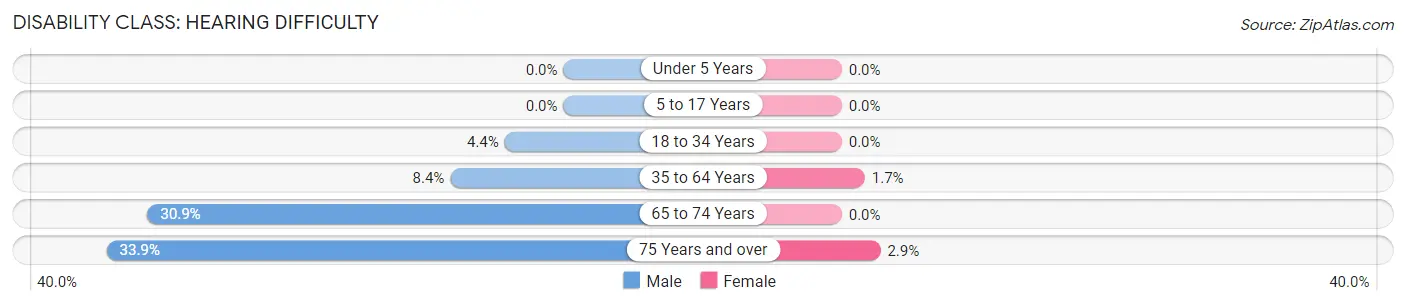
| Age Bracket | Male | Female |
| Under 5 Years | 0 (0.0%) | 0 (0.0%) |
| 5 to 17 Years | 0 (0.0%) | 0 (0.0%) |
| 18 to 34 Years | 17 (4.4%) | 0 (0.0%) |
| 35 to 64 Years | 64 (8.4%) | 14 (1.7%) |
| 65 to 74 Years | 63 (30.9%) | 0 (0.0%) |
| 75 Years and over | 39 (33.9%) | 5 (2.9%) |
Disability Class: Vision Difficulty
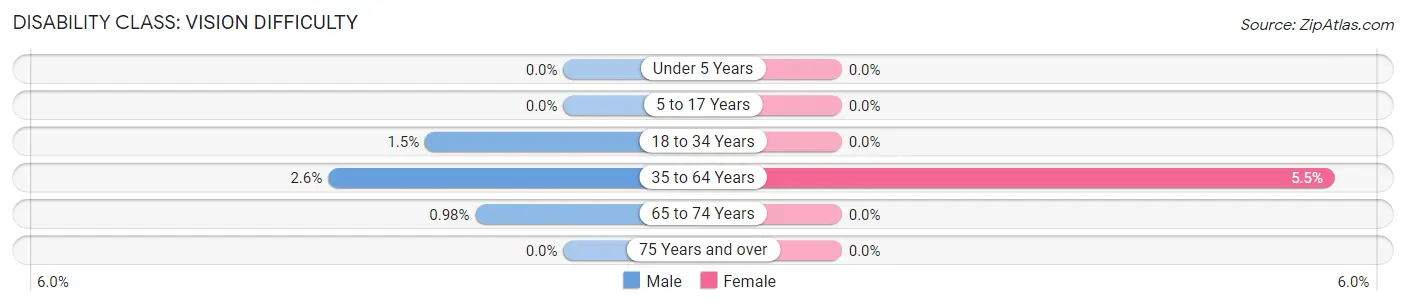
| Age Bracket | Male | Female |
| Under 5 Years | 0 (0.0%) | 0 (0.0%) |
| 5 to 17 Years | 0 (0.0%) | 0 (0.0%) |
| 18 to 34 Years | 6 (1.5%) | 0 (0.0%) |
| 35 to 64 Years | 20 (2.6%) | 45 (5.5%) |
| 65 to 74 Years | 2 (1.0%) | 0 (0.0%) |
| 75 Years and over | 0 (0.0%) | 0 (0.0%) |
Disability Class: Cognitive Difficulty
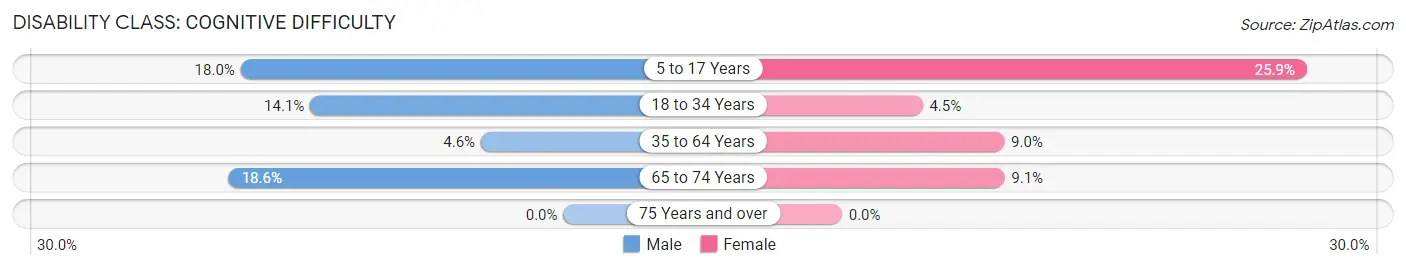
| Age Bracket | Male | Female |
| 5 to 17 Years | 46 (18.0%) | 87 (25.9%) |
| 18 to 34 Years | 55 (14.1%) | 19 (4.5%) |
| 35 to 64 Years | 35 (4.6%) | 74 (9.0%) |
| 65 to 74 Years | 38 (18.6%) | 22 (9.0%) |
| 75 Years and over | 0 (0.0%) | 0 (0.0%) |
Disability Class: Ambulatory Difficulty
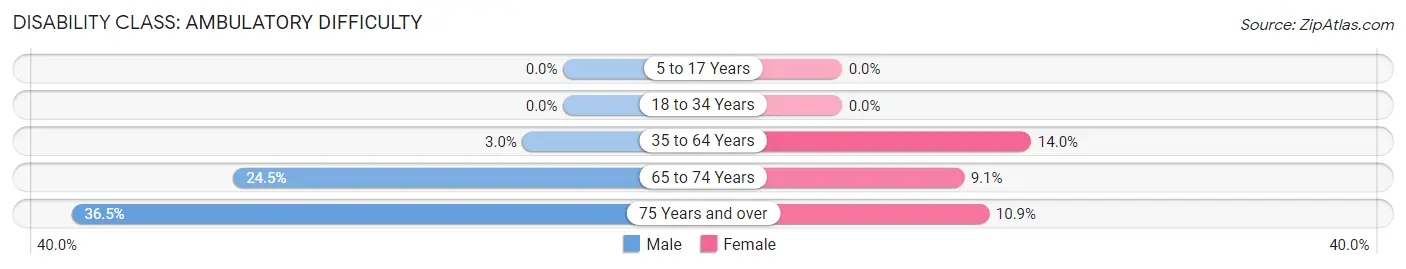
| Age Bracket | Male | Female |
| 5 to 17 Years | 0 (0.0%) | 0 (0.0%) |
| 18 to 34 Years | 0 (0.0%) | 0 (0.0%) |
| 35 to 64 Years | 23 (3.0%) | 115 (14.0%) |
| 65 to 74 Years | 50 (24.5%) | 22 (9.0%) |
| 75 Years and over | 42 (36.5%) | 19 (10.9%) |
Disability Class: Self-Care Difficulty
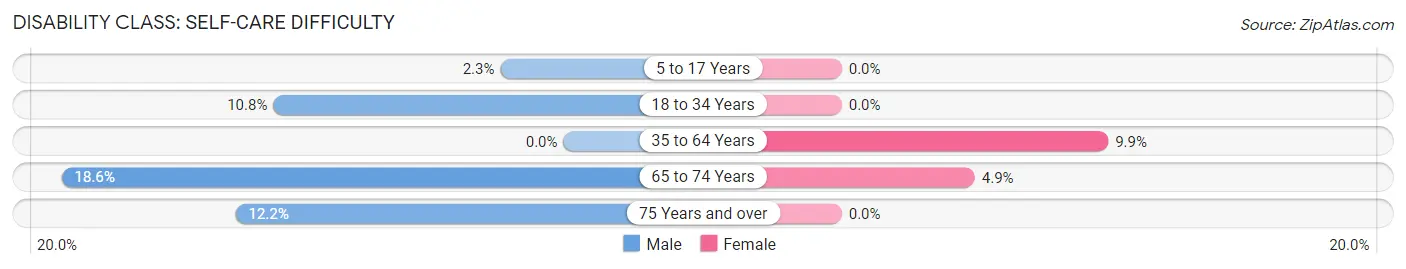
| Age Bracket | Male | Female |
| 5 to 17 Years | 6 (2.3%) | 0 (0.0%) |
| 18 to 34 Years | 42 (10.8%) | 0 (0.0%) |
| 35 to 64 Years | 0 (0.0%) | 81 (9.9%) |
| 65 to 74 Years | 38 (18.6%) | 12 (4.9%) |
| 75 Years and over | 14 (12.2%) | 0 (0.0%) |
Technology Access in Nashville
Computing Device Access in Nashville
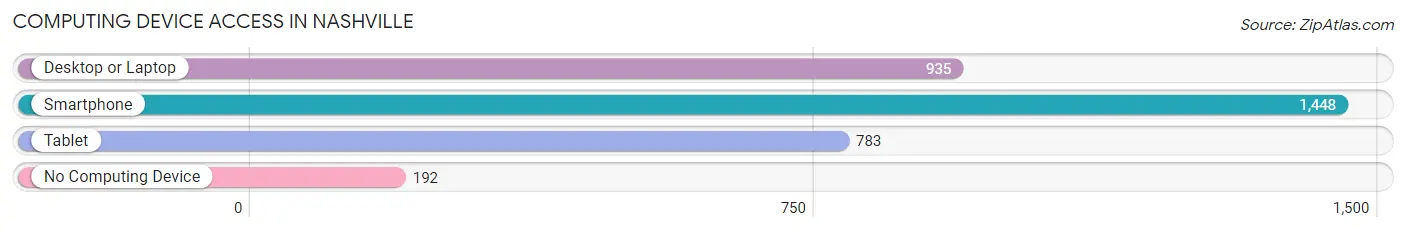
| Device Type | # Households | % Households |
| Desktop or Laptop | 935 | 54.5% |
| Smartphone | 1,448 | 84.4% |
| Tablet | 783 | 45.6% |
| No Computing Device | 192 | 11.2% |
| Total | 1,716 | 100.0% |
Internet Access in Nashville
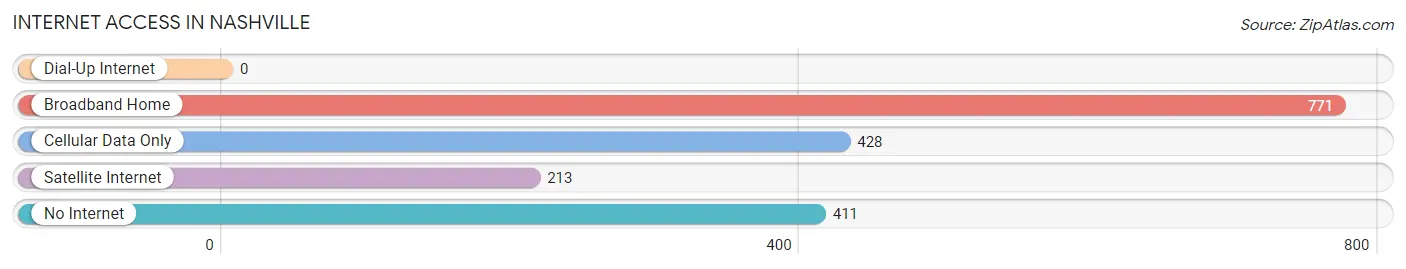
| Internet Type | # Households | % Households |
| Dial-Up Internet | 0 | 0.0% |
| Broadband Home | 771 | 44.9% |
| Cellular Data Only | 428 | 24.9% |
| Satellite Internet | 213 | 12.4% |
| No Internet | 411 | 23.9% |
| Total | 1,716 | 100.0% |
Nashville Summary
Nashville, Arkansas is a city located in Howard County in the southwestern part of the state. It is the county seat and the largest city in the county. Nashville is located in the Ouachita Mountains and is part of the Texarkana metropolitan area. The city has a population of 5,737 as of the 2010 census.
History
Nashville was founded in 1837 and named after Francis Nash, a Revolutionary War hero. The city was incorporated in 1875 and was the first county seat of Howard County. Nashville was a major center of the timber industry in the late 19th and early 20th centuries. The city was also a major railroad hub, with the St. Louis, Iron Mountain and Southern Railway running through the city.
Geography
Nashville is located in the Ouachita Mountains in southwestern Arkansas. The city is situated at the intersection of U.S. Route 278 and Arkansas Highway 27. Nashville is located about 30 miles south of Texarkana and about 90 miles southwest of Little Rock. The city has a total area of 4.3 square miles, all of which is land.
Economy
Nashville’s economy is largely based on agriculture and timber. The city is home to several large poultry processing plants, as well as a number of smaller businesses. The city is also home to a number of manufacturing companies, including a furniture factory and a paper mill.
Demographics
As of the 2010 census, there were 5,737 people, 2,310 households, and 1,541 families residing in the city. The population density was 1,334.2 people per square mile. The racial makeup of the city was 79.2% White, 17.3% African American, 0.4% Native American, 0.3% Asian, 0.1% Pacific Islander, 1.2% from other races, and 1.5% from two or more races. Hispanic or Latino of any race were 2.7% of the population.
The median income for a household in the city was $30,938, and the median income for a family was $37,813. Males had a median income of $30,938 versus $20,972 for females. The per capita income for the city was $15,945. About 16.2% of families and 19.2% of the population were below the poverty line, including 28.2% of those under age 18 and 14.2% of those age 65 or over.
Nashville is a small city with a rich history and a diverse economy. The city is home to a number of businesses, including poultry processing plants, furniture factories, and paper mills. The city has a population of 5,737 as of the 2010 census, and the median income for a household is $30,938. Nashville is a great place to live and work, and it is a great place to visit.
Common Questions
What is Per Capita Income in Nashville?
Per Capita income in Nashville is $21,543.
What is the Median Family Income in Nashville?
Median Family Income in Nashville is $49,455.
What is the Median Household income in Nashville?
Median Household Income in Nashville is $39,836.
What is Income or Wage Gap in Nashville?
Income or Wage Gap in Nashville is 14.4%.
Women in Nashville earn 85.6 cents for every dollar earned by a man.
What is Inequality or Gini Index in Nashville?
Inequality or Gini Index in Nashville is 0.39.
What is the Total Population of Nashville?
Total Population of Nashville is 4,156.
What is the Total Male Population of Nashville?
Total Male Population of Nashville is 1,960.
What is the Total Female Population of Nashville?
Total Female Population of Nashville is 2,196.
What is the Ratio of Males per 100 Females in Nashville?
There are 89.25 Males per 100 Females in Nashville.
What is the Ratio of Females per 100 Males in Nashville?
There are 112.04 Females per 100 Males in Nashville.
What is the Median Population Age in Nashville?
Median Population Age in Nashville is 39.1 Years.
What is the Average Family Size in Nashville
Average Family Size in Nashville is 3.0 People.
What is the Average Household Size in Nashville
Average Household Size in Nashville is 2.4 People.
How Large is the Labor Force in Nashville?
There are 2,031 People in the Labor Forcein in Nashville.
What is the Percentage of People in the Labor Force in Nashville?
60.9% of People are in the Labor Force in Nashville.
What is the Unemployment Rate in Nashville?
Unemployment Rate in Nashville is 10.0%.