Tollette, AR Map & Demographics
Tollette Map
Tollette Overview
$22,267
PER CAPITA INCOME
$63,295
AVG FAMILY INCOME
$40,500
AVG HOUSEHOLD INCOME
0.30
INEQUALITY / GINI INDEX
164
TOTAL POPULATION
79
MALE POPULATION
85
FEMALE POPULATION
92.94
MALES / 100 FEMALES
107.59
FEMALES / 100 MALES
62.1
MEDIAN AGE
2.2
AVG FAMILY SIZE
1.8
AVG HOUSEHOLD SIZE
67
LABOR FORCE [ PEOPLE ]
45.6%
PERCENT IN LABOR FORCE
20.9%
UNEMPLOYMENT RATE
Income in Tollette
Income Overview in Tollette
Per Capita Income in Tollette is $22,267, while median incomes of families and households are $63,295 and $40,500 respectively.
| Characteristic | Number | Measure |
| Per Capita Income | 164 | $22,267 |
| Median Family Income | 55 | $63,295 |
| Mean Family Income | 55 | $51,713 |
| Median Household Income | 90 | $40,500 |
| Mean Household Income | 90 | $42,560 |
| Income Deficit | 55 | $0 |
| Wage / Income Gap (%) | 164 | 0.00% |
| Wage / Income Gap ($) | 164 | 100.00¢ per $1 |
| Gini / Inequality Index | 164 | 0.30 |
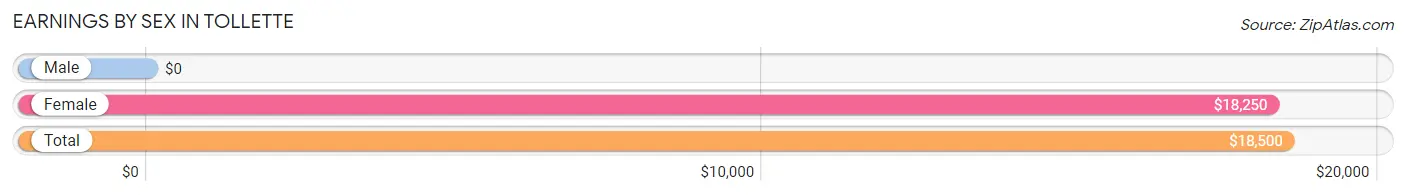
Earnings by Sex in Tollette
| Sex | Number | Average Earnings |
| Male | 25 (35.7%) | $0 |
| Female | 45 (64.3%) | $18,250 |
| Total | 70 (100.0%) | $18,500 |
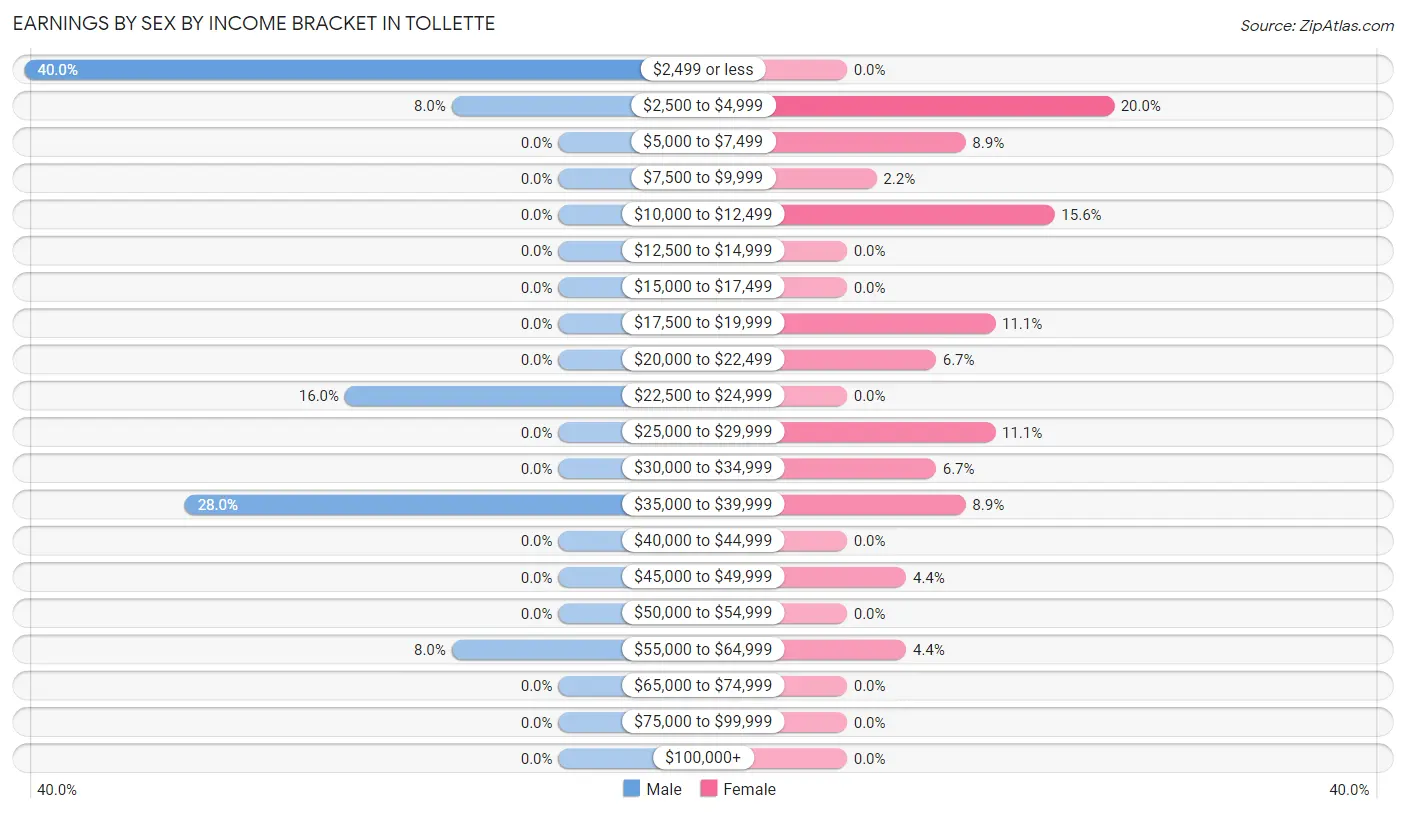
Earnings by Sex by Income Bracket in Tollette
The most common earnings brackets in Tollette are $2,499 or less for men (10 | 40.0%) and $2,500 to $4,999 for women (9 | 20.0%).
| Income | Male | Female |
| $2,499 or less | 10 (40.0%) | 0 (0.0%) |
| $2,500 to $4,999 | 2 (8.0%) | 9 (20.0%) |
| $5,000 to $7,499 | 0 (0.0%) | 4 (8.9%) |
| $7,500 to $9,999 | 0 (0.0%) | 1 (2.2%) |
| $10,000 to $12,499 | 0 (0.0%) | 7 (15.6%) |
| $12,500 to $14,999 | 0 (0.0%) | 0 (0.0%) |
| $15,000 to $17,499 | 0 (0.0%) | 0 (0.0%) |
| $17,500 to $19,999 | 0 (0.0%) | 5 (11.1%) |
| $20,000 to $22,499 | 0 (0.0%) | 3 (6.7%) |
| $22,500 to $24,999 | 4 (16.0%) | 0 (0.0%) |
| $25,000 to $29,999 | 0 (0.0%) | 5 (11.1%) |
| $30,000 to $34,999 | 0 (0.0%) | 3 (6.7%) |
| $35,000 to $39,999 | 7 (28.0%) | 4 (8.9%) |
| $40,000 to $44,999 | 0 (0.0%) | 0 (0.0%) |
| $45,000 to $49,999 | 0 (0.0%) | 2 (4.4%) |
| $50,000 to $54,999 | 0 (0.0%) | 0 (0.0%) |
| $55,000 to $64,999 | 2 (8.0%) | 2 (4.4%) |
| $65,000 to $74,999 | 0 (0.0%) | 0 (0.0%) |
| $75,000 to $99,999 | 0 (0.0%) | 0 (0.0%) |
| $100,000+ | 0 (0.0%) | 0 (0.0%) |
| Total | 25 (100.0%) | 45 (100.0%) |
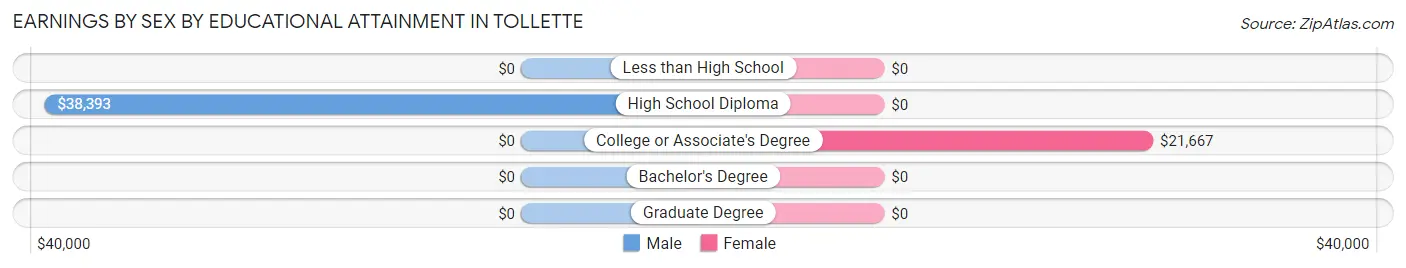
Earnings by Sex by Educational Attainment in Tollette
Average earnings in Tollette are $38,036 for men and $20,000 for women, a difference of 47.4%. Men with an educational attainment of high school diploma enjoy the highest average annual earnings of $38,393, while those with high school diploma education earn the least with $38,393. Women with an educational attainment of college or associate's degree earn the most with the average annual earnings of $21,667, while those with college or associate's degree education have the smallest earnings of $21,667.
| Educational Attainment | Male Income | Female Income |
| Less than High School | - | - |
| High School Diploma | $38,393 | $0 |
| College or Associate's Degree | - | - |
| Bachelor's Degree | - | - |
| Graduate Degree | - | - |
| Total | $38,036 | $20,000 |
Family Income in Tollette
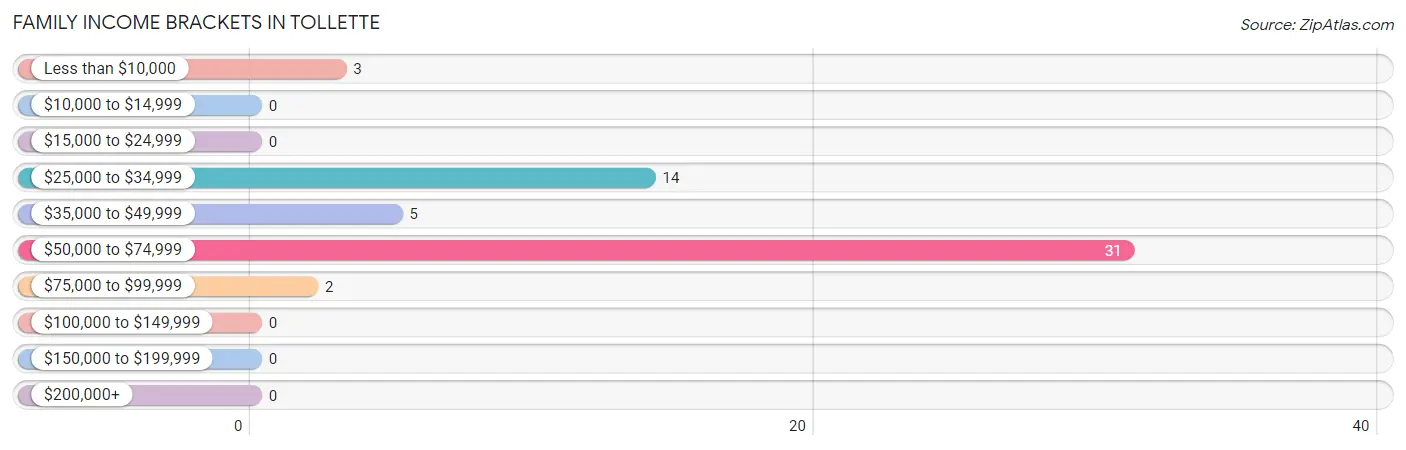
Family Income Brackets in Tollette
According to the Tollette family income data, there are 31 families falling into the $50,000 to $74,999 income range, which is the most common income bracket and makes up 56.4% of all families.
| Income Bracket | # Families | % Families |
| Less than $10,000 | 3 | 5.5% |
| $10,000 to $14,999 | 0 | 0.0% |
| $15,000 to $24,999 | 0 | 0.0% |
| $25,000 to $34,999 | 14 | 25.5% |
| $35,000 to $49,999 | 5 | 9.1% |
| $50,000 to $74,999 | 31 | 56.4% |
| $75,000 to $99,999 | 2 | 3.6% |
| $100,000 to $149,999 | 0 | 0.0% |
| $150,000 to $199,999 | 0 | 0.0% |
| $200,000+ | 0 | 0.0% |
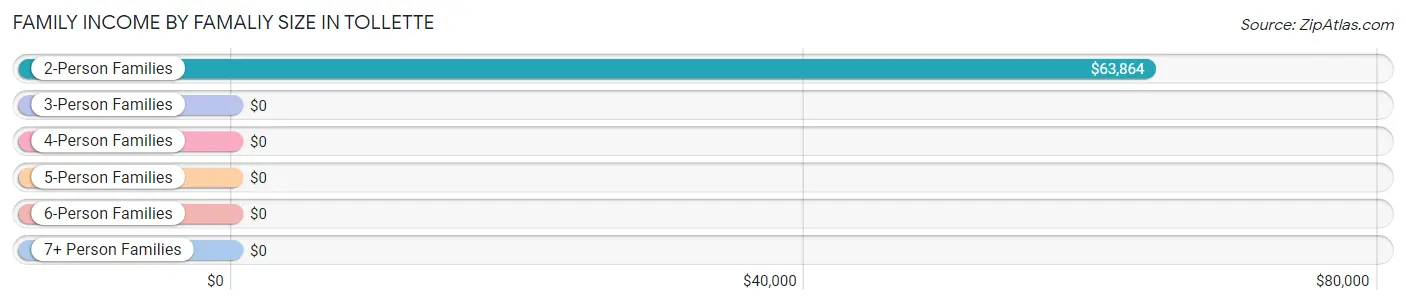
Family Income by Famaliy Size in Tollette
2-person families (40 | 72.7%) account for the highest median family income in Tollette with $63,864 per family, while 2-person families (40 | 72.7%) have the highest median income of $31,932 per family member.
| Income Bracket | # Families | Median Income |
| 2-Person Families | 40 (72.7%) | $63,864 |
| 3-Person Families | 12 (21.8%) | $0 |
| 4-Person Families | 1 (1.8%) | $0 |
| 5-Person Families | 2 (3.6%) | $0 |
| 6-Person Families | 0 (0.0%) | $0 |
| 7+ Person Families | 0 (0.0%) | $0 |
| Total | 55 (100.0%) | $63,295 |
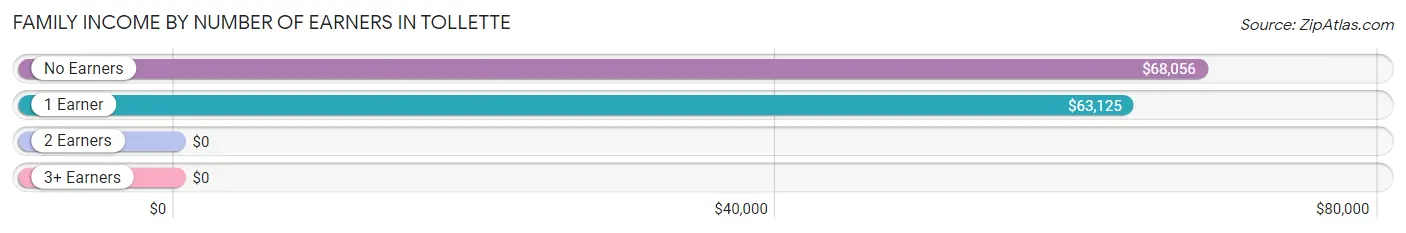
Family Income by Number of Earners in Tollette
| Number of Earners | # Families | Median Income |
| No Earners | 18 (32.7%) | $68,056 |
| 1 Earner | 17 (30.9%) | $63,125 |
| 2 Earners | 20 (36.4%) | $0 |
| 3+ Earners | 0 (0.0%) | $0 |
| Total | 55 (100.0%) | $63,295 |
Household Income in Tollette
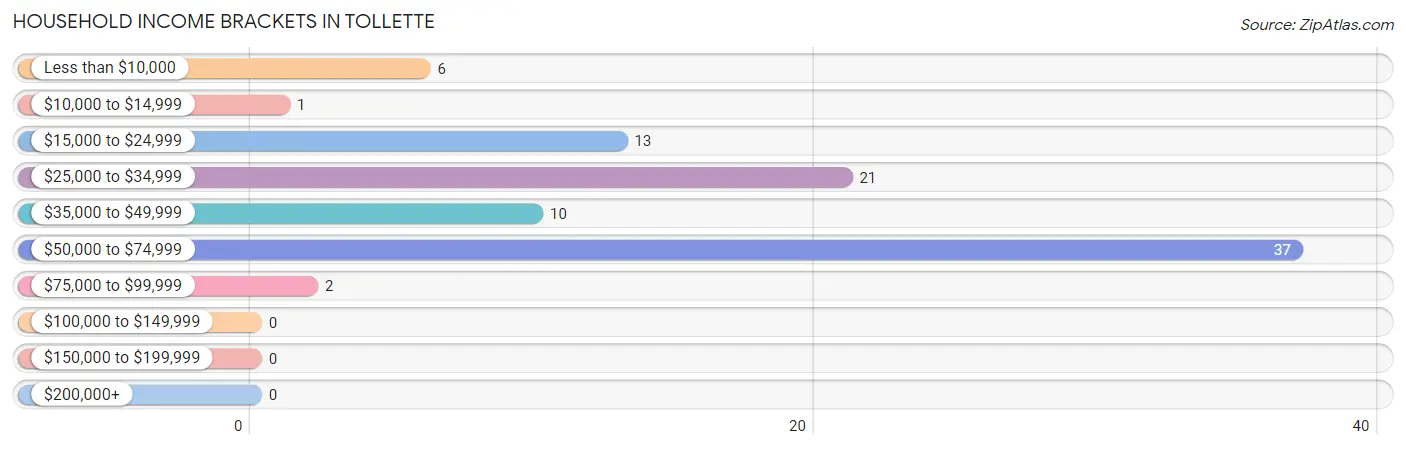
Household Income Brackets in Tollette
With 37 households falling in the category, the $50,000 to $74,999 income range is the most frequent in Tollette, accounting for 41.1% of all households.
| Income Bracket | # Households | % Households |
| Less than $10,000 | 6 | 6.7% |
| $10,000 to $14,999 | 1 | 1.1% |
| $15,000 to $24,999 | 13 | 14.4% |
| $25,000 to $34,999 | 21 | 23.3% |
| $35,000 to $49,999 | 10 | 11.1% |
| $50,000 to $74,999 | 37 | 41.1% |
| $75,000 to $99,999 | 2 | 2.2% |
| $100,000 to $149,999 | 0 | 0.0% |
| $150,000 to $199,999 | 0 | 0.0% |
| $200,000+ | 0 | 0.0% |
Household Income by Householder Age in Tollette
The median household income in Tollette is $40,500, with the highest median household income of $54,063 found in the 25 to 44 years age bracket for the primary householder. A total of 7 households (7.8%) fall into this category.
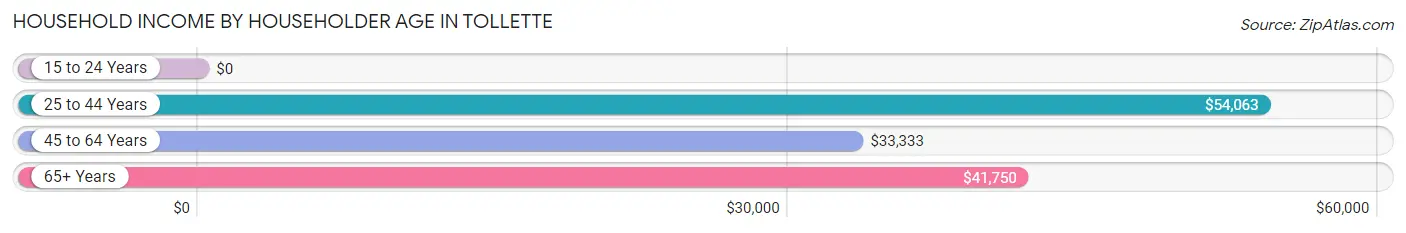
| Income Bracket | # Households | Median Income |
| 15 to 24 Years | 0 (0.0%) | $0 |
| 25 to 44 Years | 7 (7.8%) | $54,063 |
| 45 to 64 Years | 32 (35.6%) | $33,333 |
| 65+ Years | 51 (56.7%) | $41,750 |
| Total | 90 (100.0%) | $40,500 |
Poverty in Tollette
Income Below Poverty by Sex and Age in Tollette
With 10.1% poverty level for males and 11.8% for females among the residents of Tollette, 12 to 14 year old males and 6 to 11 year old females are the most vulnerable to poverty, with 2 males (50.0%) and 1 females (100.0%) in their respective age groups living below the poverty level.
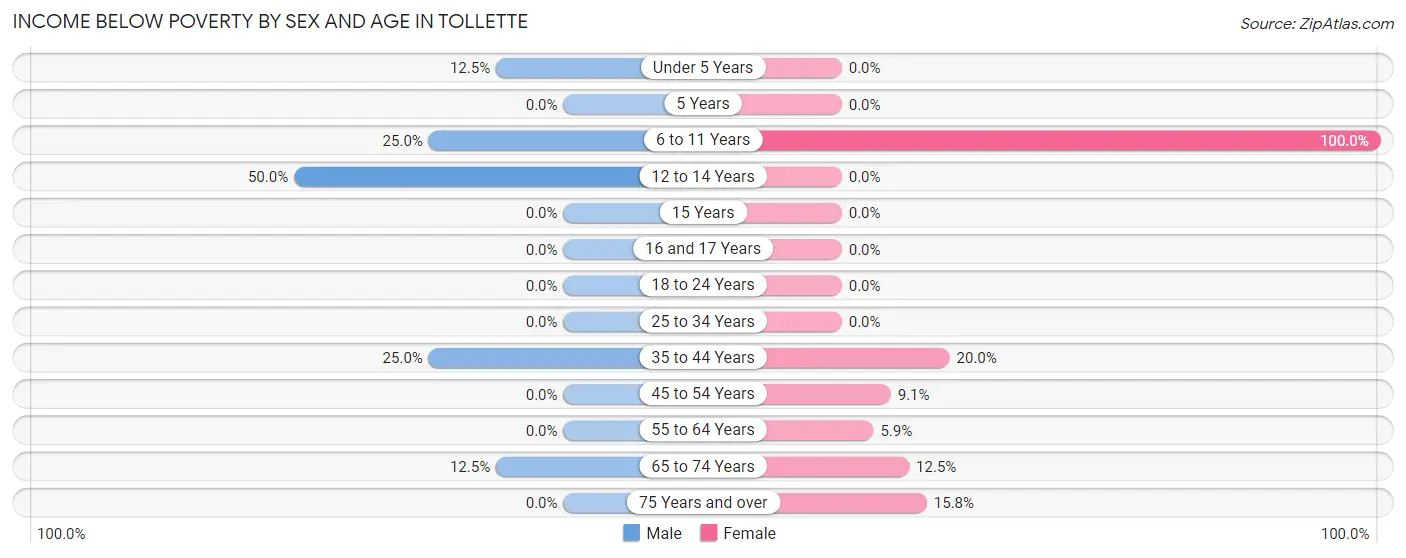
| Age Bracket | Male | Female |
| Under 5 Years | 1 (12.5%) | 0 (0.0%) |
| 5 Years | 0 (0.0%) | 0 (0.0%) |
| 6 to 11 Years | 1 (25.0%) | 1 (100.0%) |
| 12 to 14 Years | 2 (50.0%) | 0 (0.0%) |
| 15 Years | 0 (0.0%) | 0 (0.0%) |
| 16 and 17 Years | 0 (0.0%) | 0 (0.0%) |
| 18 to 24 Years | 0 (0.0%) | 0 (0.0%) |
| 25 to 34 Years | 0 (0.0%) | 0 (0.0%) |
| 35 to 44 Years | 2 (25.0%) | 1 (20.0%) |
| 45 to 54 Years | 0 (0.0%) | 1 (9.1%) |
| 55 to 64 Years | 0 (0.0%) | 1 (5.9%) |
| 65 to 74 Years | 2 (12.5%) | 3 (12.5%) |
| 75 Years and over | 0 (0.0%) | 3 (15.8%) |
| Total | 8 (10.1%) | 10 (11.8%) |
Income Above Poverty by Sex and Age in Tollette
According to the poverty statistics in Tollette, males aged 18 to 24 years and females aged 16 and 17 years are the age groups that are most secure financially, with 100.0% of males and 100.0% of females in these age groups living above the poverty line.
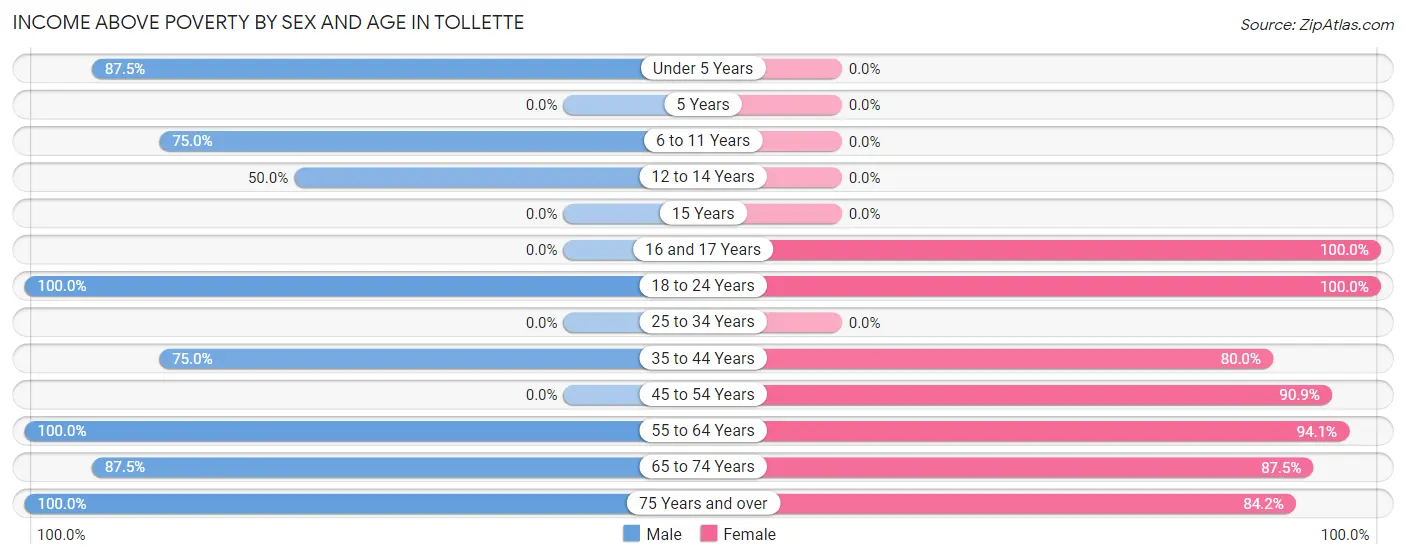
| Age Bracket | Male | Female |
| Under 5 Years | 7 (87.5%) | 0 (0.0%) |
| 5 Years | 0 (0.0%) | 0 (0.0%) |
| 6 to 11 Years | 3 (75.0%) | 0 (0.0%) |
| 12 to 14 Years | 2 (50.0%) | 0 (0.0%) |
| 15 Years | 0 (0.0%) | 0 (0.0%) |
| 16 and 17 Years | 0 (0.0%) | 7 (100.0%) |
| 18 to 24 Years | 10 (100.0%) | 1 (100.0%) |
| 25 to 34 Years | 0 (0.0%) | 0 (0.0%) |
| 35 to 44 Years | 6 (75.0%) | 4 (80.0%) |
| 45 to 54 Years | 0 (0.0%) | 10 (90.9%) |
| 55 to 64 Years | 21 (100.0%) | 16 (94.1%) |
| 65 to 74 Years | 14 (87.5%) | 21 (87.5%) |
| 75 Years and over | 8 (100.0%) | 16 (84.2%) |
| Total | 71 (89.9%) | 75 (88.2%) |
Income Below Poverty Among Married-Couple Families in Tollette
The poverty statistics for married-couple families in Tollette show that 7.1% or 2 of the total 28 families live below the poverty line. Families with no children have the highest poverty rate of 7.1%, comprising of 2 families. On the other hand, families with no children have the lowest poverty rate of 7.1%, which includes 2 families.
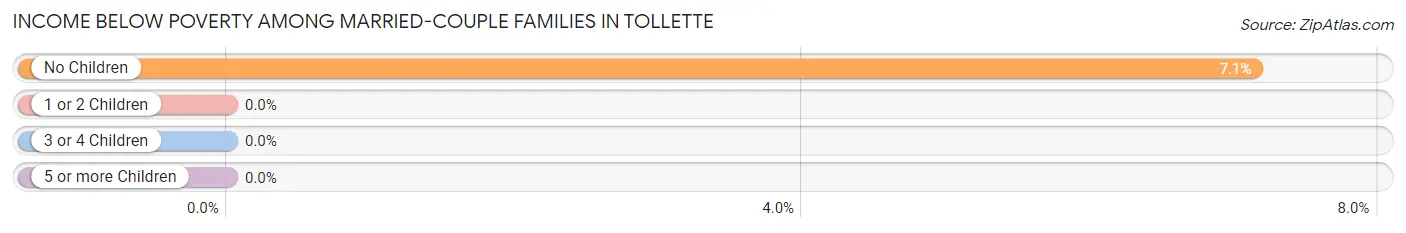
| Children | Above Poverty | Below Poverty |
| No Children | 26 (92.9%) | 2 (7.1%) |
| 1 or 2 Children | 0 (0.0%) | 0 (0.0%) |
| 3 or 4 Children | 0 (0.0%) | 0 (0.0%) |
| 5 or more Children | 0 (0.0%) | 0 (0.0%) |
| Total | 26 (92.9%) | 2 (7.1%) |
Income Below Poverty Among Single-Parent Households in Tollette
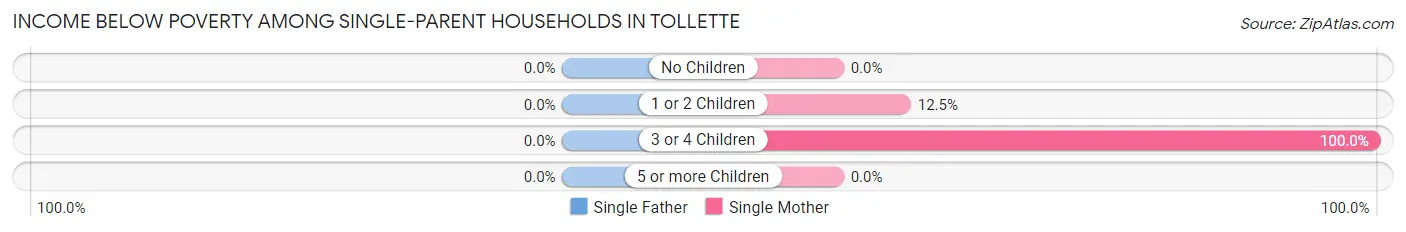
| Children | Single Father | Single Mother |
| No Children | 0 (0.0%) | 0 (0.0%) |
| 1 or 2 Children | 0 (0.0%) | 2 (12.5%) |
| 3 or 4 Children | 0 (0.0%) | 1 (100.0%) |
| 5 or more Children | 0 (0.0%) | 0 (0.0%) |
| Total | 0 (0.0%) | 3 (12.0%) |
Income Below Poverty Among Married-Couple vs Single-Parent Households in Tollette
The poverty data for Tollette shows that 2 of the married-couple family households (7.1%) and 3 of the single-parent households (11.1%) are living below the poverty level. Within the married-couple family households, those with no children have the highest poverty rate, with 2 households (7.1%) falling below the poverty line. Among the single-parent households, those with 3 or 4 children have the highest poverty rate, with 1 household (100.0%) living below poverty.
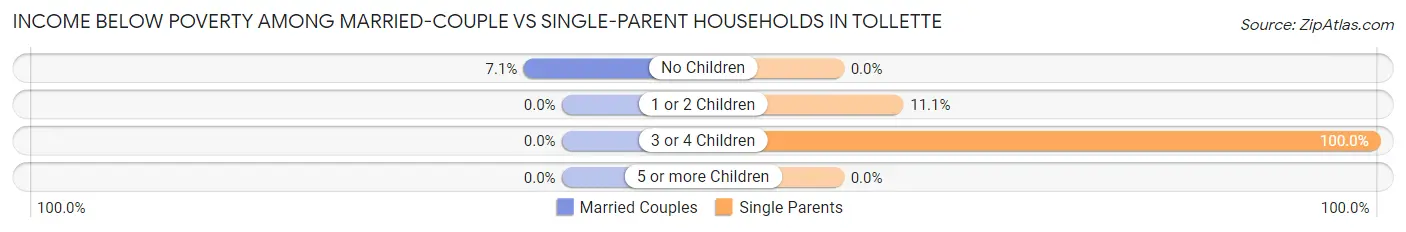
| Children | Married-Couple Families | Single-Parent Households |
| No Children | 2 (7.1%) | 0 (0.0%) |
| 1 or 2 Children | 0 (0.0%) | 2 (11.1%) |
| 3 or 4 Children | 0 (0.0%) | 1 (100.0%) |
| 5 or more Children | 0 (0.0%) | 0 (0.0%) |
| Total | 2 (7.1%) | 3 (11.1%) |
Race in Tollette
The most populous races in Tollette are Black / African American (148 | 90.2%), and White / Caucasian (16 | 9.8%).
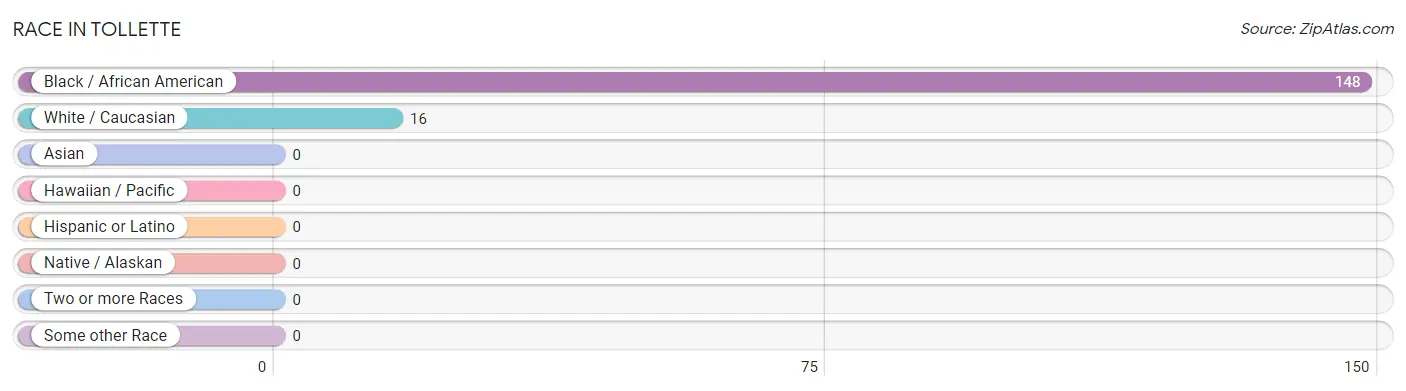
| Race | # Population | % Population |
| Asian | 0 | 0.0% |
| Black / African American | 148 | 90.2% |
| Hawaiian / Pacific | 0 | 0.0% |
| Hispanic or Latino | 0 | 0.0% |
| Native / Alaskan | 0 | 0.0% |
| White / Caucasian | 16 | 9.8% |
| Two or more Races | 0 | 0.0% |
| Some other Race | 0 | 0.0% |
| Total | 164 | 100.0% |
Ancestry in Tollette

| Ancestry | # Population | % Population | View All 0 Rows |
Immigrants in Tollette

| Immigration Origin | # Population | % Population | View All 0 Rows |
Sex and Age in Tollette
Sex and Age in Tollette
The most populous age groups in Tollette are 60 to 64 Years (16 | 20.3%) for men and 65 to 69 Years (18 | 21.2%) for women.
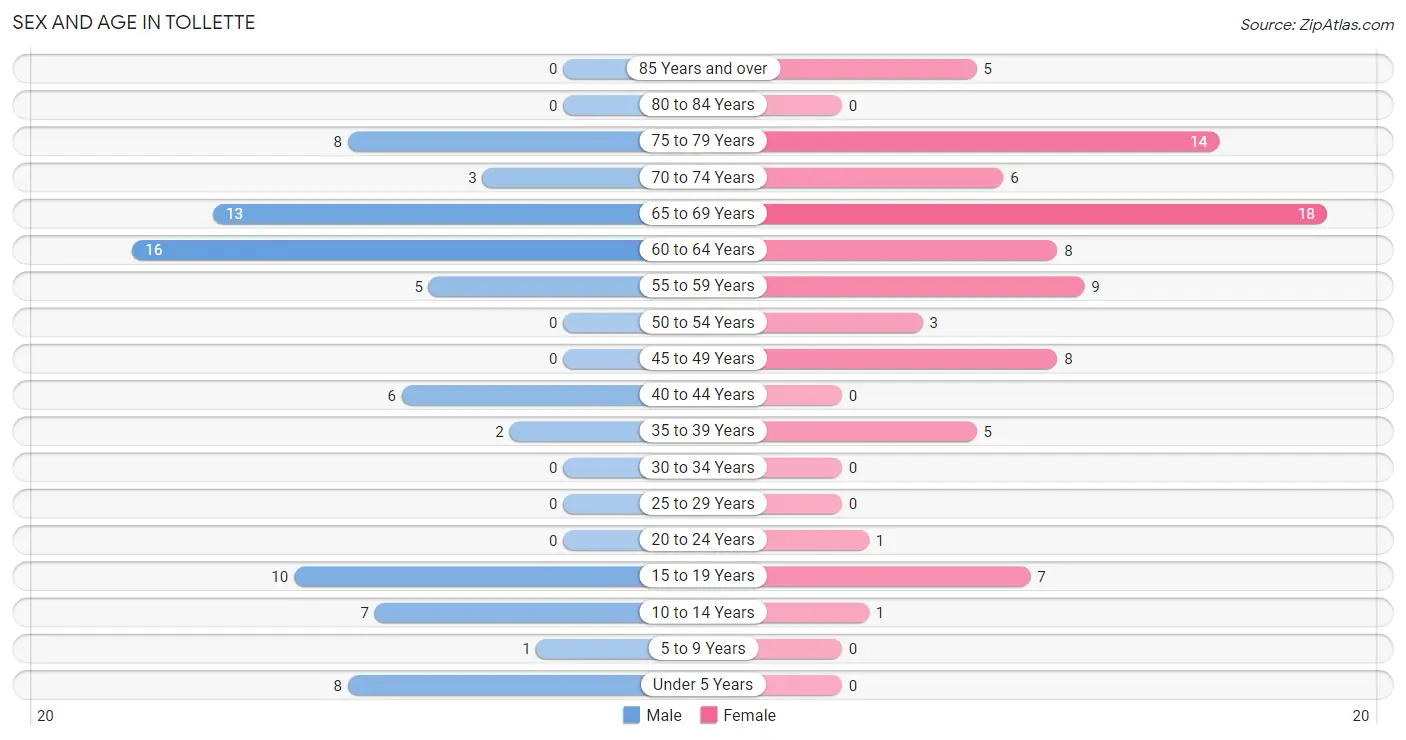
| Age Bracket | Male | Female |
| Under 5 Years | 8 (10.1%) | 0 (0.0%) |
| 5 to 9 Years | 1 (1.3%) | 0 (0.0%) |
| 10 to 14 Years | 7 (8.9%) | 1 (1.2%) |
| 15 to 19 Years | 10 (12.7%) | 7 (8.2%) |
| 20 to 24 Years | 0 (0.0%) | 1 (1.2%) |
| 25 to 29 Years | 0 (0.0%) | 0 (0.0%) |
| 30 to 34 Years | 0 (0.0%) | 0 (0.0%) |
| 35 to 39 Years | 2 (2.5%) | 5 (5.9%) |
| 40 to 44 Years | 6 (7.6%) | 0 (0.0%) |
| 45 to 49 Years | 0 (0.0%) | 8 (9.4%) |
| 50 to 54 Years | 0 (0.0%) | 3 (3.5%) |
| 55 to 59 Years | 5 (6.3%) | 9 (10.6%) |
| 60 to 64 Years | 16 (20.3%) | 8 (9.4%) |
| 65 to 69 Years | 13 (16.5%) | 18 (21.2%) |
| 70 to 74 Years | 3 (3.8%) | 6 (7.1%) |
| 75 to 79 Years | 8 (10.1%) | 14 (16.5%) |
| 80 to 84 Years | 0 (0.0%) | 0 (0.0%) |
| 85 Years and over | 0 (0.0%) | 5 (5.9%) |
| Total | 79 (100.0%) | 85 (100.0%) |
Families and Households in Tollette
Median Family Size in Tollette
The median family size in Tollette is 2.25 persons per family, with single female/mother families (25 | 45.5%) accounting for the largest median family size of 2.76 persons per family. On the other hand, married-couple families (28 | 50.9%) represent the smallest median family size with 1.82 persons per family.
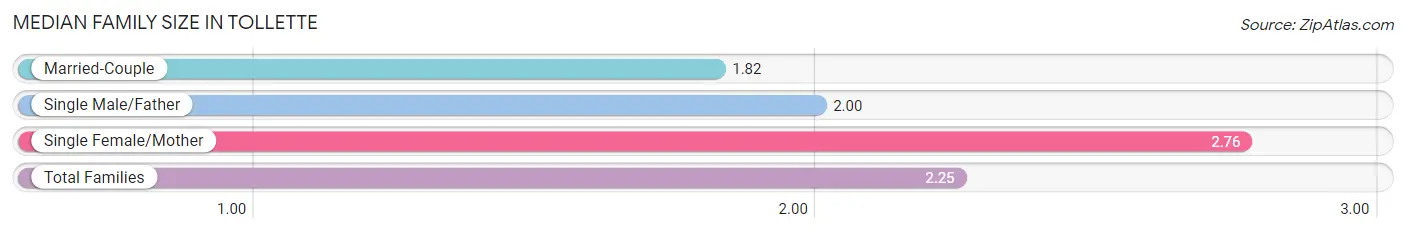
| Family Type | # Families | Family Size |
| Married-Couple | 28 (50.9%) | 1.82 |
| Single Male/Father | 2 (3.6%) | 2.00 |
| Single Female/Mother | 25 (45.5%) | 2.76 |
| Total Families | 55 (100.0%) | 2.25 |
Median Household Size in Tollette
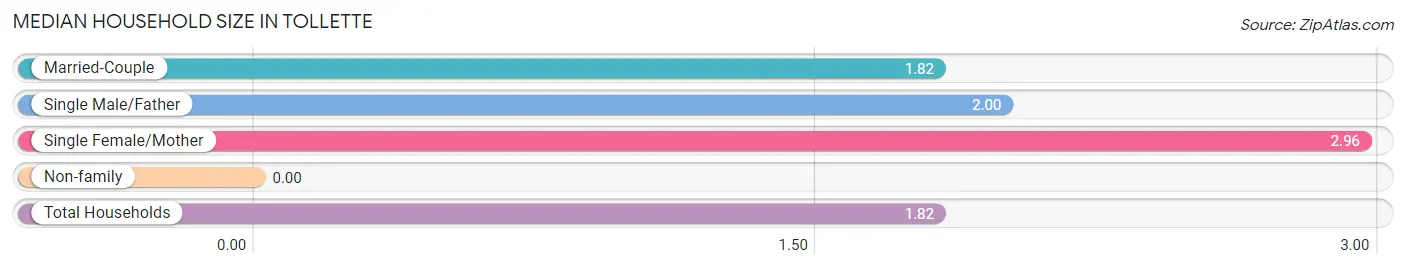
| Household Type | # Households | Household Size |
| Married-Couple | 28 (31.1%) | 1.82 |
| Single Male/Father | 2 (2.2%) | 2.00 |
| Single Female/Mother | 25 (27.8%) | 2.96 |
| Non-family | 35 (38.9%) | - |
| Total Households | 90 (100.0%) | 1.82 |
Household Size by Marriage Status in Tollette
Out of a total of 90 households in Tollette, 55 (61.1%) are family households, while 35 (38.9%) are nonfamily households. The most numerous type of family households are 2-person households, comprising 40, and the most common type of nonfamily households are 1-person households, comprising 35.
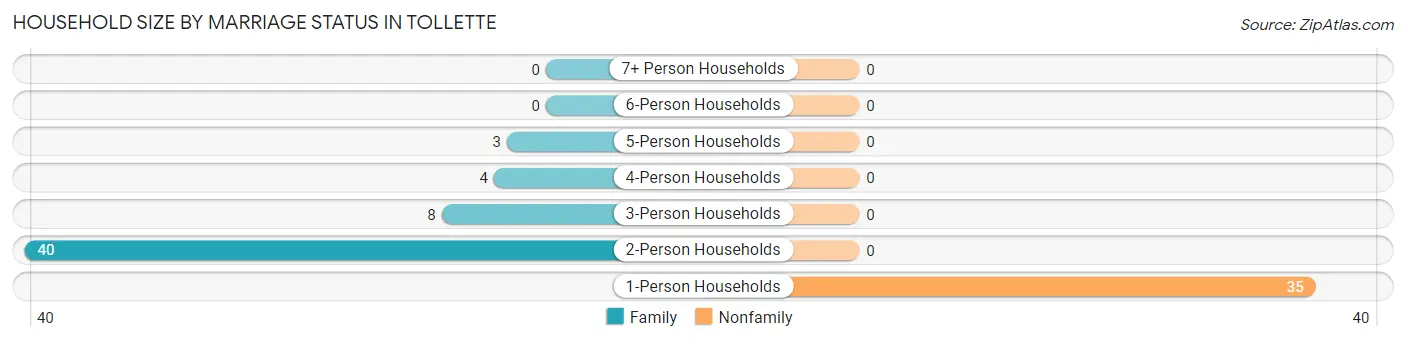
| Household Size | Family Households | Nonfamily Households |
| 1-Person Households | - | 35 (38.9%) |
| 2-Person Households | 40 (44.4%) | 0 (0.0%) |
| 3-Person Households | 8 (8.9%) | 0 (0.0%) |
| 4-Person Households | 4 (4.4%) | 0 (0.0%) |
| 5-Person Households | 3 (3.3%) | 0 (0.0%) |
| 6-Person Households | 0 (0.0%) | 0 (0.0%) |
| 7+ Person Households | 0 (0.0%) | 0 (0.0%) |
| Total | 55 (61.1%) | 35 (38.9%) |
Female Fertility in Tollette
Fertility by Age in Tollette
| Age Bracket | Women with Births | Births / 1,000 Women |
| 15 to 19 years | 0 (0.0%) | 0.0 |
| 20 to 34 years | 0 (0.0%) | 0.0 |
| 35 to 50 years | 0 (0.0%) | 0.0 |
| Total | 0 (0.0%) | 0.0 |
Fertility by Age by Marriage Status in Tollette
| Age Bracket | Married | Unmarried |
| 15 to 19 years | 0 (0.0%) | 0 (0.0%) |
| 20 to 34 years | 0 (0.0%) | 0 (0.0%) |
| 35 to 50 years | 0 (0.0%) | 0 (0.0%) |
| Total | 0 (0.0%) | 0 (0.0%) |
Fertility by Education in Tollette
| Educational Attainment | Women with Births | Births / 1,000 Women |
| Less than High School | 0 (0.0%) | 0.0 |
| High School Diploma | 0 (0.0%) | 0.0 |
| College or Associate's Degree | 0 (0.0%) | 0.0 |
| Bachelor's Degree | 0 (0.0%) | 0.0 |
| Graduate Degree | 0 (0.0%) | 0.0 |
| Total | 0 (0.0%) | 0.0 |
Fertility by Education by Marriage Status in Tollette
| Educational Attainment | Married | Unmarried |
| Less than High School | 0 (0.0%) | 0 (0.0%) |
| High School Diploma | 0 (0.0%) | 0 (0.0%) |
| College or Associate's Degree | 0 (0.0%) | 0 (0.0%) |
| Bachelor's Degree | 0 (0.0%) | 0 (0.0%) |
| Graduate Degree | 0 (0.0%) | 0 (0.0%) |
| Total | 0 (0.0%) | 0 (0.0%) |
Employment Characteristics in Tollette
Employment by Class of Employer in Tollette
Among the 46 employed individuals in Tollette, private company employees (27 | 58.7%), not-for-profit organizations (11 | 23.9%), and state government employees (6 | 13.0%) make up the most common classes of employment.
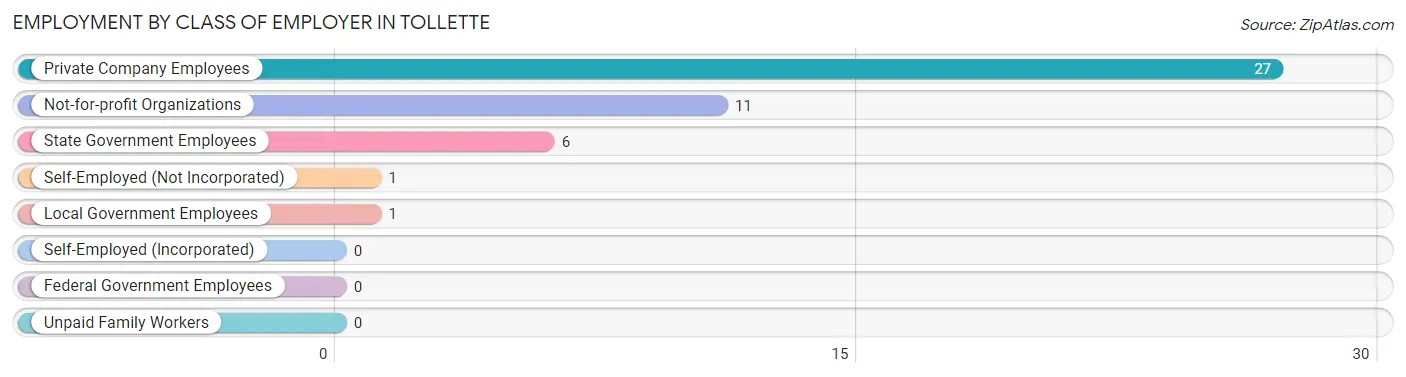
| Employer Class | # Employees | % Employees |
| Private Company Employees | 27 | 58.7% |
| Self-Employed (Incorporated) | 0 | 0.0% |
| Self-Employed (Not Incorporated) | 1 | 2.2% |
| Not-for-profit Organizations | 11 | 23.9% |
| Local Government Employees | 1 | 2.2% |
| State Government Employees | 6 | 13.0% |
| Federal Government Employees | 0 | 0.0% |
| Unpaid Family Workers | 0 | 0.0% |
| Total | 46 | 100.0% |
Employment Status by Age in Tollette
According to the labor force statistics for Tollette, out of the total population over 16 years of age (147), 45.6% or 67 individuals are in the labor force, with 20.9% or 14 of them unemployed. The age group with the highest labor force participation rate is 16 to 19 years, with 94.1% or 16 individuals in the labor force. Within the labor force, the 16 to 19 years age range has the highest percentage of unemployed individuals, with 87.5% or 14 of them being unemployed.
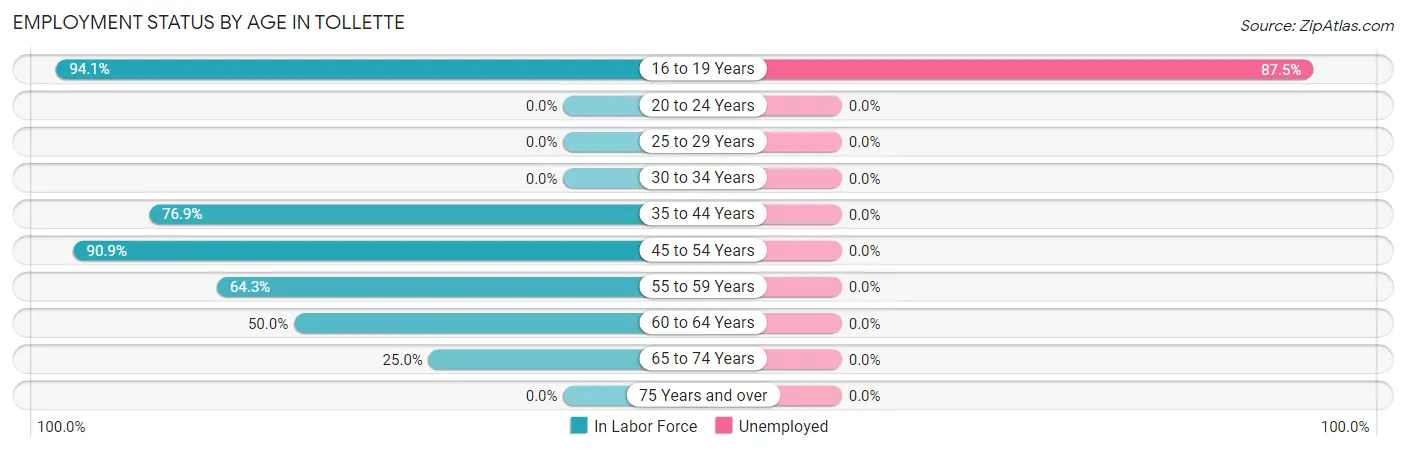
| Age Bracket | In Labor Force | Unemployed |
| 16 to 19 Years | 16 (94.1%) | 14 (87.5%) |
| 20 to 24 Years | 0 (0.0%) | 0 (0.0%) |
| 25 to 29 Years | 0 (0.0%) | 0 (0.0%) |
| 30 to 34 Years | 0 (0.0%) | 0 (0.0%) |
| 35 to 44 Years | 10 (76.9%) | 0 (0.0%) |
| 45 to 54 Years | 10 (90.9%) | 0 (0.0%) |
| 55 to 59 Years | 9 (64.3%) | 0 (0.0%) |
| 60 to 64 Years | 12 (50.0%) | 0 (0.0%) |
| 65 to 74 Years | 10 (25.0%) | 0 (0.0%) |
| 75 Years and over | 0 (0.0%) | 0 (0.0%) |
| Total | 67 (45.6%) | 14 (20.9%) |
Employment Status by Educational Attainment in Tollette
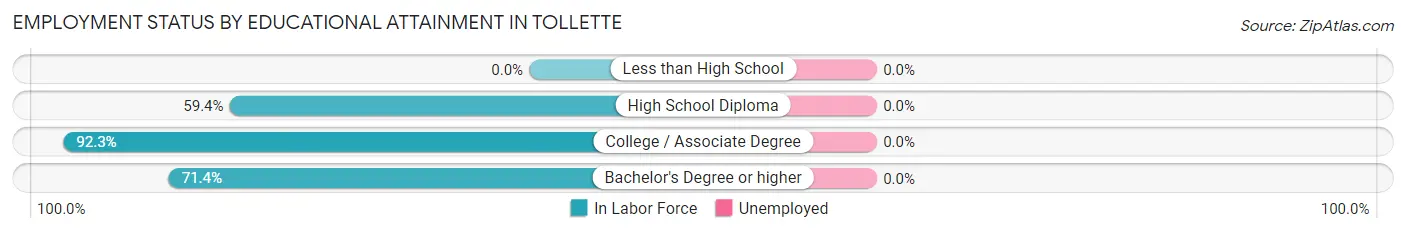
| Educational Attainment | In Labor Force | Unemployed |
| Less than High School | 0 (0.0%) | 0 (0.0%) |
| High School Diploma | 19 (59.4%) | 0 (0.0%) |
| College / Associate Degree | 12 (92.3%) | 0 (0.0%) |
| Bachelor's Degree or higher | 10 (71.4%) | 0 (0.0%) |
| Total | 41 (66.1%) | 0 (0.0%) |
Employment Occupations by Sex in Tollette
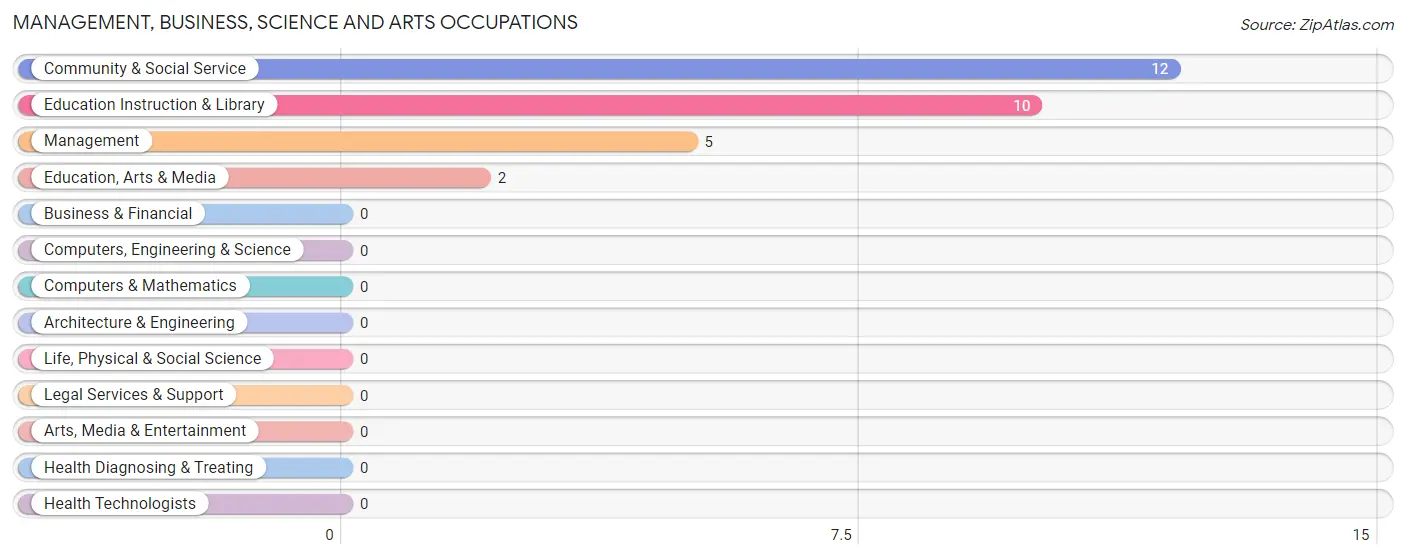
Management, Business, Science and Arts Occupations
The most common Management, Business, Science and Arts occupations in Tollette are Community & Social Service (12 | 22.6%), Education Instruction & Library (10 | 18.9%), Management (5 | 9.4%), and Education, Arts & Media (2 | 3.8%).
Management, Business, Science and Arts Occupations by Sex
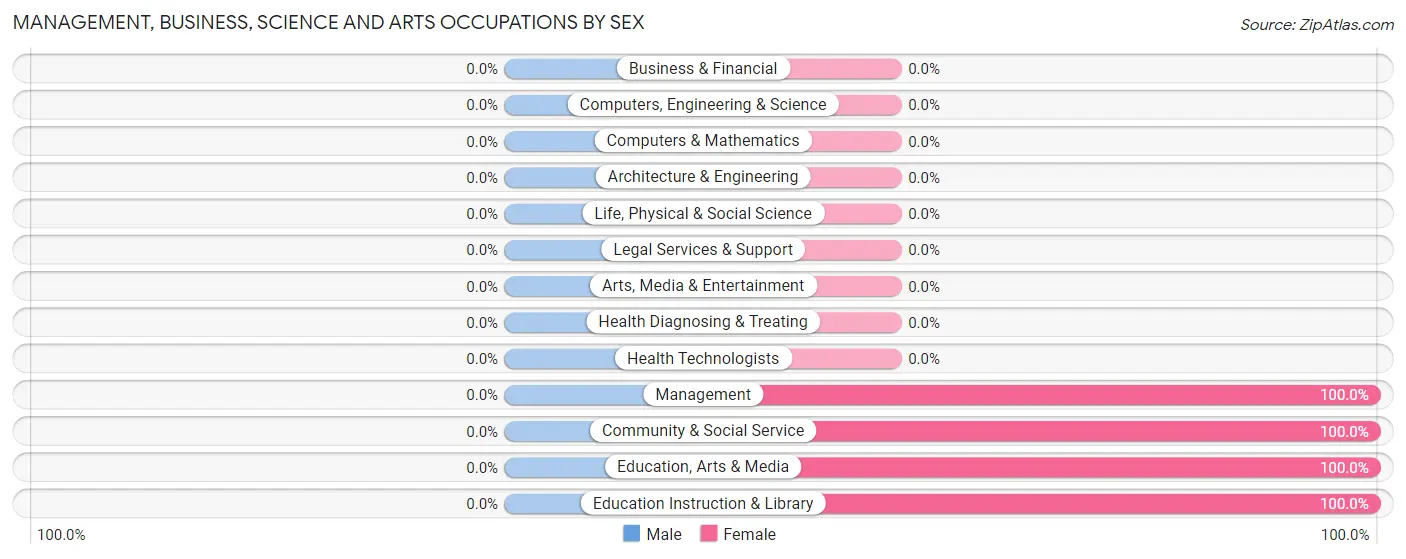
| Occupation | Male | Female |
| Management | 0 (0.0%) | 5 (100.0%) |
| Business & Financial | 0 (0.0%) | 0 (0.0%) |
| Computers, Engineering & Science | 0 (0.0%) | 0 (0.0%) |
| Computers & Mathematics | 0 (0.0%) | 0 (0.0%) |
| Architecture & Engineering | 0 (0.0%) | 0 (0.0%) |
| Life, Physical & Social Science | 0 (0.0%) | 0 (0.0%) |
| Community & Social Service | 0 (0.0%) | 12 (100.0%) |
| Education, Arts & Media | 0 (0.0%) | 2 (100.0%) |
| Legal Services & Support | 0 (0.0%) | 0 (0.0%) |
| Education Instruction & Library | 0 (0.0%) | 10 (100.0%) |
| Arts, Media & Entertainment | 0 (0.0%) | 0 (0.0%) |
| Health Diagnosing & Treating | 0 (0.0%) | 0 (0.0%) |
| Health Technologists | 0 (0.0%) | 0 (0.0%) |
| Total (Category) | 0 (0.0%) | 17 (100.0%) |
| Total (Overall) | 13 (24.5%) | 40 (75.5%) |
Services Occupations
The most common Services occupations in Tollette are Cleaning & Maintenance (7 | 13.2%), Personal Care & Service (6 | 11.3%), Food Preparation & Serving (5 | 9.4%), and Healthcare Support (1 | 1.9%).
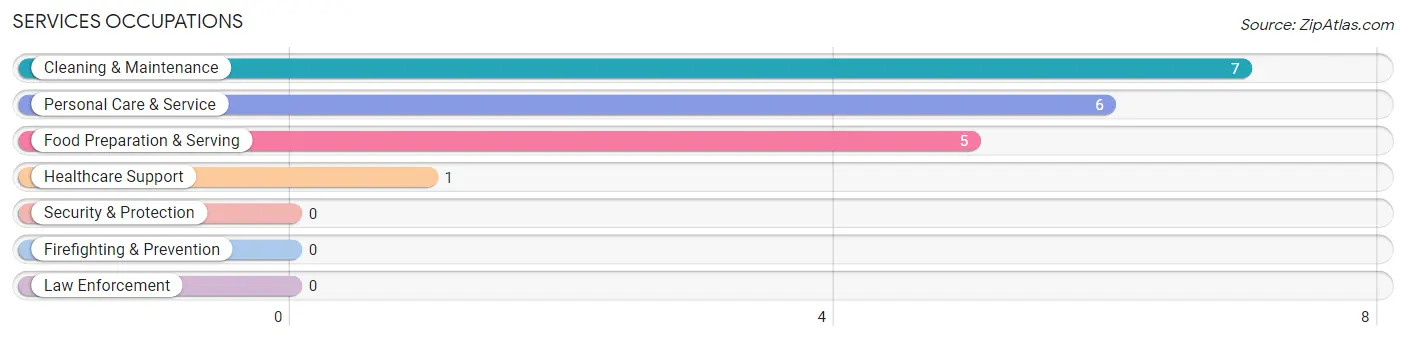
Services Occupations by Sex
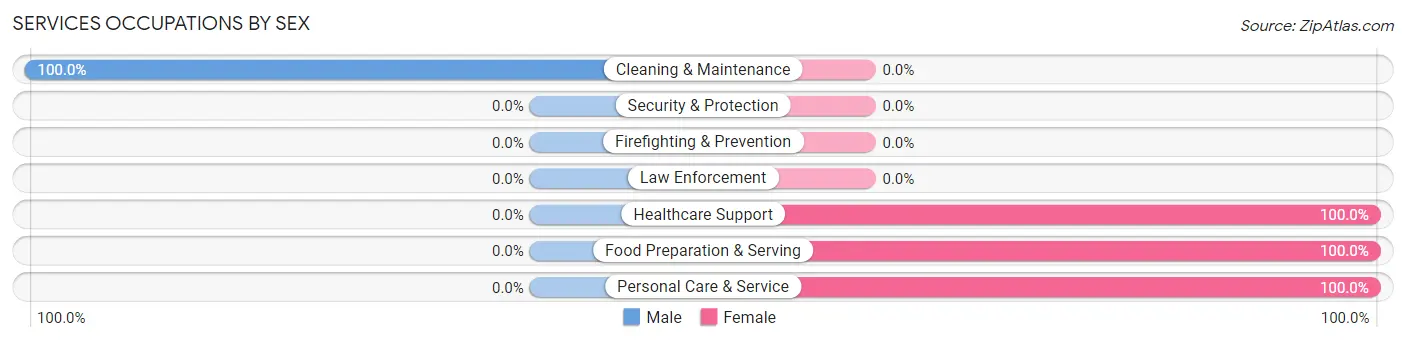
| Occupation | Male | Female |
| Healthcare Support | 0 (0.0%) | 1 (100.0%) |
| Security & Protection | 0 (0.0%) | 0 (0.0%) |
| Firefighting & Prevention | 0 (0.0%) | 0 (0.0%) |
| Law Enforcement | 0 (0.0%) | 0 (0.0%) |
| Food Preparation & Serving | 0 (0.0%) | 5 (100.0%) |
| Cleaning & Maintenance | 7 (100.0%) | 0 (0.0%) |
| Personal Care & Service | 0 (0.0%) | 6 (100.0%) |
| Total (Category) | 7 (36.8%) | 12 (63.2%) |
| Total (Overall) | 13 (24.5%) | 40 (75.5%) |
Sales and Office Occupations
Sales and Office Occupations by Sex
| Occupation | Male | Female |
| Sales & Related | 0 (0.0%) | 0 (0.0%) |
| Office & Administration | 0 (0.0%) | 0 (0.0%) |
| Total (Category) | 0 (0.0%) | 0 (0.0%) |
| Total (Overall) | 13 (24.5%) | 40 (75.5%) |
Natural Resources, Construction and Maintenance Occupations
Natural Resources, Construction and Maintenance Occupations by Sex
| Occupation | Male | Female |
| Farming, Fishing & Forestry | 0 (0.0%) | 0 (0.0%) |
| Construction & Extraction | 0 (0.0%) | 0 (0.0%) |
| Installation, Maintenance & Repair | 0 (0.0%) | 0 (0.0%) |
| Total (Category) | 0 (0.0%) | 0 (0.0%) |
| Total (Overall) | 13 (24.5%) | 40 (75.5%) |
Production, Transportation and Moving Occupations
The most common Production, Transportation and Moving occupations in Tollette are Production (10 | 18.9%), and Material Moving (7 | 13.2%).
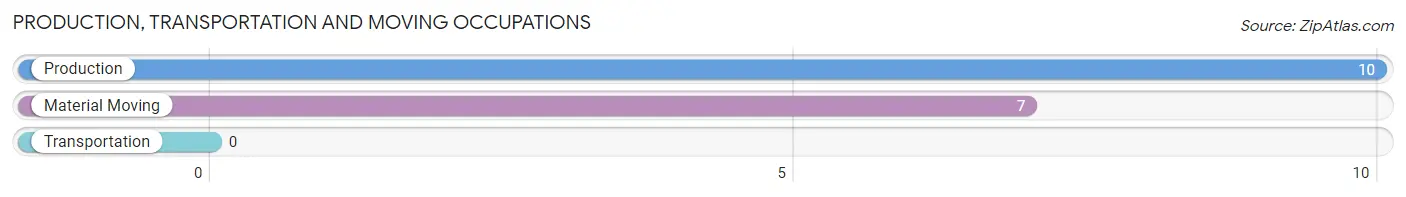
Production, Transportation and Moving Occupations by Sex
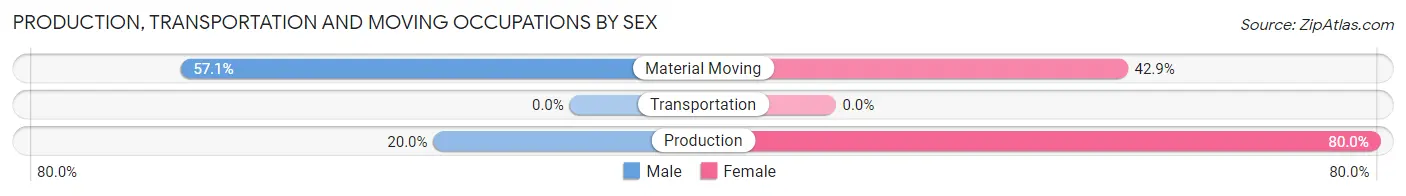
| Occupation | Male | Female |
| Production | 2 (20.0%) | 8 (80.0%) |
| Transportation | 0 (0.0%) | 0 (0.0%) |
| Material Moving | 4 (57.1%) | 3 (42.9%) |
| Total (Category) | 6 (35.3%) | 11 (64.7%) |
| Total (Overall) | 13 (24.5%) | 40 (75.5%) |
Employment Industries by Sex in Tollette
Employment Industries in Tollette
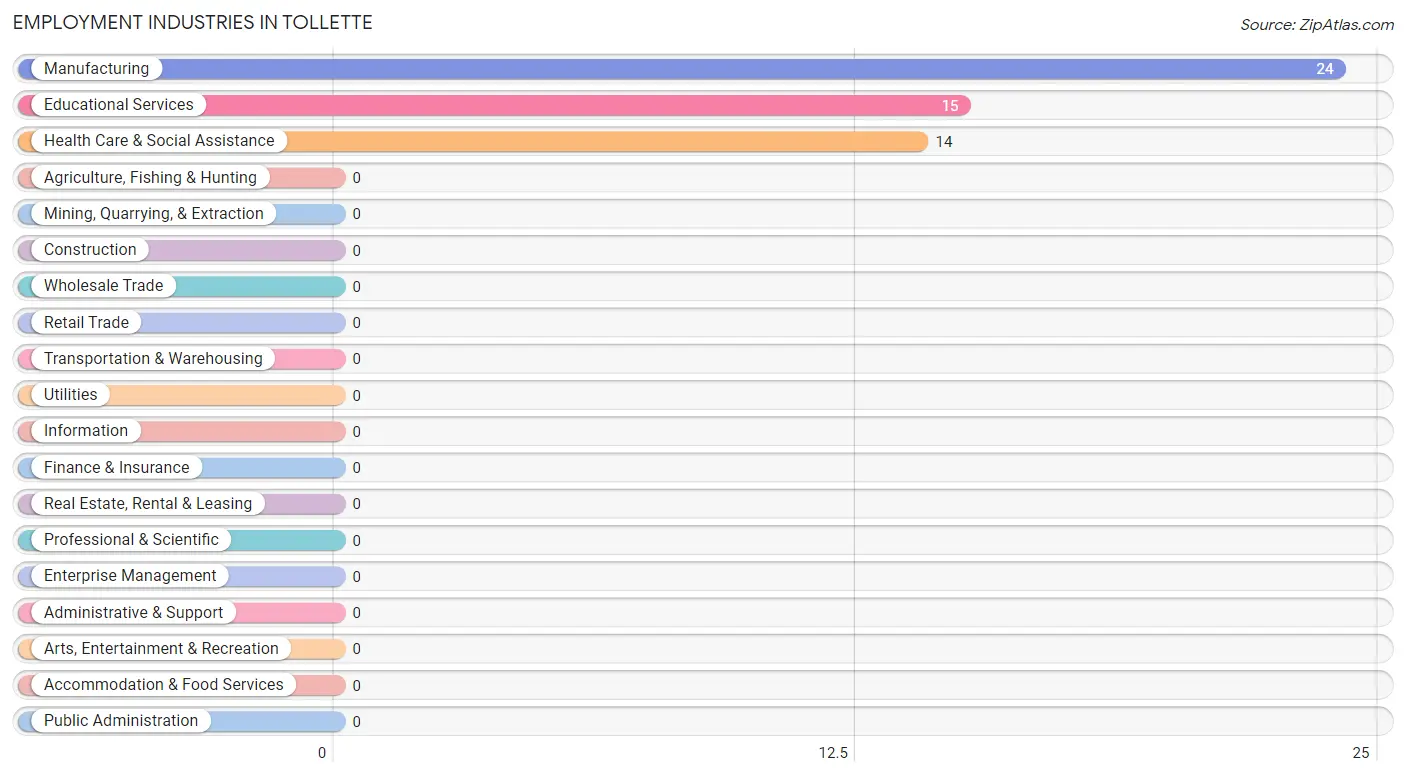
The major employment industries in Tollette include Manufacturing (24 | 45.3%), Educational Services (15 | 28.3%), and Health Care & Social Assistance (14 | 26.4%).
Employment Industries by Sex in Tollette
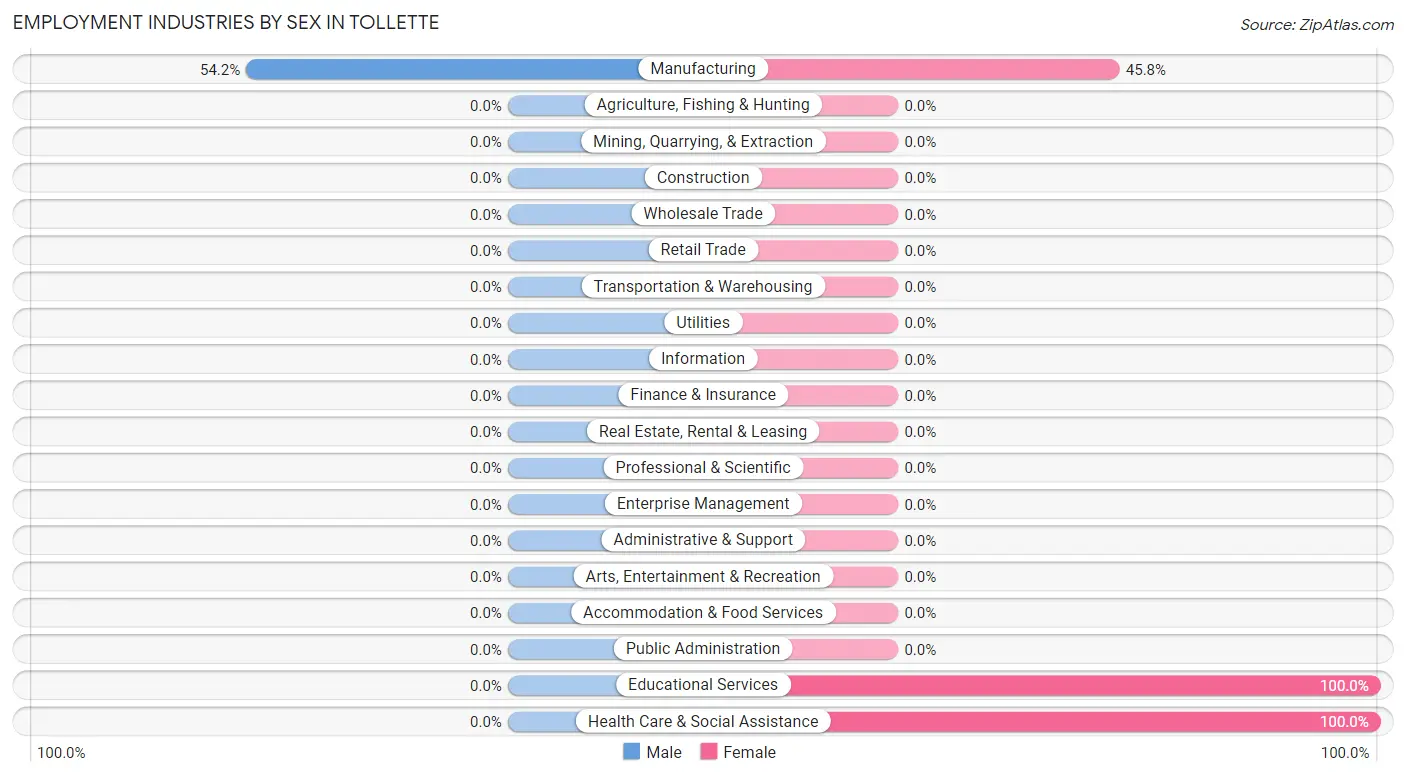
| Industry | Male | Female |
| Agriculture, Fishing & Hunting | 0 (0.0%) | 0 (0.0%) |
| Mining, Quarrying, & Extraction | 0 (0.0%) | 0 (0.0%) |
| Construction | 0 (0.0%) | 0 (0.0%) |
| Manufacturing | 13 (54.2%) | 11 (45.8%) |
| Wholesale Trade | 0 (0.0%) | 0 (0.0%) |
| Retail Trade | 0 (0.0%) | 0 (0.0%) |
| Transportation & Warehousing | 0 (0.0%) | 0 (0.0%) |
| Utilities | 0 (0.0%) | 0 (0.0%) |
| Information | 0 (0.0%) | 0 (0.0%) |
| Finance & Insurance | 0 (0.0%) | 0 (0.0%) |
| Real Estate, Rental & Leasing | 0 (0.0%) | 0 (0.0%) |
| Professional & Scientific | 0 (0.0%) | 0 (0.0%) |
| Enterprise Management | 0 (0.0%) | 0 (0.0%) |
| Administrative & Support | 0 (0.0%) | 0 (0.0%) |
| Educational Services | 0 (0.0%) | 15 (100.0%) |
| Health Care & Social Assistance | 0 (0.0%) | 14 (100.0%) |
| Arts, Entertainment & Recreation | 0 (0.0%) | 0 (0.0%) |
| Accommodation & Food Services | 0 (0.0%) | 0 (0.0%) |
| Public Administration | 0 (0.0%) | 0 (0.0%) |
| Total | 13 (24.5%) | 40 (75.5%) |
Education in Tollette
School Enrollment in Tollette
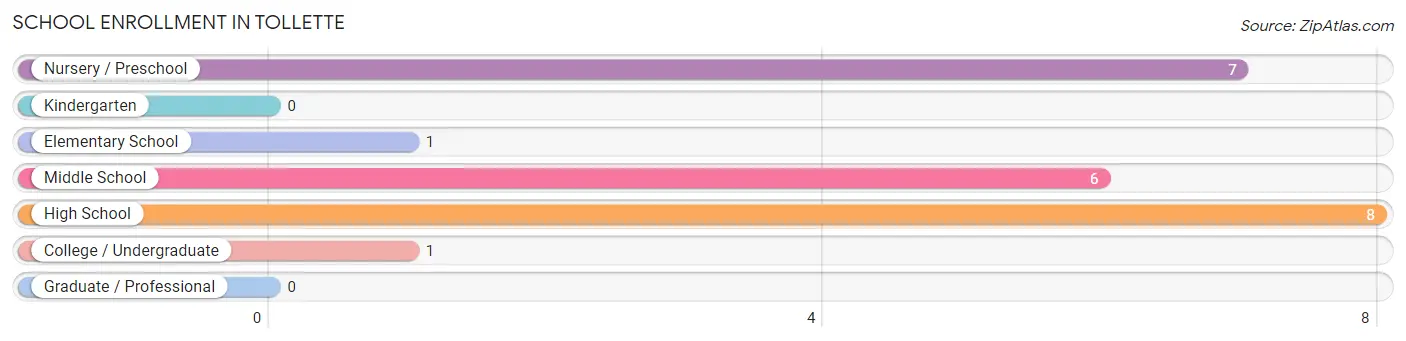
The most common levels of schooling among the 23 students in Tollette are high school (8 | 34.8%), nursery / preschool (7 | 30.4%), and middle school (6 | 26.1%).
| School Level | # Students | % Students |
| Nursery / Preschool | 7 | 30.4% |
| Kindergarten | 0 | 0.0% |
| Elementary School | 1 | 4.3% |
| Middle School | 6 | 26.1% |
| High School | 8 | 34.8% |
| College / Undergraduate | 1 | 4.3% |
| Graduate / Professional | 0 | 0.0% |
| Total | 23 | 100.0% |
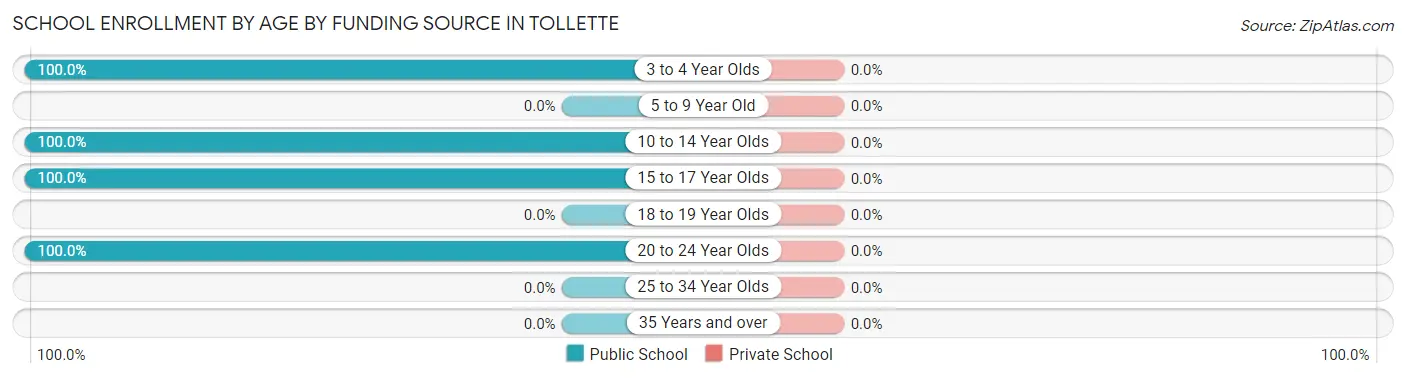
School Enrollment by Age by Funding Source in Tollette
| Age Bracket | Public School | Private School |
| 3 to 4 Year Olds | 7 (100.0%) | 0 (0.0%) |
| 5 to 9 Year Old | 0 (0.0%) | 0 (0.0%) |
| 10 to 14 Year Olds | 8 (100.0%) | 0 (0.0%) |
| 15 to 17 Year Olds | 7 (100.0%) | 0 (0.0%) |
| 18 to 19 Year Olds | 0 (0.0%) | 0 (0.0%) |
| 20 to 24 Year Olds | 1 (100.0%) | 0 (0.0%) |
| 25 to 34 Year Olds | 0 (0.0%) | 0 (0.0%) |
| 35 Years and over | 0 (0.0%) | 0 (0.0%) |
| Total | 23 (100.0%) | 0 (0.0%) |
Educational Attainment by Field of Study in Tollette
Education (13 | 33.3%), arts & humanities (10 | 25.6%), social sciences (5 | 12.8%), business (5 | 12.8%), and psychology (4 | 10.3%) are the most common fields of study among 39 individuals in Tollette who have obtained a bachelor's degree or higher.
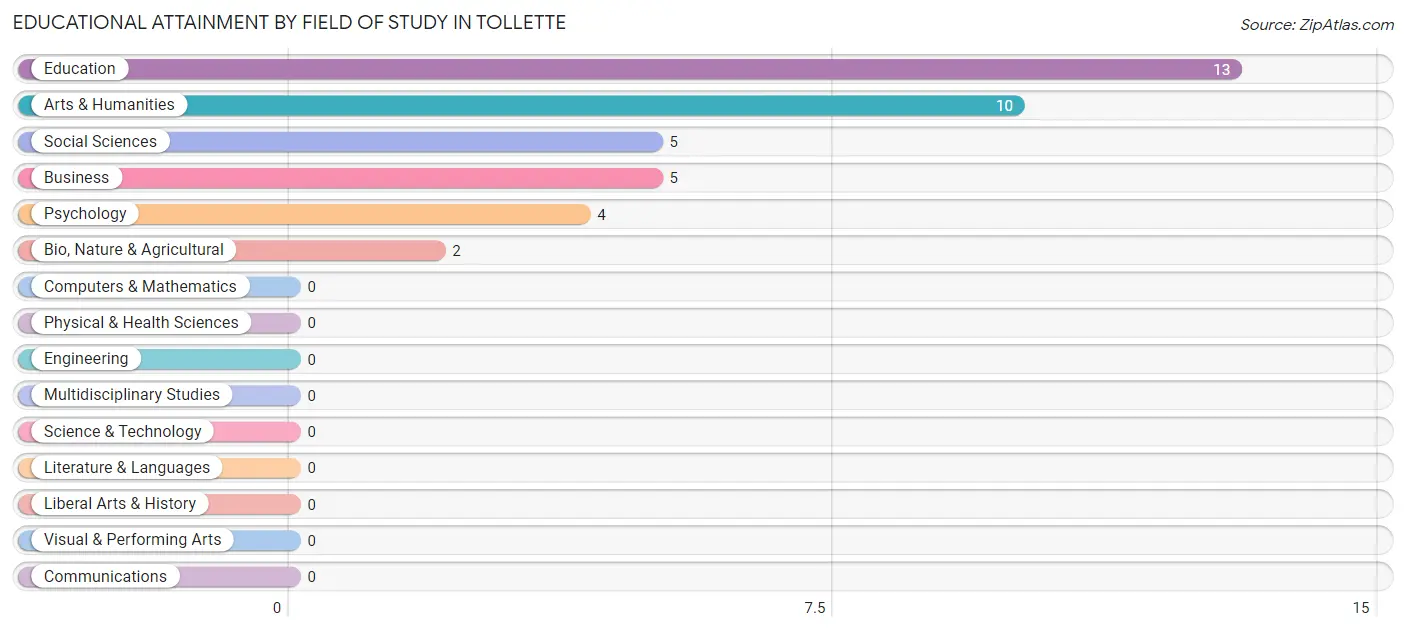
| Field of Study | # Graduates | % Graduates |
| Computers & Mathematics | 0 | 0.0% |
| Bio, Nature & Agricultural | 2 | 5.1% |
| Physical & Health Sciences | 0 | 0.0% |
| Psychology | 4 | 10.3% |
| Social Sciences | 5 | 12.8% |
| Engineering | 0 | 0.0% |
| Multidisciplinary Studies | 0 | 0.0% |
| Science & Technology | 0 | 0.0% |
| Business | 5 | 12.8% |
| Education | 13 | 33.3% |
| Literature & Languages | 0 | 0.0% |
| Liberal Arts & History | 0 | 0.0% |
| Visual & Performing Arts | 0 | 0.0% |
| Communications | 0 | 0.0% |
| Arts & Humanities | 10 | 25.6% |
| Total | 39 | 100.0% |
Transportation & Commute in Tollette
Vehicle Availability by Sex in Tollette
The most prevalent vehicle ownership categories in Tollette are males with 2 vehicles (13, accounting for 100.0%) and females with 2 vehicles (17, making up 39.4%).
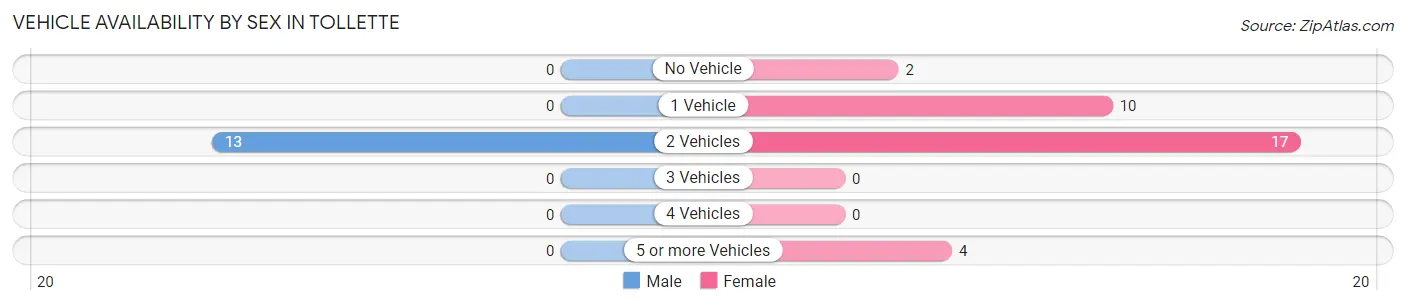
| Vehicles Available | Male | Female |
| No Vehicle | 0 (0.0%) | 2 (6.1%) |
| 1 Vehicle | 0 (0.0%) | 10 (30.3%) |
| 2 Vehicles | 13 (100.0%) | 17 (51.5%) |
| 3 Vehicles | 0 (0.0%) | 0 (0.0%) |
| 4 Vehicles | 0 (0.0%) | 0 (0.0%) |
| 5 or more Vehicles | 0 (0.0%) | 4 (12.1%) |
| Total | 13 (100.0%) | 33 (100.0%) |
Commute Time in Tollette
The most frequently occuring commute durations in Tollette are 15 to 19 minutes (14 commuters, 30.4%), 45 to 59 minutes (11 commuters, 23.9%), and 10 to 14 minutes (9 commuters, 19.6%).
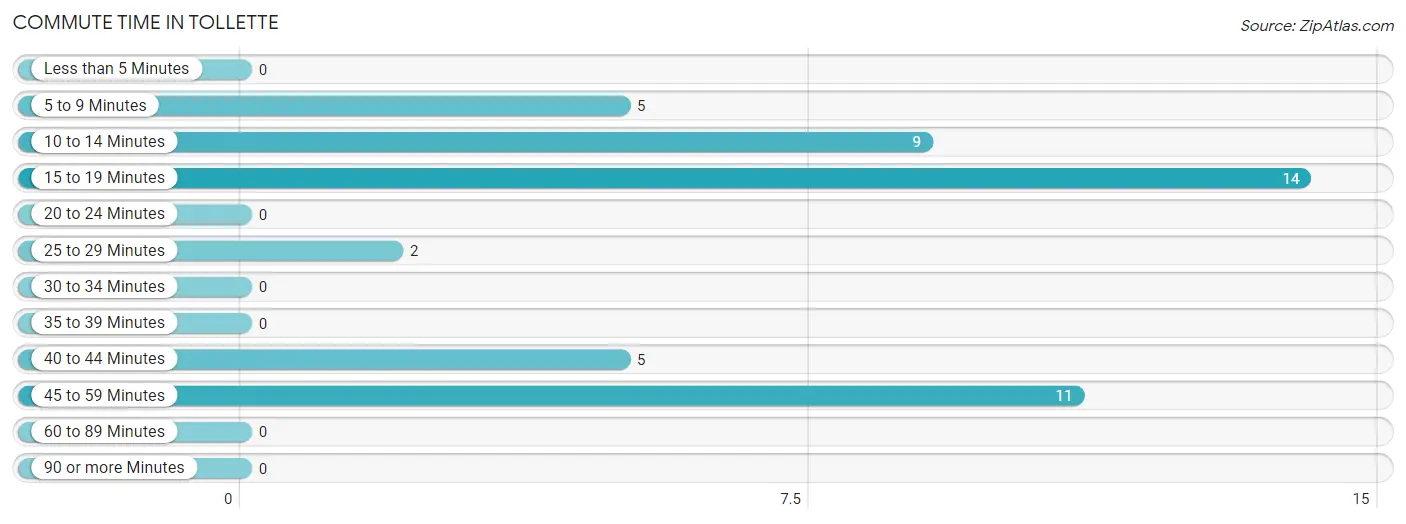
| Commute Time | # Commuters | % Commuters |
| Less than 5 Minutes | 0 | 0.0% |
| 5 to 9 Minutes | 5 | 10.9% |
| 10 to 14 Minutes | 9 | 19.6% |
| 15 to 19 Minutes | 14 | 30.4% |
| 20 to 24 Minutes | 0 | 0.0% |
| 25 to 29 Minutes | 2 | 4.3% |
| 30 to 34 Minutes | 0 | 0.0% |
| 35 to 39 Minutes | 0 | 0.0% |
| 40 to 44 Minutes | 5 | 10.9% |
| 45 to 59 Minutes | 11 | 23.9% |
| 60 to 89 Minutes | 0 | 0.0% |
| 90 or more Minutes | 0 | 0.0% |
Commute Time by Sex in Tollette
The most common commute times in Tollette are 10 to 14 minutes (9 commuters, 69.2%) for males and 15 to 19 minutes (14 commuters, 42.4%) for females.
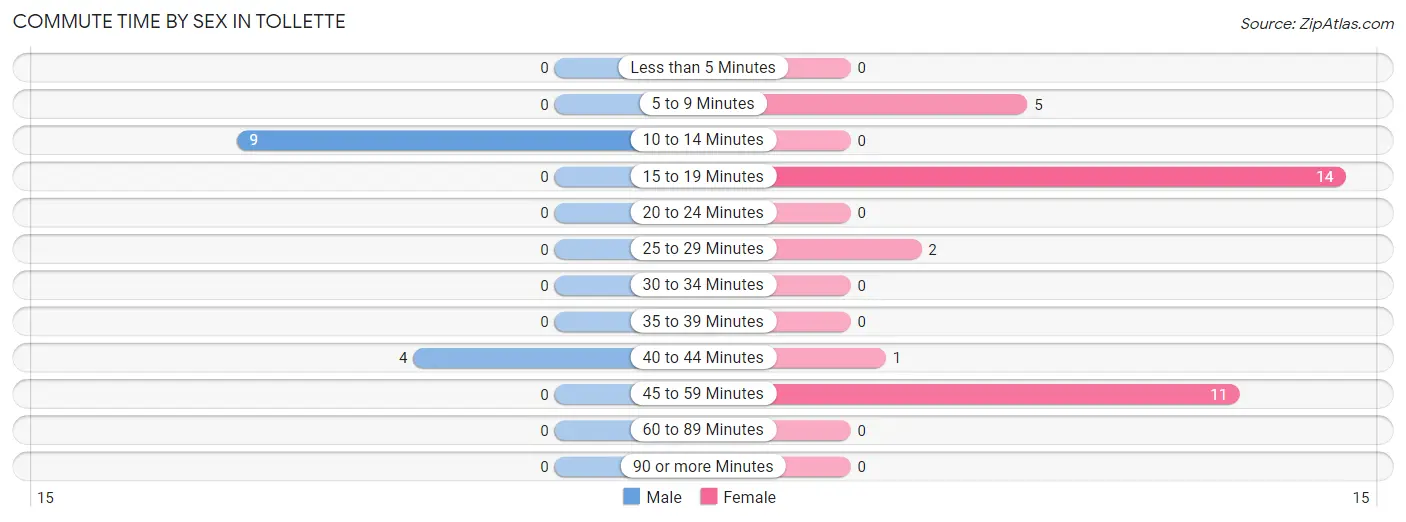
| Commute Time | Male | Female |
| Less than 5 Minutes | 0 (0.0%) | 0 (0.0%) |
| 5 to 9 Minutes | 0 (0.0%) | 5 (15.1%) |
| 10 to 14 Minutes | 9 (69.2%) | 0 (0.0%) |
| 15 to 19 Minutes | 0 (0.0%) | 14 (42.4%) |
| 20 to 24 Minutes | 0 (0.0%) | 0 (0.0%) |
| 25 to 29 Minutes | 0 (0.0%) | 2 (6.1%) |
| 30 to 34 Minutes | 0 (0.0%) | 0 (0.0%) |
| 35 to 39 Minutes | 0 (0.0%) | 0 (0.0%) |
| 40 to 44 Minutes | 4 (30.8%) | 1 (3.0%) |
| 45 to 59 Minutes | 0 (0.0%) | 11 (33.3%) |
| 60 to 89 Minutes | 0 (0.0%) | 0 (0.0%) |
| 90 or more Minutes | 0 (0.0%) | 0 (0.0%) |
Time of Departure to Work by Sex in Tollette
The most frequent times of departure to work in Tollette are 6:00 AM to 6:29 AM (7, 53.8%) for males and 7:00 AM to 7:29 AM (13, 39.4%) for females.
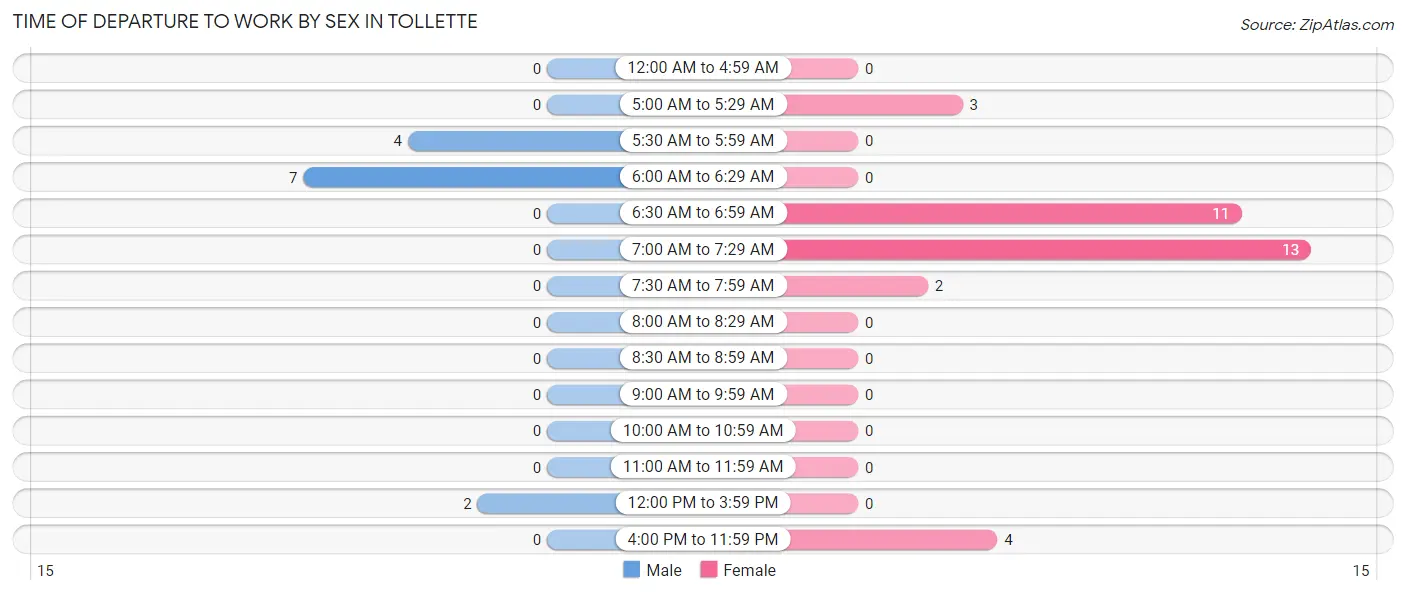
| Time of Departure | Male | Female |
| 12:00 AM to 4:59 AM | 0 (0.0%) | 0 (0.0%) |
| 5:00 AM to 5:29 AM | 0 (0.0%) | 3 (9.1%) |
| 5:30 AM to 5:59 AM | 4 (30.8%) | 0 (0.0%) |
| 6:00 AM to 6:29 AM | 7 (53.8%) | 0 (0.0%) |
| 6:30 AM to 6:59 AM | 0 (0.0%) | 11 (33.3%) |
| 7:00 AM to 7:29 AM | 0 (0.0%) | 13 (39.4%) |
| 7:30 AM to 7:59 AM | 0 (0.0%) | 2 (6.1%) |
| 8:00 AM to 8:29 AM | 0 (0.0%) | 0 (0.0%) |
| 8:30 AM to 8:59 AM | 0 (0.0%) | 0 (0.0%) |
| 9:00 AM to 9:59 AM | 0 (0.0%) | 0 (0.0%) |
| 10:00 AM to 10:59 AM | 0 (0.0%) | 0 (0.0%) |
| 11:00 AM to 11:59 AM | 0 (0.0%) | 0 (0.0%) |
| 12:00 PM to 3:59 PM | 2 (15.4%) | 0 (0.0%) |
| 4:00 PM to 11:59 PM | 0 (0.0%) | 4 (12.1%) |
| Total | 13 (100.0%) | 33 (100.0%) |
Housing Occupancy in Tollette
Occupancy by Ownership in Tollette
Of the total 90 dwellings in Tollette, owner-occupied units account for 70 (77.8%), while renter-occupied units make up 20 (22.2%).
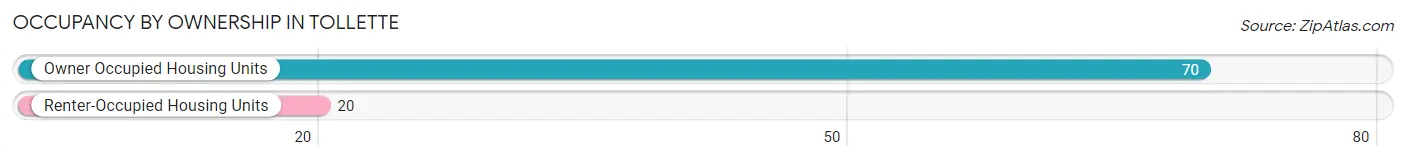
| Occupancy | # Housing Units | % Housing Units |
| Owner Occupied Housing Units | 70 | 77.8% |
| Renter-Occupied Housing Units | 20 | 22.2% |
| Total Occupied Housing Units | 90 | 100.0% |
Occupancy by Household Size in Tollette
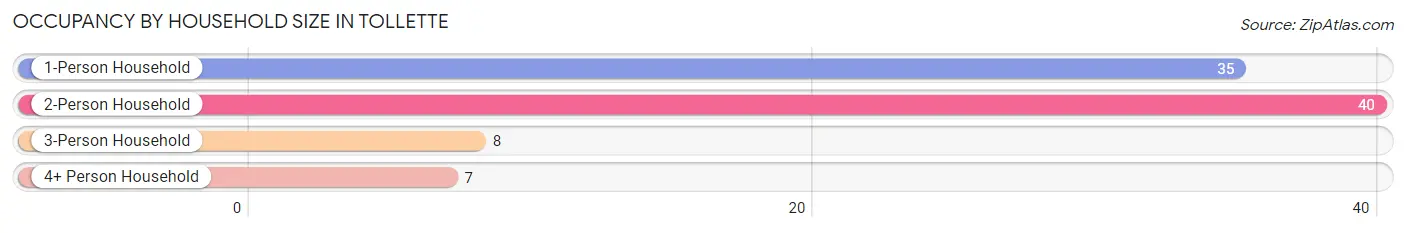
| Household Size | # Housing Units | % Housing Units |
| 1-Person Household | 35 | 38.9% |
| 2-Person Household | 40 | 44.4% |
| 3-Person Household | 8 | 8.9% |
| 4+ Person Household | 7 | 7.8% |
| Total Housing Units | 90 | 100.0% |
Occupancy by Ownership by Household Size in Tollette
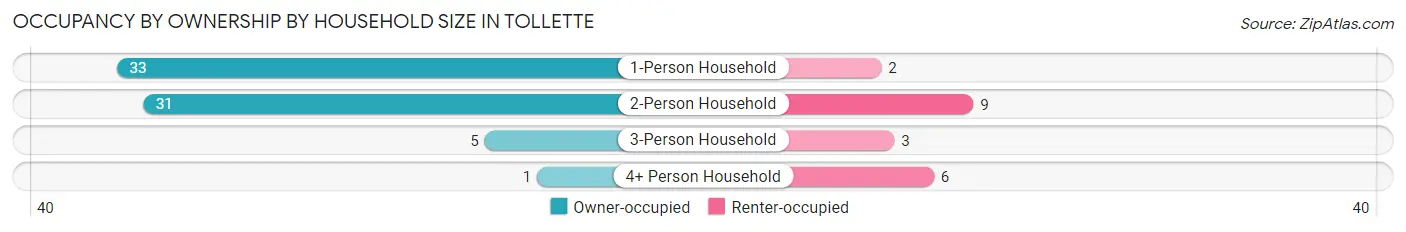
| Household Size | Owner-occupied | Renter-occupied |
| 1-Person Household | 33 (94.3%) | 2 (5.7%) |
| 2-Person Household | 31 (77.5%) | 9 (22.5%) |
| 3-Person Household | 5 (62.5%) | 3 (37.5%) |
| 4+ Person Household | 1 (14.3%) | 6 (85.7%) |
| Total Housing Units | 70 (77.8%) | 20 (22.2%) |
Occupancy by Educational Attainment in Tollette
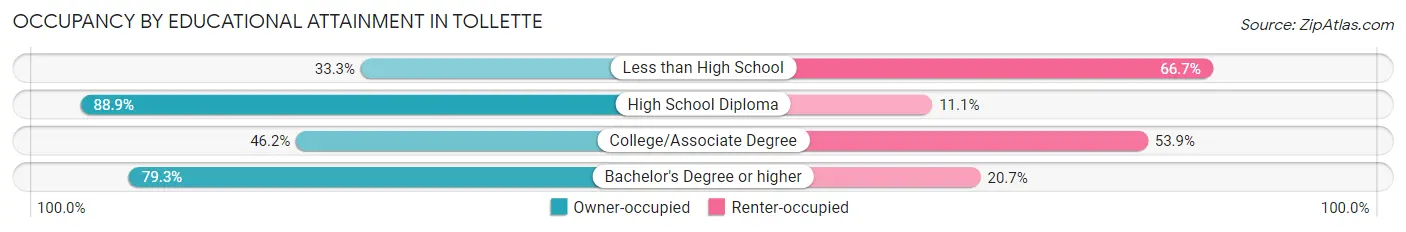
| Household Size | Owner-occupied | Renter-occupied |
| Less than High School | 1 (33.3%) | 2 (66.7%) |
| High School Diploma | 40 (88.9%) | 5 (11.1%) |
| College/Associate Degree | 6 (46.2%) | 7 (53.8%) |
| Bachelor's Degree or higher | 23 (79.3%) | 6 (20.7%) |
Occupancy by Age of Householder in Tollette
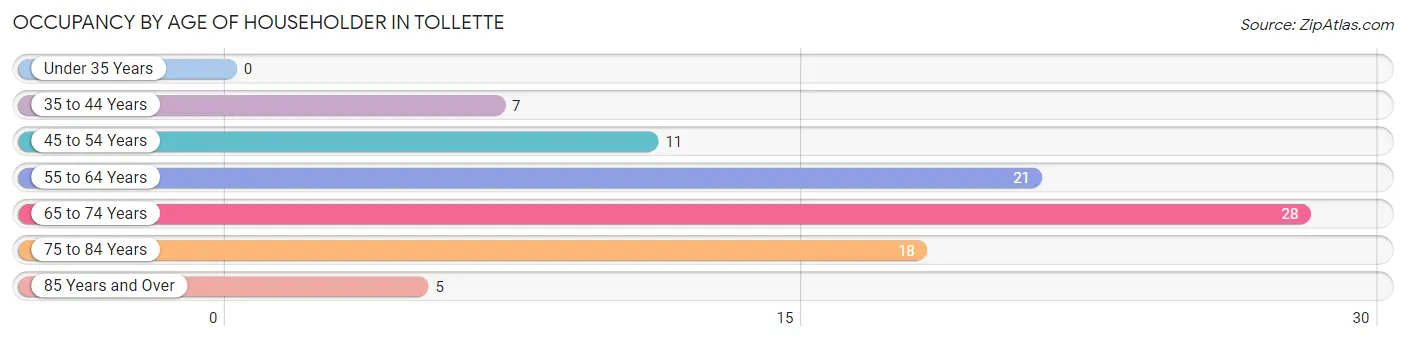
| Age Bracket | # Households | % Households |
| Under 35 Years | 0 | 0.0% |
| 35 to 44 Years | 7 | 7.8% |
| 45 to 54 Years | 11 | 12.2% |
| 55 to 64 Years | 21 | 23.3% |
| 65 to 74 Years | 28 | 31.1% |
| 75 to 84 Years | 18 | 20.0% |
| 85 Years and Over | 5 | 5.6% |
| Total | 90 | 100.0% |
Housing Finances in Tollette
Median Income by Occupancy in Tollette
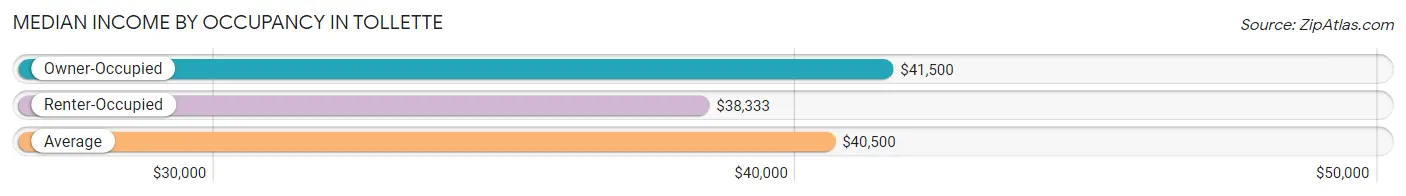
| Occupancy Type | # Households | Median Income |
| Owner-Occupied | 70 (77.8%) | $41,500 |
| Renter-Occupied | 20 (22.2%) | $38,333 |
| Average | 90 (100.0%) | $40,500 |
Occupancy by Householder Income Bracket in Tollette
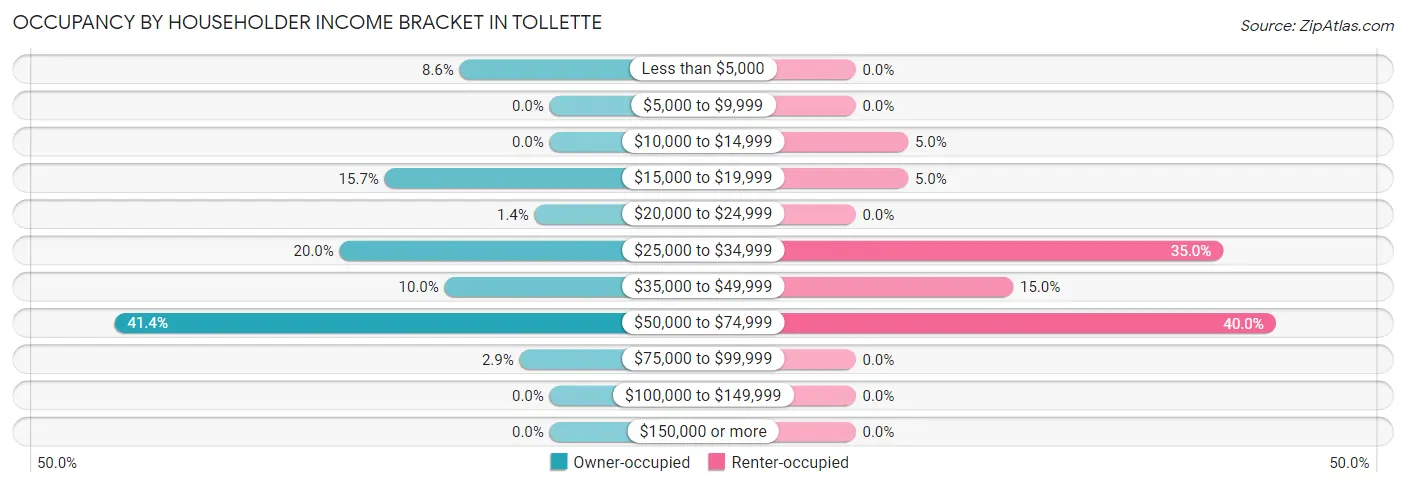
| Income Bracket | Owner-occupied | Renter-occupied |
| Less than $5,000 | 6 (8.6%) | 0 (0.0%) |
| $5,000 to $9,999 | 0 (0.0%) | 0 (0.0%) |
| $10,000 to $14,999 | 0 (0.0%) | 1 (5.0%) |
| $15,000 to $19,999 | 11 (15.7%) | 1 (5.0%) |
| $20,000 to $24,999 | 1 (1.4%) | 0 (0.0%) |
| $25,000 to $34,999 | 14 (20.0%) | 7 (35.0%) |
| $35,000 to $49,999 | 7 (10.0%) | 3 (15.0%) |
| $50,000 to $74,999 | 29 (41.4%) | 8 (40.0%) |
| $75,000 to $99,999 | 2 (2.9%) | 0 (0.0%) |
| $100,000 to $149,999 | 0 (0.0%) | 0 (0.0%) |
| $150,000 or more | 0 (0.0%) | 0 (0.0%) |
| Total | 70 (100.0%) | 20 (100.0%) |
Monthly Housing Cost Tiers in Tollette
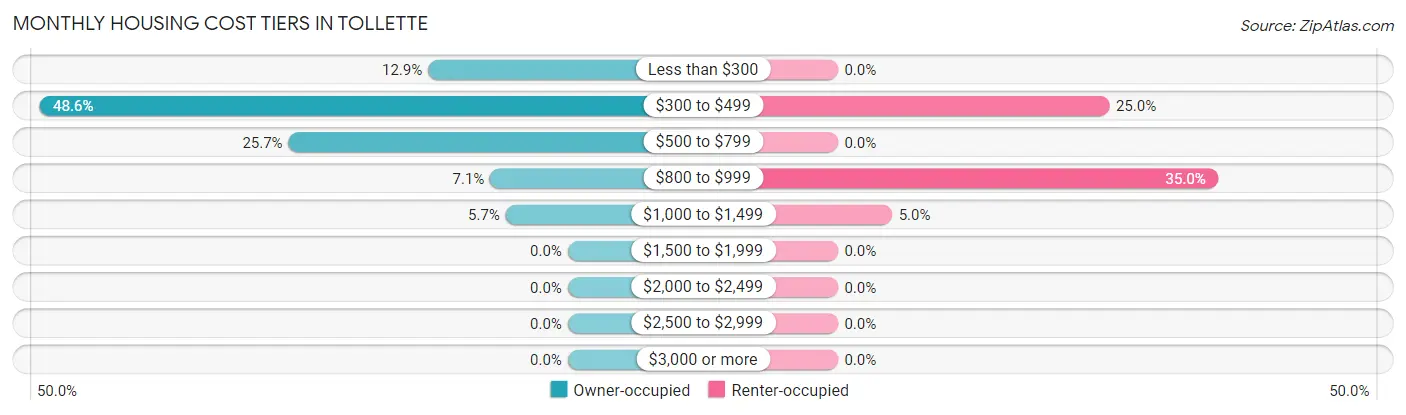
| Monthly Cost | Owner-occupied | Renter-occupied |
| Less than $300 | 9 (12.9%) | 0 (0.0%) |
| $300 to $499 | 34 (48.6%) | 5 (25.0%) |
| $500 to $799 | 18 (25.7%) | 0 (0.0%) |
| $800 to $999 | 5 (7.1%) | 7 (35.0%) |
| $1,000 to $1,499 | 4 (5.7%) | 1 (5.0%) |
| $1,500 to $1,999 | 0 (0.0%) | 0 (0.0%) |
| $2,000 to $2,499 | 0 (0.0%) | 0 (0.0%) |
| $2,500 to $2,999 | 0 (0.0%) | 0 (0.0%) |
| $3,000 or more | 0 (0.0%) | 0 (0.0%) |
| Total | 70 (100.0%) | 20 (100.0%) |
Physical Housing Characteristics in Tollette
Housing Structures in Tollette
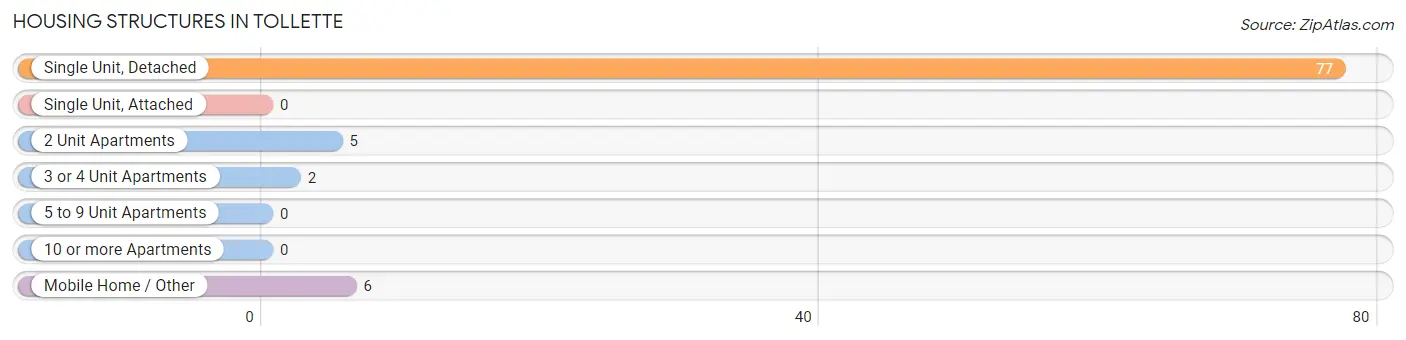
| Structure Type | # Housing Units | % Housing Units |
| Single Unit, Detached | 77 | 85.6% |
| Single Unit, Attached | 0 | 0.0% |
| 2 Unit Apartments | 5 | 5.6% |
| 3 or 4 Unit Apartments | 2 | 2.2% |
| 5 to 9 Unit Apartments | 0 | 0.0% |
| 10 or more Apartments | 0 | 0.0% |
| Mobile Home / Other | 6 | 6.7% |
| Total | 90 | 100.0% |
Housing Structures by Occupancy in Tollette
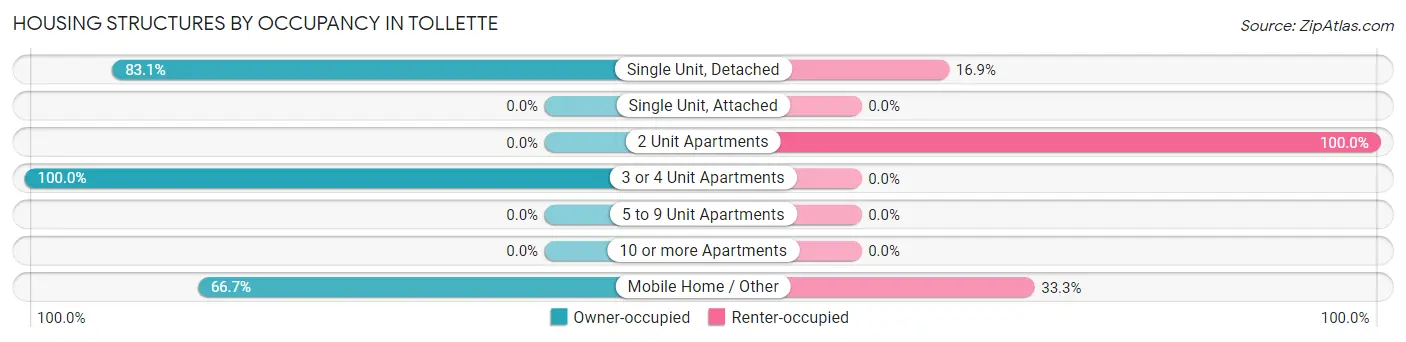
| Structure Type | Owner-occupied | Renter-occupied |
| Single Unit, Detached | 64 (83.1%) | 13 (16.9%) |
| Single Unit, Attached | 0 (0.0%) | 0 (0.0%) |
| 2 Unit Apartments | 0 (0.0%) | 5 (100.0%) |
| 3 or 4 Unit Apartments | 2 (100.0%) | 0 (0.0%) |
| 5 to 9 Unit Apartments | 0 (0.0%) | 0 (0.0%) |
| 10 or more Apartments | 0 (0.0%) | 0 (0.0%) |
| Mobile Home / Other | 4 (66.7%) | 2 (33.3%) |
| Total | 70 (77.8%) | 20 (22.2%) |
Housing Structures by Number of Rooms in Tollette
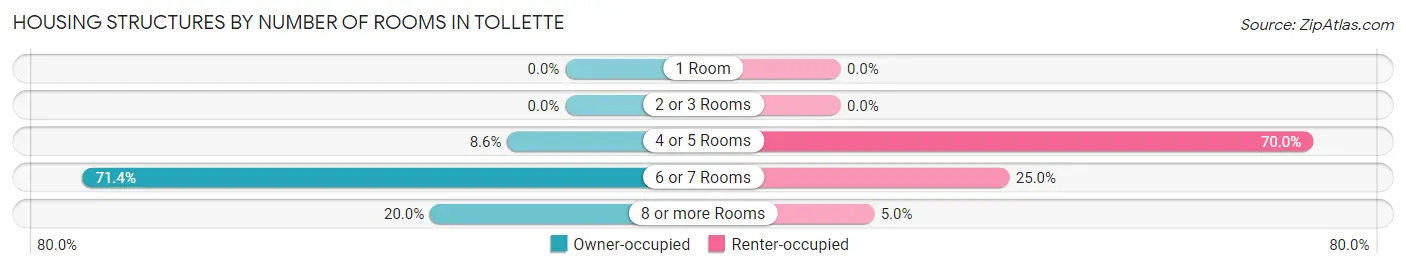
| Number of Rooms | Owner-occupied | Renter-occupied |
| 1 Room | 0 (0.0%) | 0 (0.0%) |
| 2 or 3 Rooms | 0 (0.0%) | 0 (0.0%) |
| 4 or 5 Rooms | 6 (8.6%) | 14 (70.0%) |
| 6 or 7 Rooms | 50 (71.4%) | 5 (25.0%) |
| 8 or more Rooms | 14 (20.0%) | 1 (5.0%) |
| Total | 70 (100.0%) | 20 (100.0%) |
Housing Structure by Heating Type in Tollette
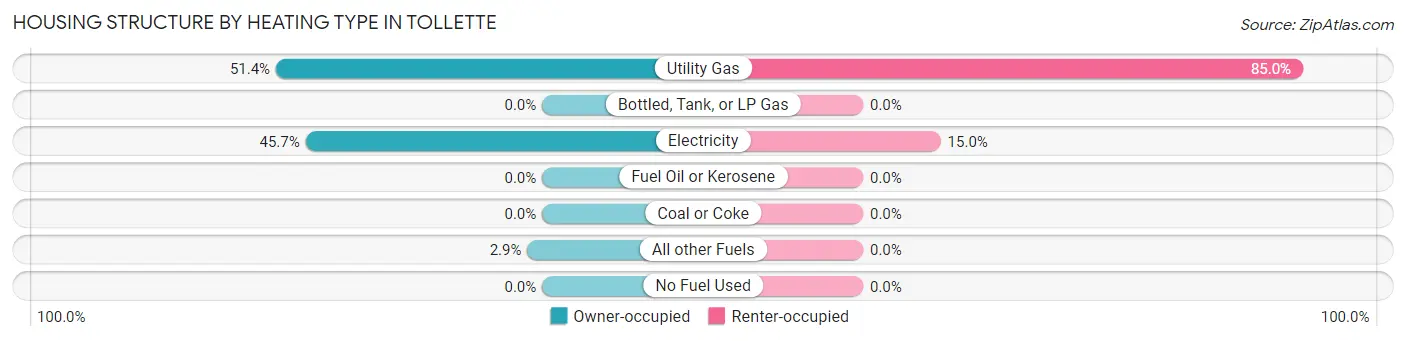
| Heating Type | Owner-occupied | Renter-occupied |
| Utility Gas | 36 (51.4%) | 17 (85.0%) |
| Bottled, Tank, or LP Gas | 0 (0.0%) | 0 (0.0%) |
| Electricity | 32 (45.7%) | 3 (15.0%) |
| Fuel Oil or Kerosene | 0 (0.0%) | 0 (0.0%) |
| Coal or Coke | 0 (0.0%) | 0 (0.0%) |
| All other Fuels | 2 (2.9%) | 0 (0.0%) |
| No Fuel Used | 0 (0.0%) | 0 (0.0%) |
| Total | 70 (100.0%) | 20 (100.0%) |
Household Vehicle Usage in Tollette
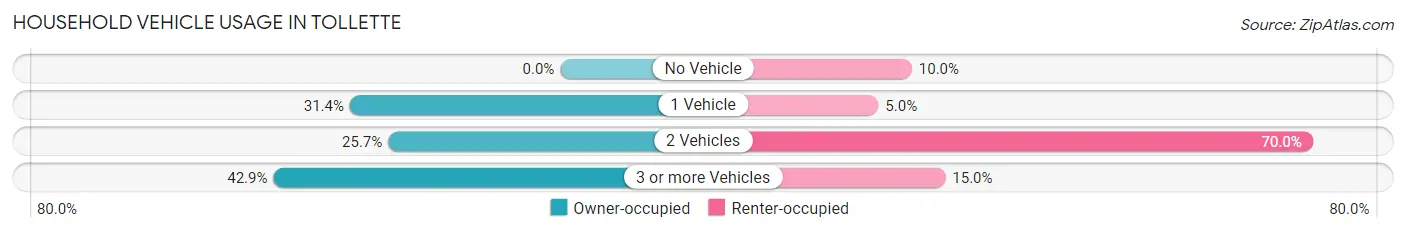
| Vehicles per Household | Owner-occupied | Renter-occupied |
| No Vehicle | 0 (0.0%) | 2 (10.0%) |
| 1 Vehicle | 22 (31.4%) | 1 (5.0%) |
| 2 Vehicles | 18 (25.7%) | 14 (70.0%) |
| 3 or more Vehicles | 30 (42.9%) | 3 (15.0%) |
| Total | 70 (100.0%) | 20 (100.0%) |
Real Estate & Mortgages in Tollette
Real Estate and Mortgage Overview in Tollette
| Characteristic | Without Mortgage | With Mortgage |
| Housing Units | 60 | 10 |
| Median Property Value | $88,600 | $0 |
| Median Household Income | $48,750 | $0 |
| Monthly Housing Costs | $392 | $0 |
| Real Estate Taxes | $467 | $1 |
Property Value by Mortgage Status in Tollette
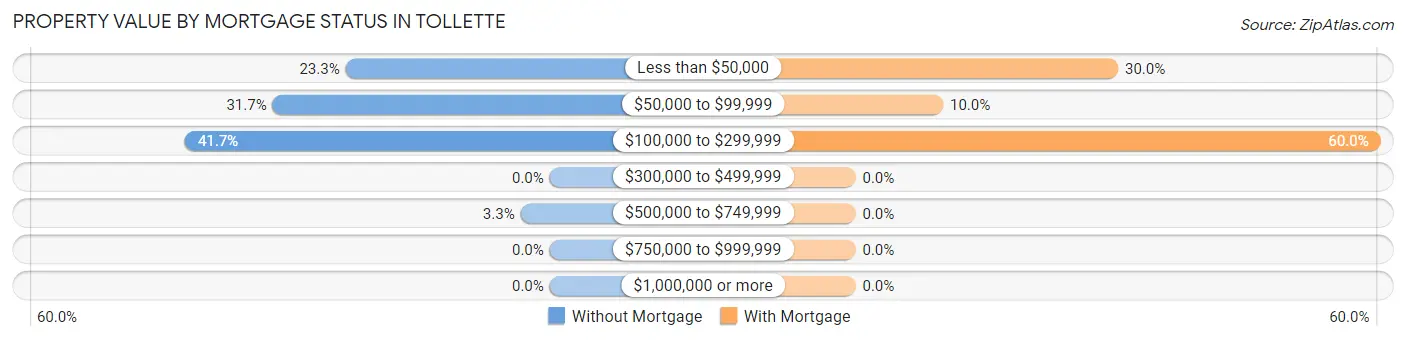
| Property Value | Without Mortgage | With Mortgage |
| Less than $50,000 | 14 (23.3%) | 3 (30.0%) |
| $50,000 to $99,999 | 19 (31.7%) | 1 (10.0%) |
| $100,000 to $299,999 | 25 (41.7%) | 6 (60.0%) |
| $300,000 to $499,999 | 0 (0.0%) | 0 (0.0%) |
| $500,000 to $749,999 | 2 (3.3%) | 0 (0.0%) |
| $750,000 to $999,999 | 0 (0.0%) | 0 (0.0%) |
| $1,000,000 or more | 0 (0.0%) | 0 (0.0%) |
| Total | 60 (100.0%) | 10 (100.0%) |
Household Income by Mortgage Status in Tollette
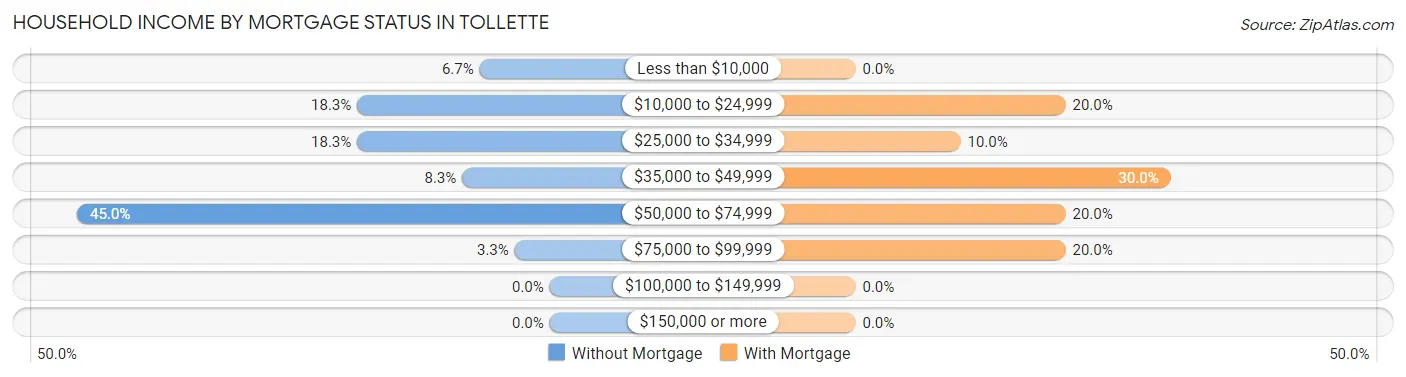
| Household Income | Without Mortgage | With Mortgage |
| Less than $10,000 | 4 (6.7%) | 0 (0.0%) |
| $10,000 to $24,999 | 11 (18.3%) | 2 (20.0%) |
| $25,000 to $34,999 | 11 (18.3%) | 1 (10.0%) |
| $35,000 to $49,999 | 5 (8.3%) | 3 (30.0%) |
| $50,000 to $74,999 | 27 (45.0%) | 2 (20.0%) |
| $75,000 to $99,999 | 2 (3.3%) | 2 (20.0%) |
| $100,000 to $149,999 | 0 (0.0%) | 0 (0.0%) |
| $150,000 or more | 0 (0.0%) | 0 (0.0%) |
| Total | 60 (100.0%) | 10 (100.0%) |
Property Value to Household Income Ratio in Tollette
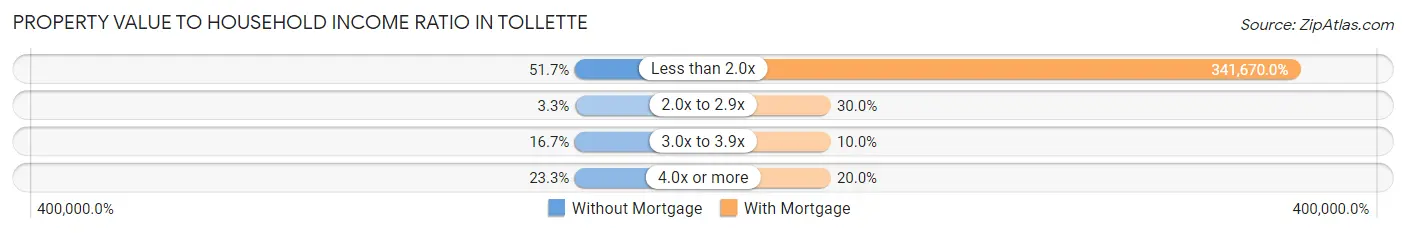
| Value-to-Income Ratio | Without Mortgage | With Mortgage |
| Less than 2.0x | 31 (51.7%) | 34,167 (341,670.0%) |
| 2.0x to 2.9x | 2 (3.3%) | 3 (30.0%) |
| 3.0x to 3.9x | 10 (16.7%) | 1 (10.0%) |
| 4.0x or more | 14 (23.3%) | 2 (20.0%) |
| Total | 60 (100.0%) | 10 (100.0%) |
Real Estate Taxes by Mortgage Status in Tollette
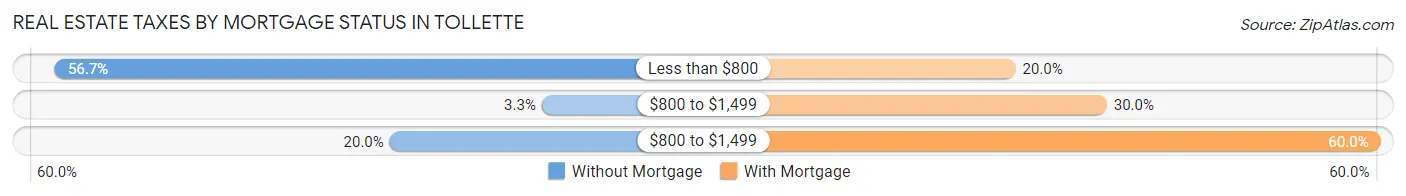
| Property Taxes | Without Mortgage | With Mortgage |
| Less than $800 | 34 (56.7%) | 2 (20.0%) |
| $800 to $1,499 | 2 (3.3%) | 3 (30.0%) |
| $800 to $1,499 | 12 (20.0%) | 6 (60.0%) |
| Total | 60 (100.0%) | 10 (100.0%) |
Health & Disability in Tollette
Health Insurance Coverage by Age in Tollette
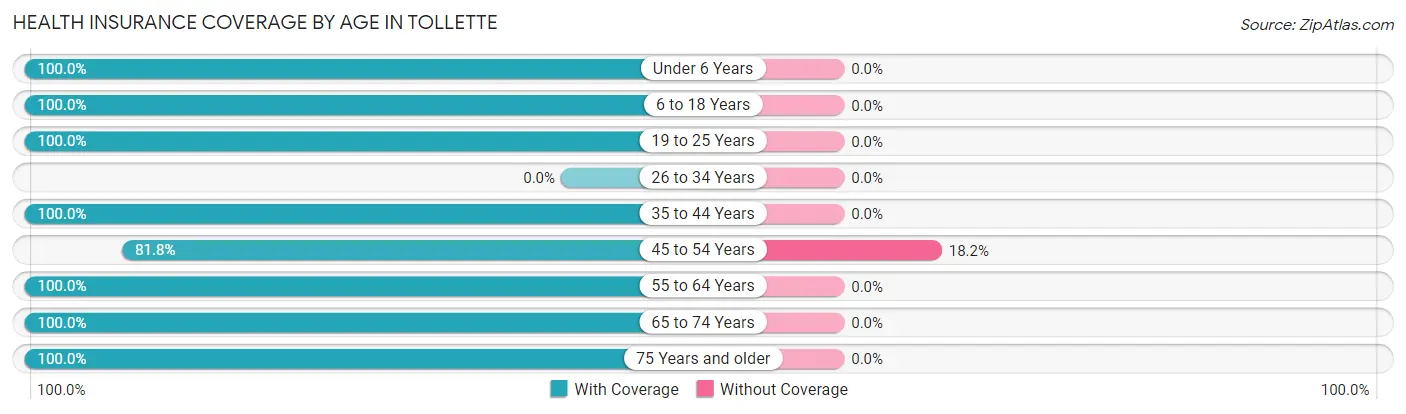
| Age Bracket | With Coverage | Without Coverage |
| Under 6 Years | 8 (100.0%) | 0 (0.0%) |
| 6 to 18 Years | 16 (100.0%) | 0 (0.0%) |
| 19 to 25 Years | 11 (100.0%) | 0 (0.0%) |
| 26 to 34 Years | 0 (0.0%) | 0 (0.0%) |
| 35 to 44 Years | 13 (100.0%) | 0 (0.0%) |
| 45 to 54 Years | 9 (81.8%) | 2 (18.2%) |
| 55 to 64 Years | 38 (100.0%) | 0 (0.0%) |
| 65 to 74 Years | 40 (100.0%) | 0 (0.0%) |
| 75 Years and older | 27 (100.0%) | 0 (0.0%) |
| Total | 162 (98.8%) | 2 (1.2%) |
Health Insurance Coverage by Citizenship Status in Tollette
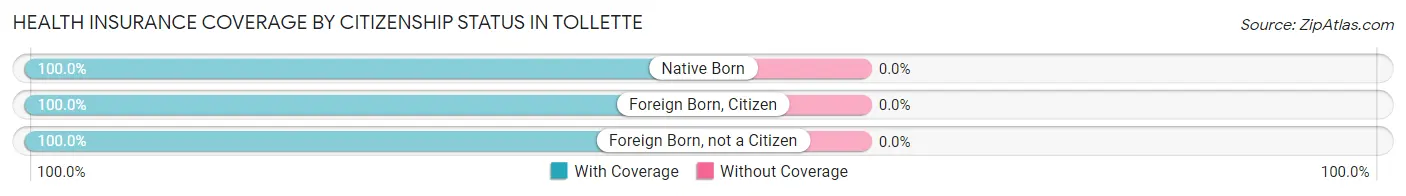
| Citizenship Status | With Coverage | Without Coverage |
| Native Born | 8 (100.0%) | 0 (0.0%) |
| Foreign Born, Citizen | 16 (100.0%) | 0 (0.0%) |
| Foreign Born, not a Citizen | 11 (100.0%) | 0 (0.0%) |
Health Insurance Coverage by Household Income in Tollette
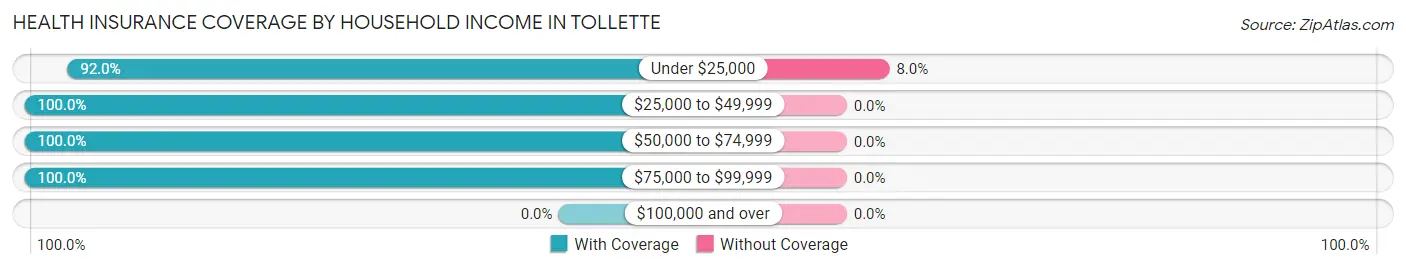
| Household Income | With Coverage | Without Coverage |
| Under $25,000 | 23 (92.0%) | 2 (8.0%) |
| $25,000 to $49,999 | 53 (100.0%) | 0 (0.0%) |
| $50,000 to $74,999 | 82 (100.0%) | 0 (0.0%) |
| $75,000 to $99,999 | 4 (100.0%) | 0 (0.0%) |
| $100,000 and over | 0 (0.0%) | 0 (0.0%) |
Public vs Private Health Insurance Coverage by Age in Tollette
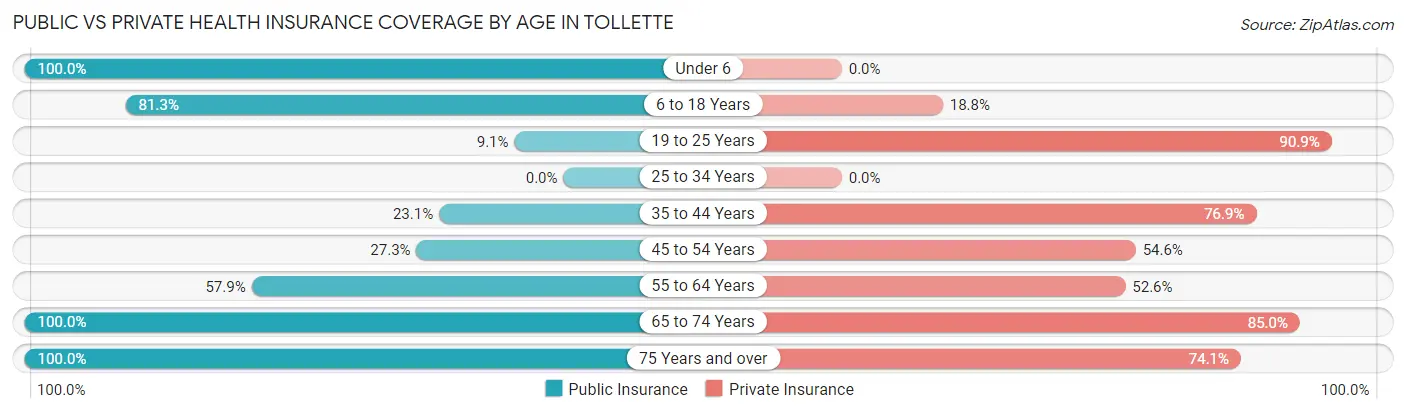
| Age Bracket | Public Insurance | Private Insurance |
| Under 6 | 8 (100.0%) | 0 (0.0%) |
| 6 to 18 Years | 13 (81.2%) | 3 (18.8%) |
| 19 to 25 Years | 1 (9.1%) | 10 (90.9%) |
| 25 to 34 Years | 0 (0.0%) | 0 (0.0%) |
| 35 to 44 Years | 3 (23.1%) | 10 (76.9%) |
| 45 to 54 Years | 3 (27.3%) | 6 (54.5%) |
| 55 to 64 Years | 22 (57.9%) | 20 (52.6%) |
| 65 to 74 Years | 40 (100.0%) | 34 (85.0%) |
| 75 Years and over | 27 (100.0%) | 20 (74.1%) |
| Total | 117 (71.3%) | 103 (62.8%) |
Disability Status by Sex by Age in Tollette
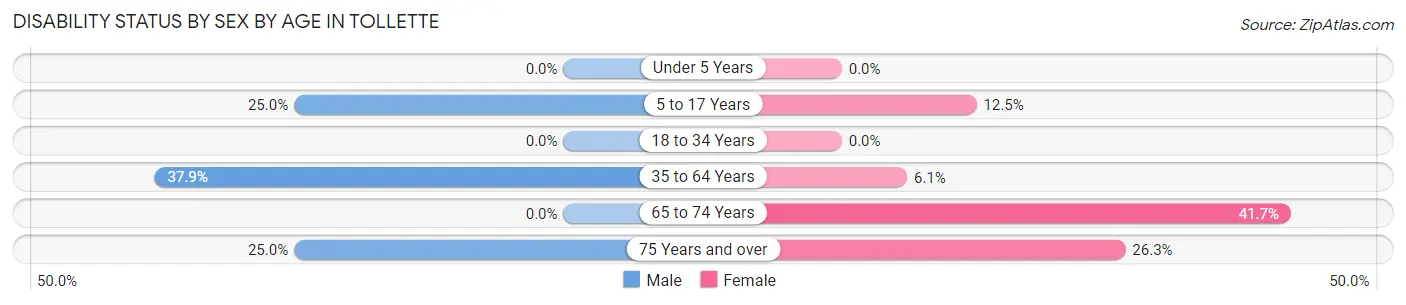
| Age Bracket | Male | Female |
| Under 5 Years | 0 (0.0%) | 0 (0.0%) |
| 5 to 17 Years | 2 (25.0%) | 1 (12.5%) |
| 18 to 34 Years | 0 (0.0%) | 0 (0.0%) |
| 35 to 64 Years | 11 (37.9%) | 2 (6.1%) |
| 65 to 74 Years | 0 (0.0%) | 10 (41.7%) |
| 75 Years and over | 2 (25.0%) | 5 (26.3%) |
Disability Class by Sex by Age in Tollette
Disability Class: Hearing Difficulty
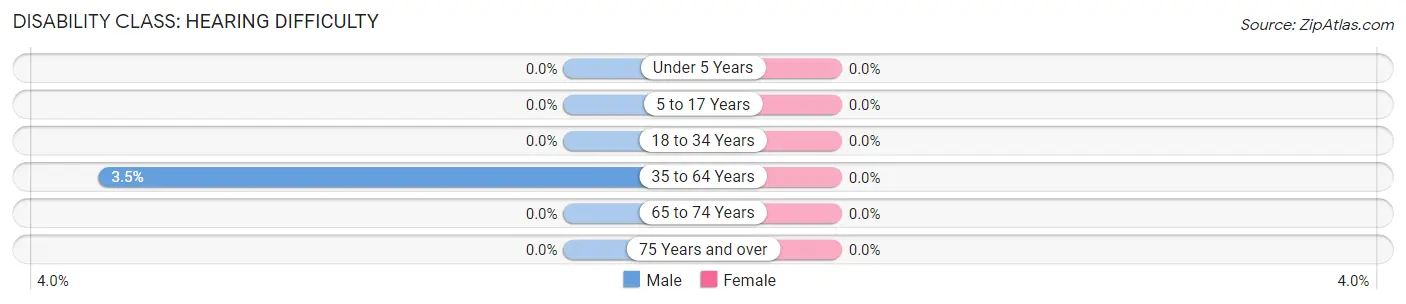
| Age Bracket | Male | Female |
| Under 5 Years | 0 (0.0%) | 0 (0.0%) |
| 5 to 17 Years | 0 (0.0%) | 0 (0.0%) |
| 18 to 34 Years | 0 (0.0%) | 0 (0.0%) |
| 35 to 64 Years | 1 (3.5%) | 0 (0.0%) |
| 65 to 74 Years | 0 (0.0%) | 0 (0.0%) |
| 75 Years and over | 0 (0.0%) | 0 (0.0%) |
Disability Class: Vision Difficulty
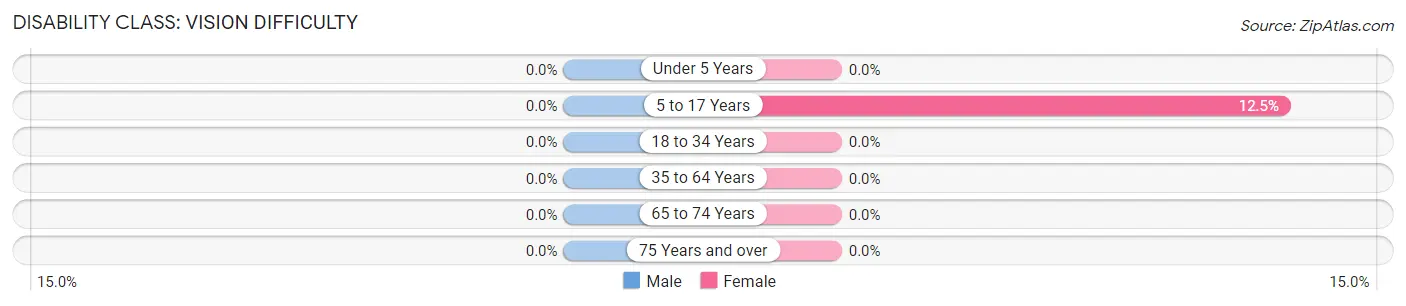
| Age Bracket | Male | Female |
| Under 5 Years | 0 (0.0%) | 0 (0.0%) |
| 5 to 17 Years | 0 (0.0%) | 1 (12.5%) |
| 18 to 34 Years | 0 (0.0%) | 0 (0.0%) |
| 35 to 64 Years | 0 (0.0%) | 0 (0.0%) |
| 65 to 74 Years | 0 (0.0%) | 0 (0.0%) |
| 75 Years and over | 0 (0.0%) | 0 (0.0%) |
Disability Class: Cognitive Difficulty
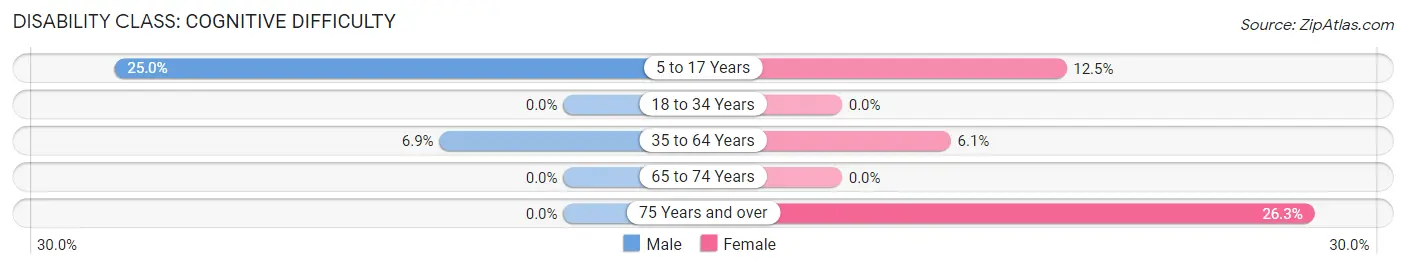
| Age Bracket | Male | Female |
| 5 to 17 Years | 2 (25.0%) | 1 (12.5%) |
| 18 to 34 Years | 0 (0.0%) | 0 (0.0%) |
| 35 to 64 Years | 2 (6.9%) | 2 (6.1%) |
| 65 to 74 Years | 0 (0.0%) | 0 (0.0%) |
| 75 Years and over | 0 (0.0%) | 5 (26.3%) |
Disability Class: Ambulatory Difficulty
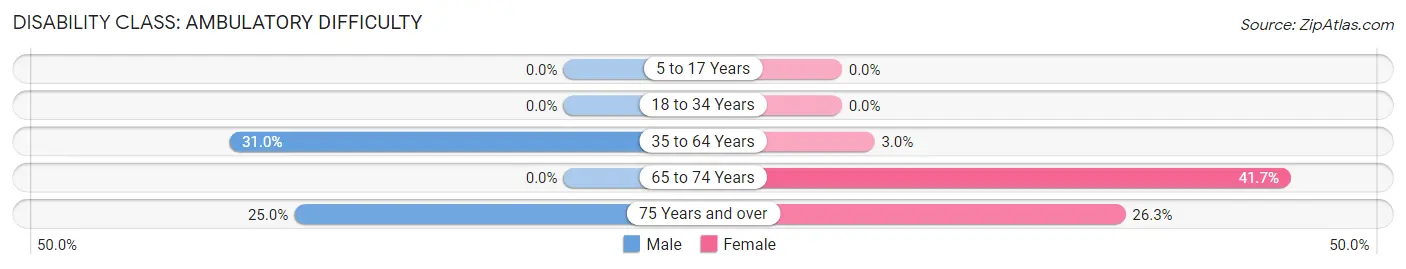
| Age Bracket | Male | Female |
| 5 to 17 Years | 0 (0.0%) | 0 (0.0%) |
| 18 to 34 Years | 0 (0.0%) | 0 (0.0%) |
| 35 to 64 Years | 9 (31.0%) | 1 (3.0%) |
| 65 to 74 Years | 0 (0.0%) | 10 (41.7%) |
| 75 Years and over | 2 (25.0%) | 5 (26.3%) |
Disability Class: Self-Care Difficulty
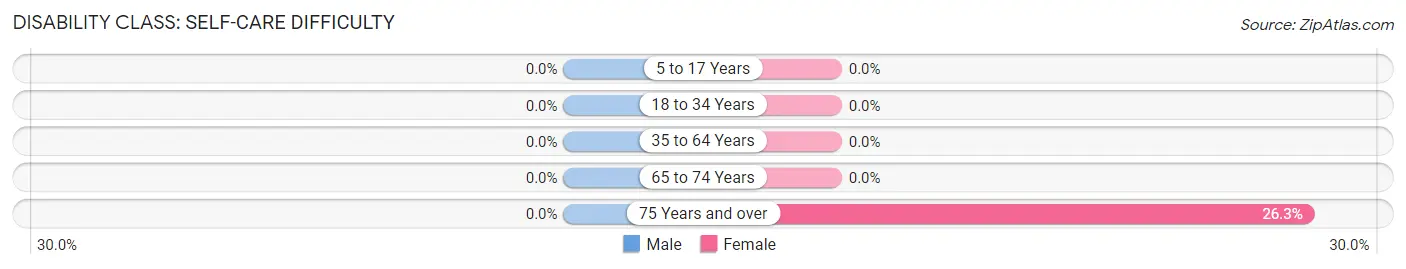
| Age Bracket | Male | Female |
| 5 to 17 Years | 0 (0.0%) | 0 (0.0%) |
| 18 to 34 Years | 0 (0.0%) | 0 (0.0%) |
| 35 to 64 Years | 0 (0.0%) | 0 (0.0%) |
| 65 to 74 Years | 0 (0.0%) | 0 (0.0%) |
| 75 Years and over | 0 (0.0%) | 5 (26.3%) |
Technology Access in Tollette
Computing Device Access in Tollette
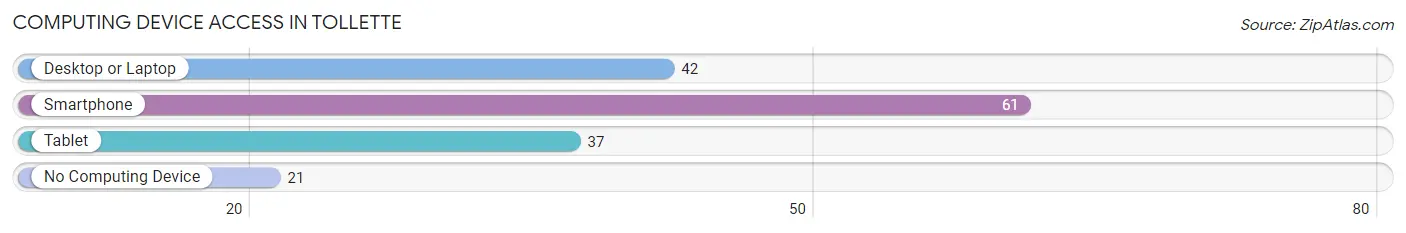
| Device Type | # Households | % Households |
| Desktop or Laptop | 42 | 46.7% |
| Smartphone | 61 | 67.8% |
| Tablet | 37 | 41.1% |
| No Computing Device | 21 | 23.3% |
| Total | 90 | 100.0% |
Internet Access in Tollette
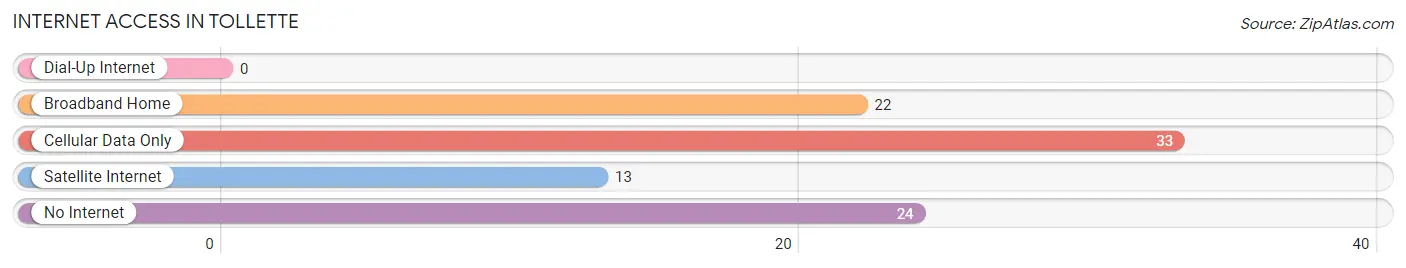
| Internet Type | # Households | % Households |
| Dial-Up Internet | 0 | 0.0% |
| Broadband Home | 22 | 24.4% |
| Cellular Data Only | 33 | 36.7% |
| Satellite Internet | 13 | 14.4% |
| No Internet | 24 | 26.7% |
| Total | 90 | 100.0% |
Tollette Summary
Tollette is a small town located in Howard County, Arkansas. It is situated in the foothills of the Ouachita Mountains, approximately 20 miles south of the Arkansas-Oklahoma border. The town was founded in 1883 and has a population of approximately 500 people.
History
Tollette was founded in 1883 by a group of settlers from Tennessee. The town was named after the first postmaster, William Tollette. The first post office was established in 1884. The town was incorporated in 1887 and the first mayor was elected in 1888.
The town grew slowly but steadily over the years. In the early 1900s, the town was home to several businesses, including a general store, a blacksmith shop, a sawmill, and a cotton gin. The town also had a school, a church, and a hotel.
In the 1920s, the town experienced a period of growth and prosperity. The population increased from 500 to 1,000 people. The town was home to several businesses, including a bank, a movie theater, a drug store, and a grocery store.
In the 1940s, the town experienced a period of decline. The population decreased to 500 people and many of the businesses closed. The town was also affected by the Great Depression and World War II.
In the 1950s, the town experienced a period of revitalization. The population increased to 1,000 people and several new businesses opened. The town was also home to a new school and a new church.
In the 1960s, the town experienced a period of growth and prosperity. The population increased to 1,500 people and several new businesses opened. The town was also home to a new hospital and a new library.
In the 1970s, the town experienced a period of decline. The population decreased to 1,000 people and many of the businesses closed. The town was also affected by the oil crisis and the recession.
In the 1980s, the town experienced a period of revitalization. The population increased to 1,500 people and several new businesses opened. The town was also home to a new school and a new church.
In the 1990s, the town experienced a period of growth and prosperity. The population increased to 2,000 people and several new businesses opened. The town was also home to a new hospital and a new library.
Geography
Tollette is located in the foothills of the Ouachita Mountains in Howard County, Arkansas. The town is situated approximately 20 miles south of the Arkansas-Oklahoma border. The town is located on the banks of the Little Missouri River.
The town is surrounded by rolling hills and forests. The climate is mild and humid, with hot summers and mild winters. The average annual temperature is around 70 degrees Fahrenheit.
Economy
The economy of Tollette is largely based on agriculture and tourism. The town is home to several farms and ranches, which produce a variety of crops and livestock. The town is also home to several tourist attractions, including a museum, a historic district, and a nature center.
The town is also home to several businesses, including a bank, a grocery store, a hardware store, and a restaurant. The town is also home to a post office and a library.
Demographics
As of the 2010 census, the population of Tollette was 2,072. The racial makeup of the town was 95.3% White, 0.7% African American, 0.3% Native American, 0.2% Asian, 0.1% Pacific Islander, and 3.4% from other races.
The median household income in Tollette was $31,250, and the median family income was $37,500. The per capita income was $17,845. About 15.3% of the population was below the poverty line.
Common Questions
What is Per Capita Income in Tollette?
Per Capita income in Tollette is $22,267.
What is the Median Family Income in Tollette?
Median Family Income in Tollette is $63,295.
What is the Median Household income in Tollette?
Median Household Income in Tollette is $40,500.
What is Inequality or Gini Index in Tollette?
Inequality or Gini Index in Tollette is 0.30.
What is the Total Population of Tollette?
Total Population of Tollette is 164.
What is the Total Male Population of Tollette?
Total Male Population of Tollette is 79.
What is the Total Female Population of Tollette?
Total Female Population of Tollette is 85.
What is the Ratio of Males per 100 Females in Tollette?
There are 92.94 Males per 100 Females in Tollette.
What is the Ratio of Females per 100 Males in Tollette?
There are 107.59 Females per 100 Males in Tollette.
What is the Median Population Age in Tollette?
Median Population Age in Tollette is 62.1 Years.
What is the Average Family Size in Tollette
Average Family Size in Tollette is 2.2 People.
What is the Average Household Size in Tollette
Average Household Size in Tollette is 1.8 People.
How Large is the Labor Force in Tollette?
There are 67 People in the Labor Forcein in Tollette.
What is the Percentage of People in the Labor Force in Tollette?
45.6% of People are in the Labor Force in Tollette.
What is the Unemployment Rate in Tollette?
Unemployment Rate in Tollette is 20.9%.