Kensett, AR Map & Demographics
Kensett Map
Kensett Overview
$17,495
PER CAPITA INCOME
$29,728
AVG FAMILY INCOME
$28,225
AVG HOUSEHOLD INCOME
34.7%
WAGE / INCOME GAP [ % ]
65.3¢/ $1
WAGE / INCOME GAP [ $ ]
0.42
INEQUALITY / GINI INDEX
2,044
TOTAL POPULATION
1,029
MALE POPULATION
1,015
FEMALE POPULATION
101.38
MALES / 100 FEMALES
98.64
FEMALES / 100 MALES
37.5
MEDIAN AGE
3.5
AVG FAMILY SIZE
2.7
AVG HOUSEHOLD SIZE
740
LABOR FORCE [ PEOPLE ]
46.9%
PERCENT IN LABOR FORCE
7.4%
UNEMPLOYMENT RATE
Kensett Zip Codes
Kensett Area Codes
Income in Kensett
Income Overview in Kensett
Per Capita Income in Kensett is $17,495, while median incomes of families and households are $29,728 and $28,225 respectively.
| Characteristic | Number | Measure |
| Per Capita Income | 2,044 | $17,495 |
| Median Family Income | 479 | $29,728 |
| Mean Family Income | 479 | $42,229 |
| Median Household Income | 760 | $28,225 |
| Mean Household Income | 760 | $37,013 |
| Income Deficit | 479 | $0 |
| Wage / Income Gap (%) | 2,044 | 34.75% |
| Wage / Income Gap ($) | 2,044 | 65.25¢ per $1 |
| Gini / Inequality Index | 2,044 | 0.42 |
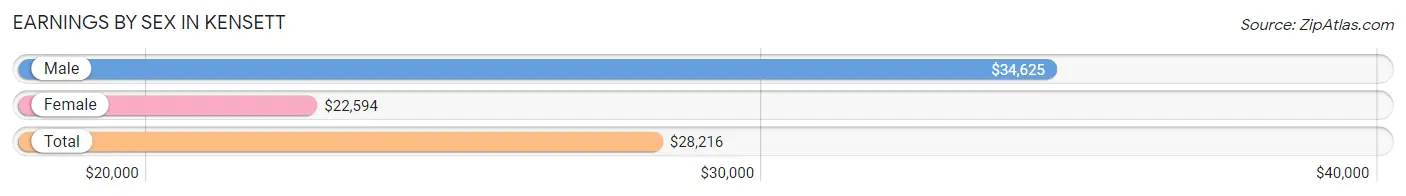
Earnings by Sex in Kensett
Average Earnings in Kensett are $28,216, $34,625 for men and $22,594 for women, a difference of 34.7%.
| Sex | Number | Average Earnings |
| Male | 454 (57.3%) | $34,625 |
| Female | 339 (42.7%) | $22,594 |
| Total | 793 (100.0%) | $28,216 |
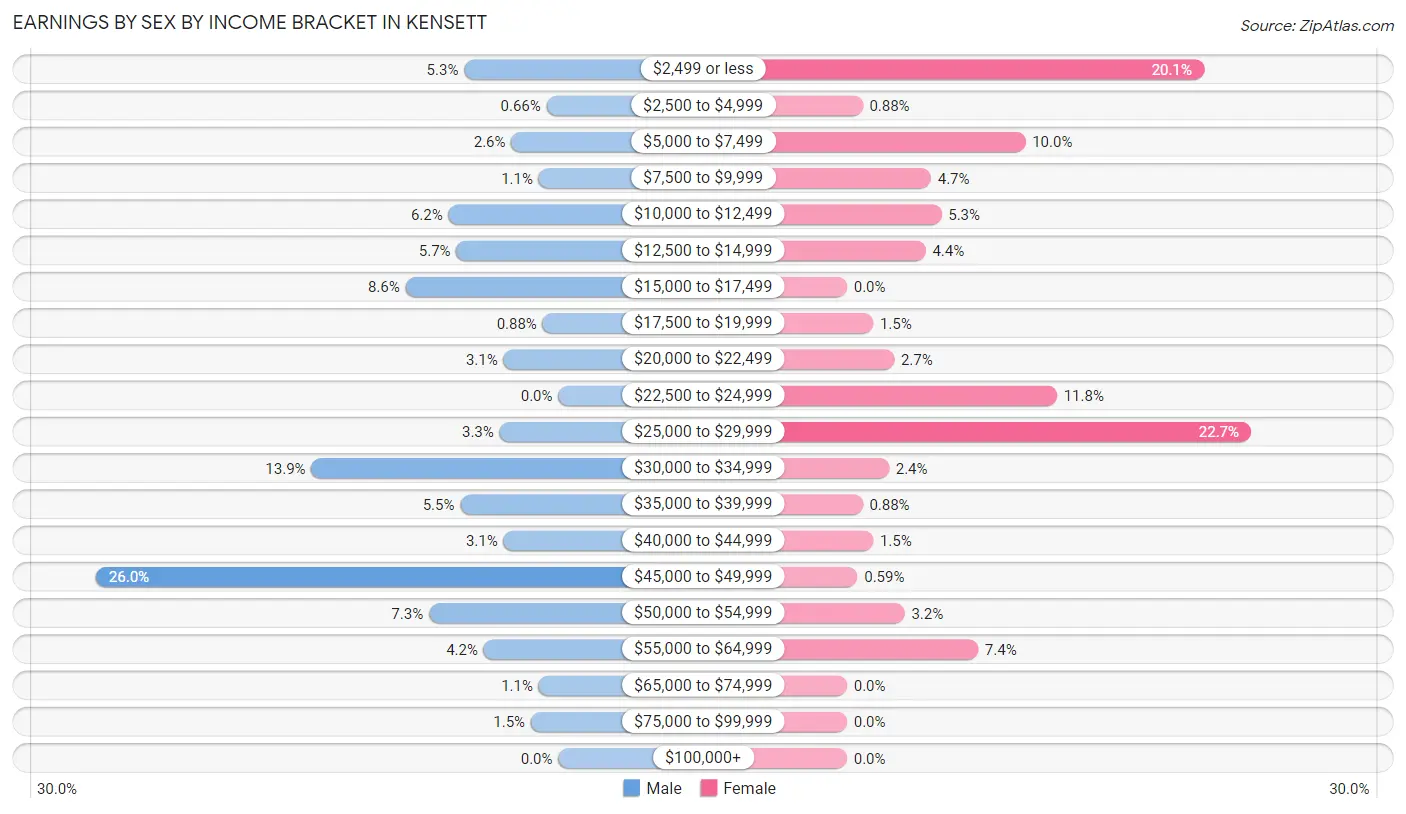
Earnings by Sex by Income Bracket in Kensett
The most common earnings brackets in Kensett are $45,000 to $49,999 for men (118 | 26.0%) and $25,000 to $29,999 for women (77 | 22.7%).
| Income | Male | Female |
| $2,499 or less | 24 (5.3%) | 68 (20.1%) |
| $2,500 to $4,999 | 3 (0.7%) | 3 (0.9%) |
| $5,000 to $7,499 | 12 (2.6%) | 34 (10.0%) |
| $7,500 to $9,999 | 5 (1.1%) | 16 (4.7%) |
| $10,000 to $12,499 | 28 (6.2%) | 18 (5.3%) |
| $12,500 to $14,999 | 26 (5.7%) | 15 (4.4%) |
| $15,000 to $17,499 | 39 (8.6%) | 0 (0.0%) |
| $17,500 to $19,999 | 4 (0.9%) | 5 (1.5%) |
| $20,000 to $22,499 | 14 (3.1%) | 9 (2.6%) |
| $22,500 to $24,999 | 0 (0.0%) | 40 (11.8%) |
| $25,000 to $29,999 | 15 (3.3%) | 77 (22.7%) |
| $30,000 to $34,999 | 63 (13.9%) | 8 (2.4%) |
| $35,000 to $39,999 | 25 (5.5%) | 3 (0.9%) |
| $40,000 to $44,999 | 14 (3.1%) | 5 (1.5%) |
| $45,000 to $49,999 | 118 (26.0%) | 2 (0.6%) |
| $50,000 to $54,999 | 33 (7.3%) | 11 (3.2%) |
| $55,000 to $64,999 | 19 (4.2%) | 25 (7.4%) |
| $65,000 to $74,999 | 5 (1.1%) | 0 (0.0%) |
| $75,000 to $99,999 | 7 (1.5%) | 0 (0.0%) |
| $100,000+ | 0 (0.0%) | 0 (0.0%) |
| Total | 454 (100.0%) | 339 (100.0%) |
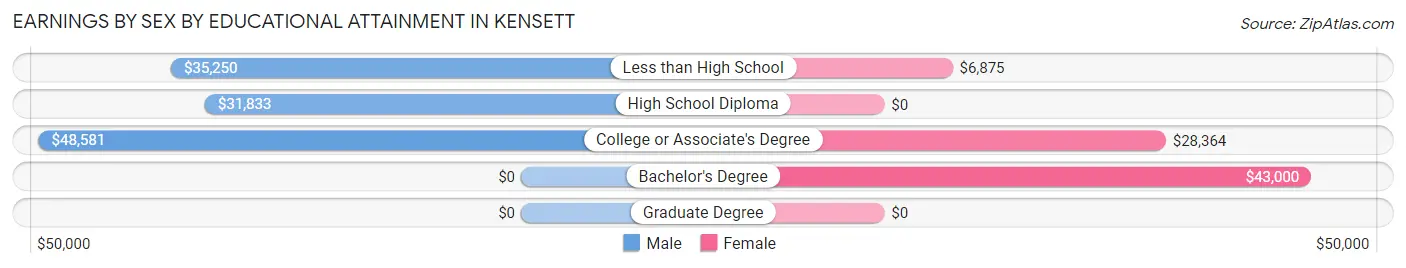
Earnings by Sex by Educational Attainment in Kensett
Average earnings in Kensett are $36,063 for men and $23,250 for women, a difference of 35.5%. Men with an educational attainment of college or associate's degree enjoy the highest average annual earnings of $48,581, while those with high school diploma education earn the least with $31,833. Women with an educational attainment of bachelor's degree earn the most with the average annual earnings of $43,000, while those with less than high school education have the smallest earnings of $6,875.
| Educational Attainment | Male Income | Female Income |
| Less than High School | $35,250 | $6,875 |
| High School Diploma | $31,833 | $0 |
| College or Associate's Degree | $48,581 | $28,364 |
| Bachelor's Degree | - | - |
| Graduate Degree | - | - |
| Total | $36,063 | $23,250 |
Family Income in Kensett
Family Income Brackets in Kensett
According to the Kensett family income data, there are 117 families falling into the $35,000 to $49,999 income range, which is the most common income bracket and makes up 24.4% of all families.
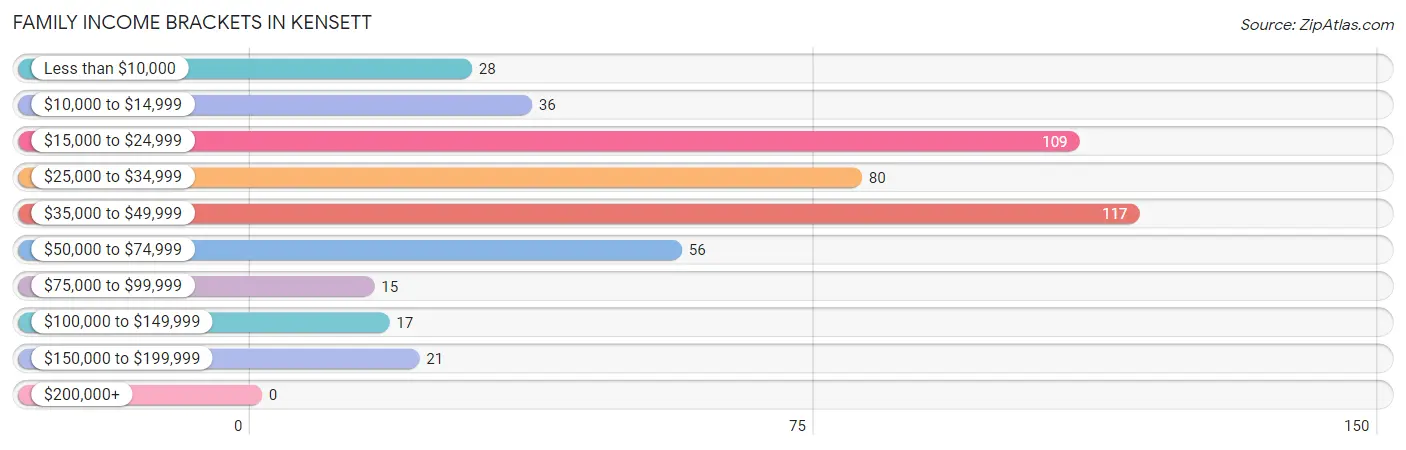
| Income Bracket | # Families | % Families |
| Less than $10,000 | 28 | 5.8% |
| $10,000 to $14,999 | 36 | 7.5% |
| $15,000 to $24,999 | 109 | 22.8% |
| $25,000 to $34,999 | 80 | 16.7% |
| $35,000 to $49,999 | 117 | 24.4% |
| $50,000 to $74,999 | 56 | 11.7% |
| $75,000 to $99,999 | 15 | 3.1% |
| $100,000 to $149,999 | 17 | 3.5% |
| $150,000 to $199,999 | 21 | 4.4% |
| $200,000+ | 0 | 0.0% |
Family Income by Famaliy Size in Kensett
3-person families (61 | 12.7%) account for the highest median family income in Kensett with $37,917 per family, while 2-person families (276 | 57.6%) have the highest median income of $14,529 per family member.
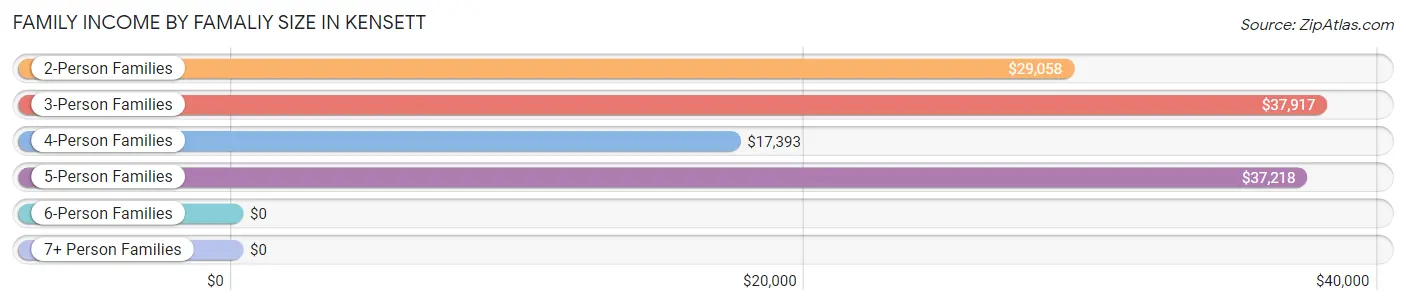
| Income Bracket | # Families | Median Income |
| 2-Person Families | 276 (57.6%) | $29,058 |
| 3-Person Families | 61 (12.7%) | $37,917 |
| 4-Person Families | 77 (16.1%) | $17,393 |
| 5-Person Families | 55 (11.5%) | $37,218 |
| 6-Person Families | 7 (1.5%) | $0 |
| 7+ Person Families | 3 (0.6%) | $0 |
| Total | 479 (100.0%) | $29,728 |
Family Income by Number of Earners in Kensett
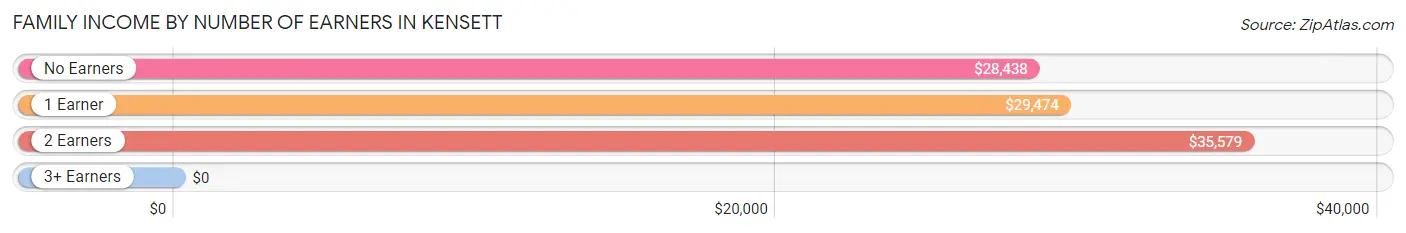
| Number of Earners | # Families | Median Income |
| No Earners | 109 (22.8%) | $28,438 |
| 1 Earner | 246 (51.4%) | $29,474 |
| 2 Earners | 119 (24.8%) | $35,579 |
| 3+ Earners | 5 (1.0%) | $0 |
| Total | 479 (100.0%) | $29,728 |
Household Income in Kensett
Household Income Brackets in Kensett
With 193 households falling in the category, the $15,000 to $24,999 income range is the most frequent in Kensett, accounting for 25.4% of all households.
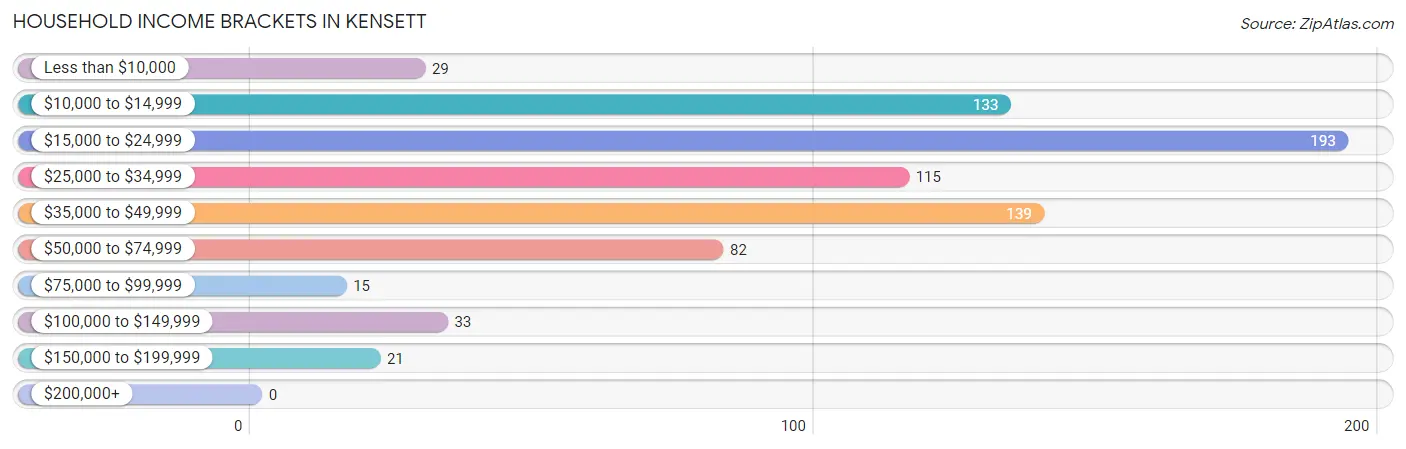
| Income Bracket | # Households | % Households |
| Less than $10,000 | 29 | 3.8% |
| $10,000 to $14,999 | 133 | 17.5% |
| $15,000 to $24,999 | 193 | 25.4% |
| $25,000 to $34,999 | 115 | 15.1% |
| $35,000 to $49,999 | 139 | 18.3% |
| $50,000 to $74,999 | 82 | 10.8% |
| $75,000 to $99,999 | 15 | 2.0% |
| $100,000 to $149,999 | 33 | 4.3% |
| $150,000 to $199,999 | 21 | 2.8% |
| $200,000+ | 0 | 0.0% |
Household Income by Householder Age in Kensett
The median household income in Kensett is $28,225, with the highest median household income of $29,114 found in the 25 to 44 years age bracket for the primary householder. A total of 243 households (32.0%) fall into this category. Meanwhile, the 15 to 24 years age bracket for the primary householder has the lowest median household income of $0, with 3 households (0.4%) in this group.
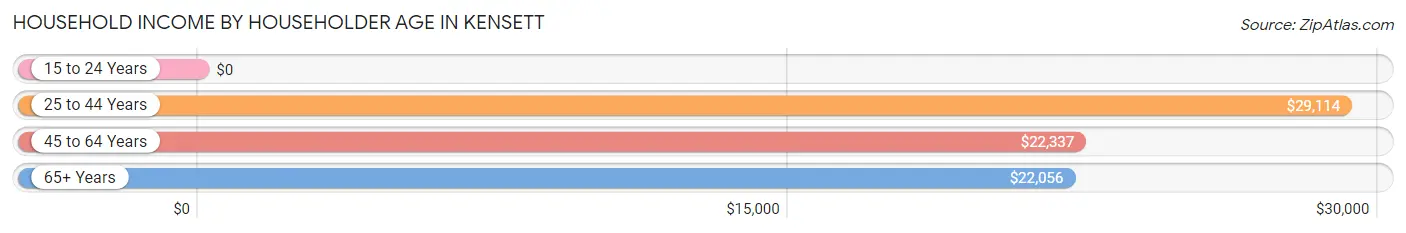
| Income Bracket | # Households | Median Income |
| 15 to 24 Years | 3 (0.4%) | $0 |
| 25 to 44 Years | 243 (32.0%) | $29,114 |
| 45 to 64 Years | 191 (25.1%) | $22,337 |
| 65+ Years | 323 (42.5%) | $22,056 |
| Total | 760 (100.0%) | $28,225 |
Poverty in Kensett
Income Below Poverty by Sex and Age in Kensett
With 26.3% poverty level for males and 31.6% for females among the residents of Kensett, under 5 year old males and 15 year old females are the most vulnerable to poverty, with 25 males (100.0%) and 2 females (100.0%) in their respective age groups living below the poverty level.
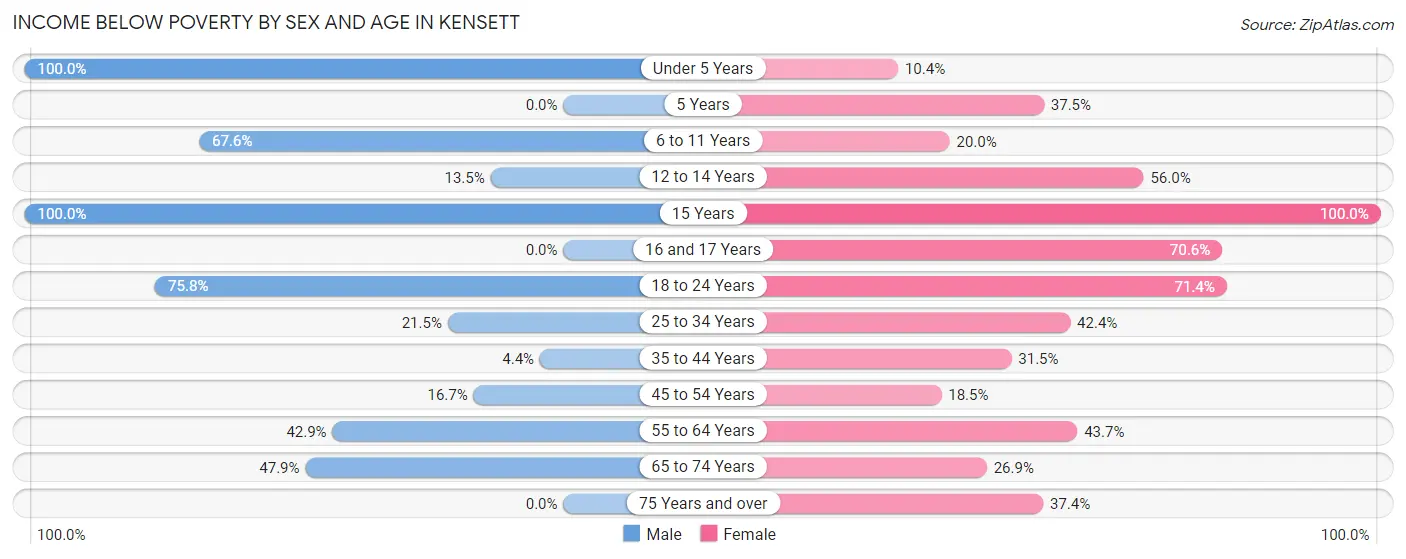
| Age Bracket | Male | Female |
| Under 5 Years | 25 (100.0%) | 12 (10.4%) |
| 5 Years | 0 (0.0%) | 3 (37.5%) |
| 6 to 11 Years | 48 (67.6%) | 28 (20.0%) |
| 12 to 14 Years | 5 (13.5%) | 14 (56.0%) |
| 15 Years | 3 (100.0%) | 2 (100.0%) |
| 16 and 17 Years | 0 (0.0%) | 12 (70.6%) |
| 18 to 24 Years | 25 (75.8%) | 25 (71.4%) |
| 25 to 34 Years | 53 (21.5%) | 39 (42.4%) |
| 35 to 44 Years | 4 (4.3%) | 45 (31.5%) |
| 45 to 54 Years | 17 (16.7%) | 12 (18.5%) |
| 55 to 64 Years | 51 (42.9%) | 52 (43.7%) |
| 65 to 74 Years | 34 (47.9%) | 46 (26.9%) |
| 75 Years and over | 0 (0.0%) | 31 (37.3%) |
| Total | 265 (26.3%) | 321 (31.6%) |
Income Above Poverty by Sex and Age in Kensett
According to the poverty statistics in Kensett, males aged 5 years and females aged under 5 years are the age groups that are most secure financially, with 100.0% of males and 89.6% of females in these age groups living above the poverty line.
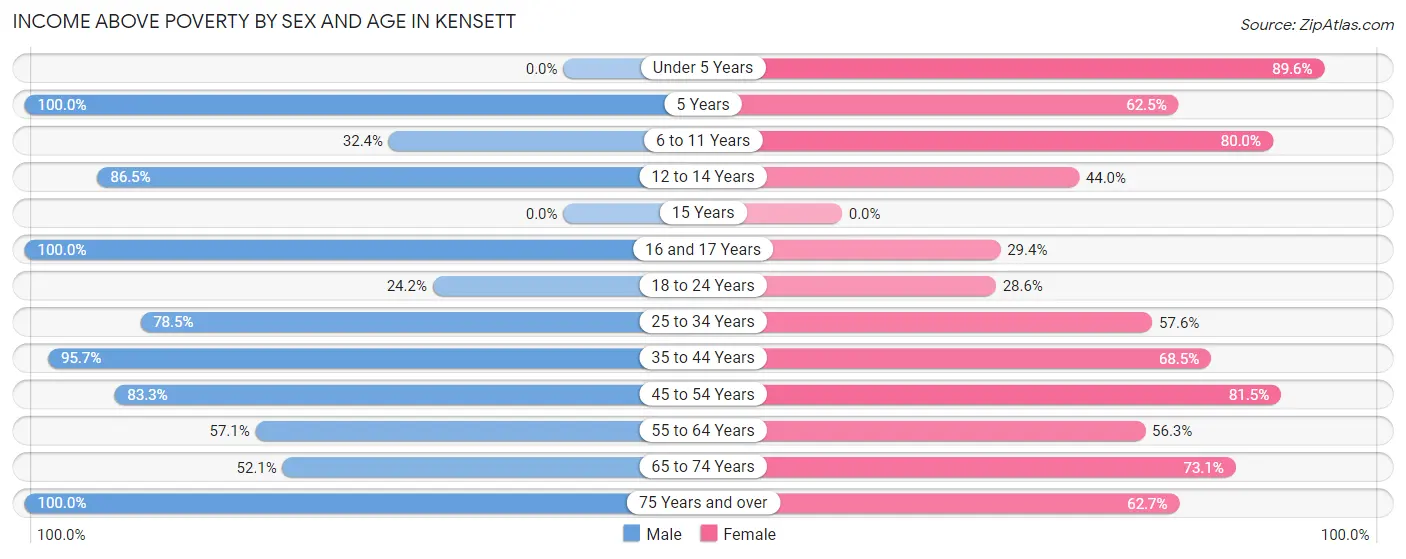
| Age Bracket | Male | Female |
| Under 5 Years | 0 (0.0%) | 103 (89.6%) |
| 5 Years | 20 (100.0%) | 5 (62.5%) |
| 6 to 11 Years | 23 (32.4%) | 112 (80.0%) |
| 12 to 14 Years | 32 (86.5%) | 11 (44.0%) |
| 15 Years | 0 (0.0%) | 0 (0.0%) |
| 16 and 17 Years | 60 (100.0%) | 5 (29.4%) |
| 18 to 24 Years | 8 (24.2%) | 10 (28.6%) |
| 25 to 34 Years | 194 (78.5%) | 53 (57.6%) |
| 35 to 44 Years | 88 (95.7%) | 98 (68.5%) |
| 45 to 54 Years | 85 (83.3%) | 53 (81.5%) |
| 55 to 64 Years | 68 (57.1%) | 67 (56.3%) |
| 65 to 74 Years | 37 (52.1%) | 125 (73.1%) |
| 75 Years and over | 128 (100.0%) | 52 (62.6%) |
| Total | 743 (73.7%) | 694 (68.4%) |
Income Below Poverty Among Married-Couple Families in Kensett
The poverty statistics for married-couple families in Kensett show that 37.9% or 103 of the total 272 families live below the poverty line. Families with 5 or more children have the highest poverty rate of 100.0%, comprising of 3 families. On the other hand, families with 3 or 4 children have the lowest poverty rate of 11.6%, which includes 5 families.
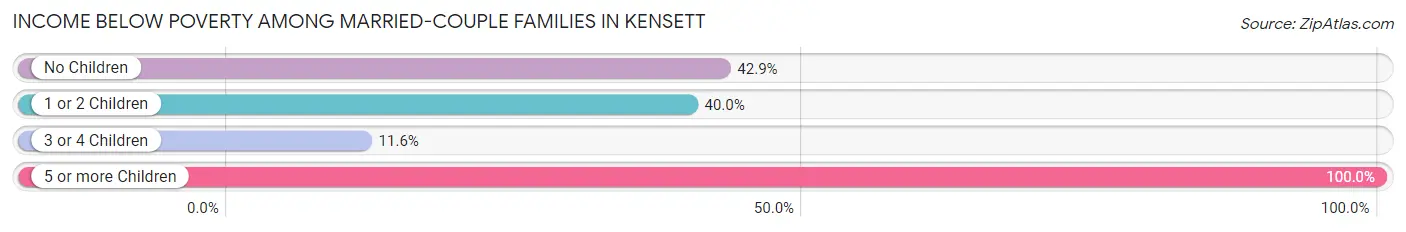
| Children | Above Poverty | Below Poverty |
| No Children | 92 (57.1%) | 69 (42.9%) |
| 1 or 2 Children | 39 (60.0%) | 26 (40.0%) |
| 3 or 4 Children | 38 (88.4%) | 5 (11.6%) |
| 5 or more Children | 0 (0.0%) | 3 (100.0%) |
| Total | 169 (62.1%) | 103 (37.9%) |
Income Below Poverty Among Single-Parent Households in Kensett
According to the poverty data in Kensett, 38.7% or 24 single-father households and 26.9% or 39 single-mother households are living below the poverty line. Among single-father households, those with 1 or 2 children have the highest poverty rate, with 24 households (68.6%) experiencing poverty. Likewise, among single-mother households, those with 1 or 2 children have the highest poverty rate, with 35 households (35.3%) falling below the poverty line.
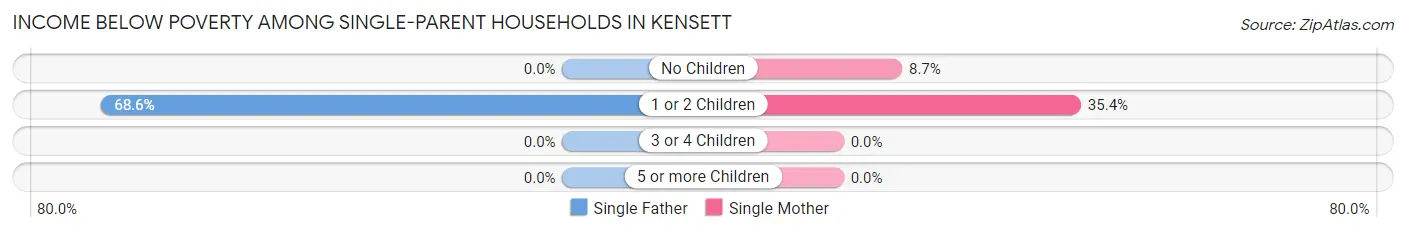
| Children | Single Father | Single Mother |
| No Children | 0 (0.0%) | 4 (8.7%) |
| 1 or 2 Children | 24 (68.6%) | 35 (35.3%) |
| 3 or 4 Children | 0 (0.0%) | 0 (0.0%) |
| 5 or more Children | 0 (0.0%) | 0 (0.0%) |
| Total | 24 (38.7%) | 39 (26.9%) |
Income Below Poverty Among Married-Couple vs Single-Parent Households in Kensett
The poverty data for Kensett shows that 103 of the married-couple family households (37.9%) and 63 of the single-parent households (30.4%) are living below the poverty level. Within the married-couple family households, those with 5 or more children have the highest poverty rate, with 3 households (100.0%) falling below the poverty line. Among the single-parent households, those with 1 or 2 children have the highest poverty rate, with 59 household (44.0%) living below poverty.
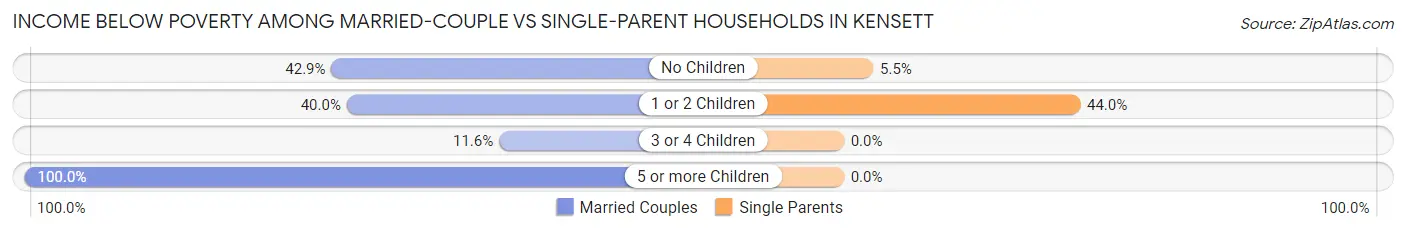
| Children | Married-Couple Families | Single-Parent Households |
| No Children | 69 (42.9%) | 4 (5.5%) |
| 1 or 2 Children | 26 (40.0%) | 59 (44.0%) |
| 3 or 4 Children | 5 (11.6%) | 0 (0.0%) |
| 5 or more Children | 3 (100.0%) | 0 (0.0%) |
| Total | 103 (37.9%) | 63 (30.4%) |
Race in Kensett
The most populous races in Kensett are White / Caucasian (1,474 | 72.1%), Black / African American (374 | 18.3%), and Hispanic or Latino (275 | 13.5%).
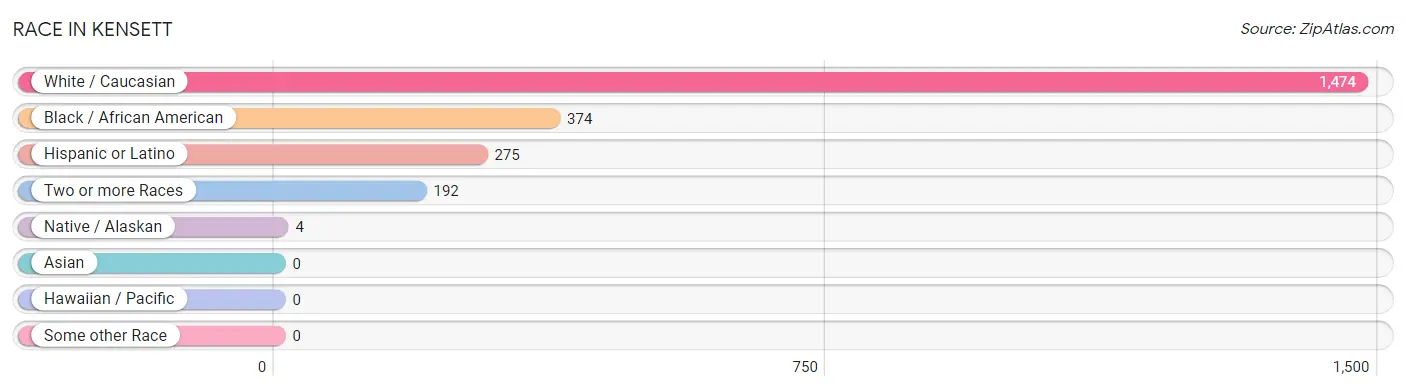
| Race | # Population | % Population |
| Asian | 0 | 0.0% |
| Black / African American | 374 | 18.3% |
| Hawaiian / Pacific | 0 | 0.0% |
| Hispanic or Latino | 275 | 13.5% |
| Native / Alaskan | 4 | 0.2% |
| White / Caucasian | 1,474 | 72.1% |
| Two or more Races | 192 | 9.4% |
| Some other Race | 0 | 0.0% |
| Total | 2,044 | 100.0% |
Ancestry in Kensett
The most populous ancestries reported in Kensett are Mexican (247 | 12.1%), Irish (146 | 7.1%), German (94 | 4.6%), English (93 | 4.5%), and American (73 | 3.6%), together accounting for 31.9% of all Kensett residents.
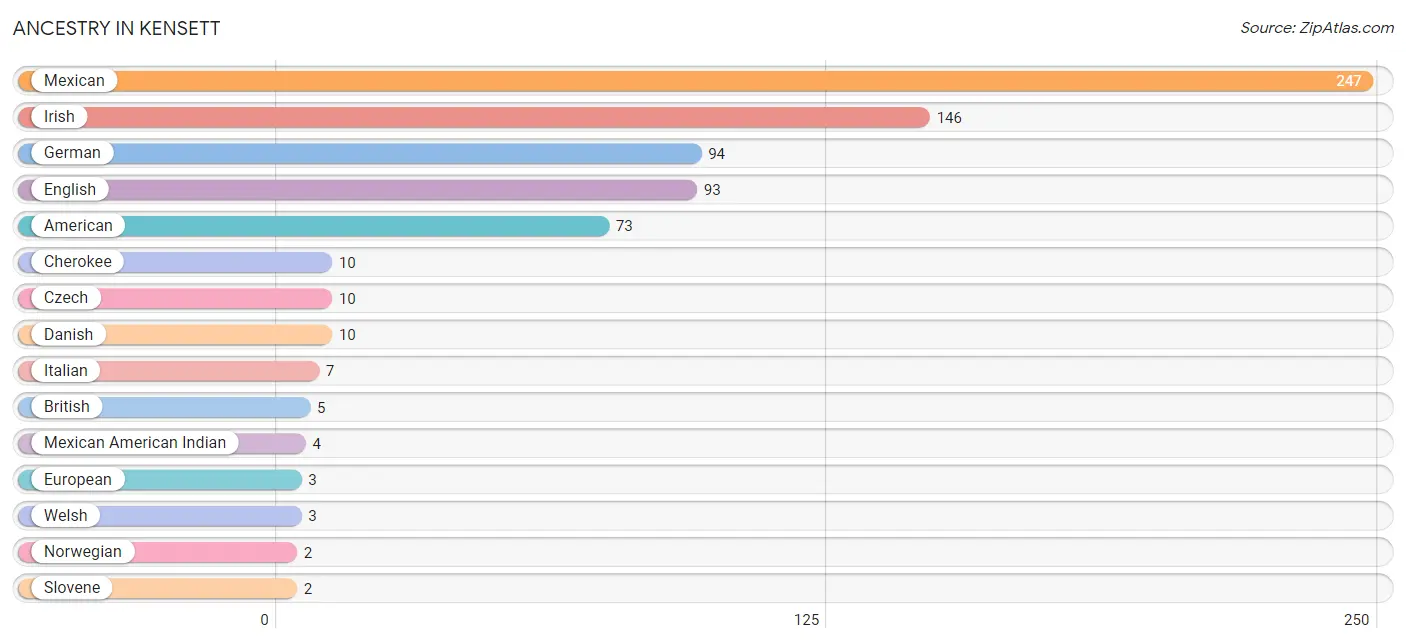
| Ancestry | # Population | % Population |
| American | 73 | 3.6% |
| British | 5 | 0.2% |
| Cherokee | 10 | 0.5% |
| Czech | 10 | 0.5% |
| Danish | 10 | 0.5% |
| English | 93 | 4.5% |
| European | 3 | 0.2% |
| German | 94 | 4.6% |
| Irish | 146 | 7.1% |
| Italian | 7 | 0.3% |
| Mexican | 247 | 12.1% |
| Mexican American Indian | 4 | 0.2% |
| Norwegian | 2 | 0.1% |
| Slovene | 2 | 0.1% |
| Welsh | 3 | 0.2% | View All 15 Rows |
Immigrants in Kensett
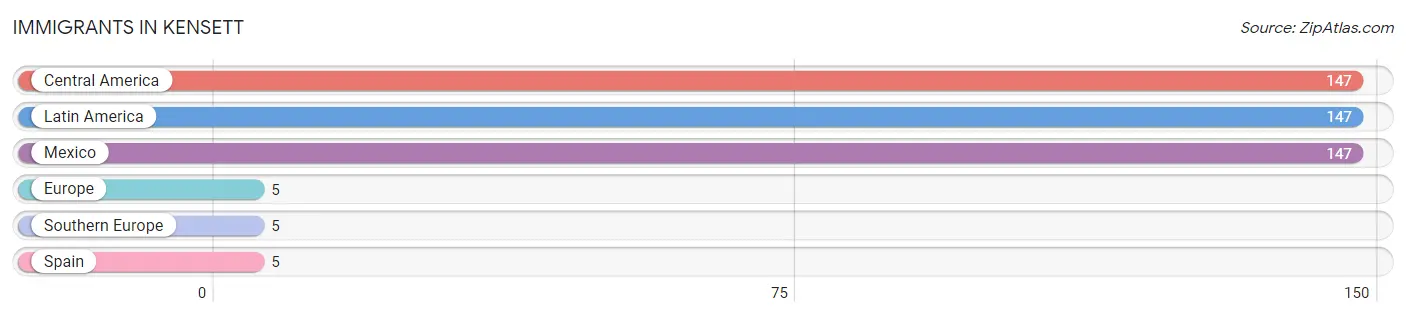
The most numerous immigrant groups reported in Kensett came from Central America (147 | 7.2%), Latin America (147 | 7.2%), Mexico (147 | 7.2%), Europe (5 | 0.2%), and Southern Europe (5 | 0.2%), together accounting for 22.1% of all Kensett residents.
| Immigration Origin | # Population | % Population |
| Central America | 147 | 7.2% |
| Europe | 5 | 0.2% |
| Latin America | 147 | 7.2% |
| Mexico | 147 | 7.2% |
| Southern Europe | 5 | 0.2% |
| Spain | 5 | 0.2% | View All 6 Rows |
Sex and Age in Kensett
Sex and Age in Kensett
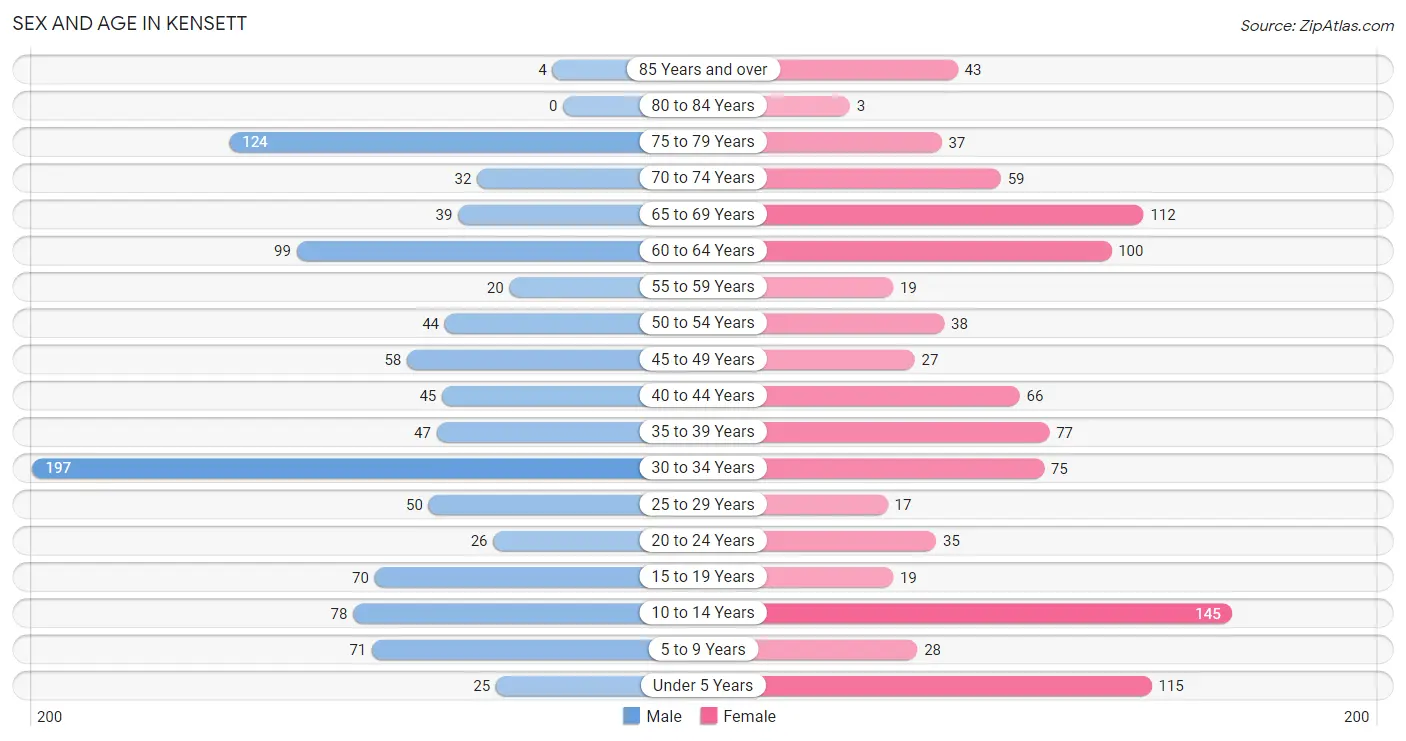
The most populous age groups in Kensett are 30 to 34 Years (197 | 19.1%) for men and 10 to 14 Years (145 | 14.3%) for women.
| Age Bracket | Male | Female |
| Under 5 Years | 25 (2.4%) | 115 (11.3%) |
| 5 to 9 Years | 71 (6.9%) | 28 (2.8%) |
| 10 to 14 Years | 78 (7.6%) | 145 (14.3%) |
| 15 to 19 Years | 70 (6.8%) | 19 (1.9%) |
| 20 to 24 Years | 26 (2.5%) | 35 (3.5%) |
| 25 to 29 Years | 50 (4.9%) | 17 (1.7%) |
| 30 to 34 Years | 197 (19.1%) | 75 (7.4%) |
| 35 to 39 Years | 47 (4.6%) | 77 (7.6%) |
| 40 to 44 Years | 45 (4.4%) | 66 (6.5%) |
| 45 to 49 Years | 58 (5.6%) | 27 (2.7%) |
| 50 to 54 Years | 44 (4.3%) | 38 (3.7%) |
| 55 to 59 Years | 20 (1.9%) | 19 (1.9%) |
| 60 to 64 Years | 99 (9.6%) | 100 (9.9%) |
| 65 to 69 Years | 39 (3.8%) | 112 (11.0%) |
| 70 to 74 Years | 32 (3.1%) | 59 (5.8%) |
| 75 to 79 Years | 124 (12.0%) | 37 (3.6%) |
| 80 to 84 Years | 0 (0.0%) | 3 (0.3%) |
| 85 Years and over | 4 (0.4%) | 43 (4.2%) |
| Total | 1,029 (100.0%) | 1,015 (100.0%) |
Families and Households in Kensett
Median Family Size in Kensett
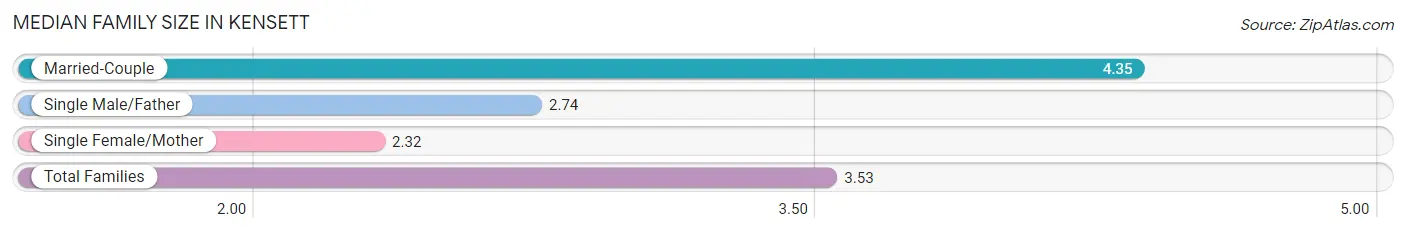
The median family size in Kensett is 3.53 persons per family, with married-couple families (272 | 56.8%) accounting for the largest median family size of 4.35 persons per family. On the other hand, single female/mother families (145 | 30.3%) represent the smallest median family size with 2.32 persons per family.
| Family Type | # Families | Family Size |
| Married-Couple | 272 (56.8%) | 4.35 |
| Single Male/Father | 62 (12.9%) | 2.74 |
| Single Female/Mother | 145 (30.3%) | 2.32 |
| Total Families | 479 (100.0%) | 3.53 |
Median Household Size in Kensett
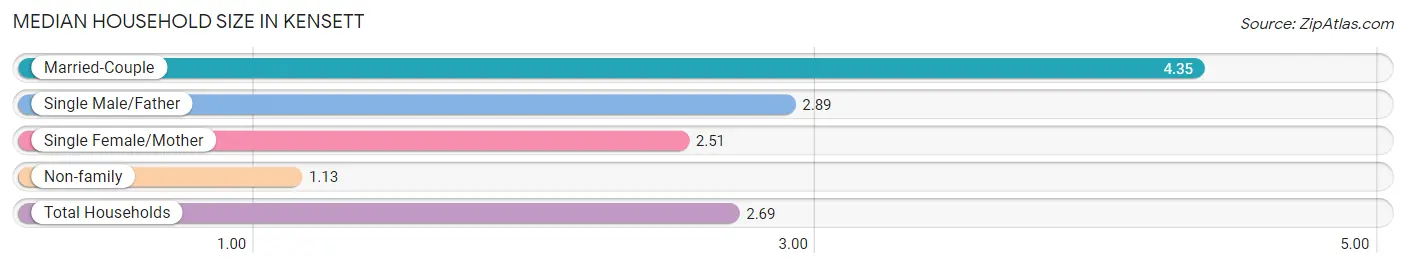
The median household size in Kensett is 2.69 persons per household, with married-couple households (272 | 35.8%) accounting for the largest median household size of 4.35 persons per household. non-family households (281 | 37.0%) represent the smallest median household size with 1.13 persons per household.
| Household Type | # Households | Household Size |
| Married-Couple | 272 (35.8%) | 4.35 |
| Single Male/Father | 62 (8.2%) | 2.89 |
| Single Female/Mother | 145 (19.1%) | 2.51 |
| Non-family | 281 (37.0%) | 1.13 |
| Total Households | 760 (100.0%) | 2.69 |
Household Size by Marriage Status in Kensett
Out of a total of 760 households in Kensett, 479 (63.0%) are family households, while 281 (37.0%) are nonfamily households. The most numerous type of family households are 2-person households, comprising 258, and the most common type of nonfamily households are 1-person households, comprising 258.
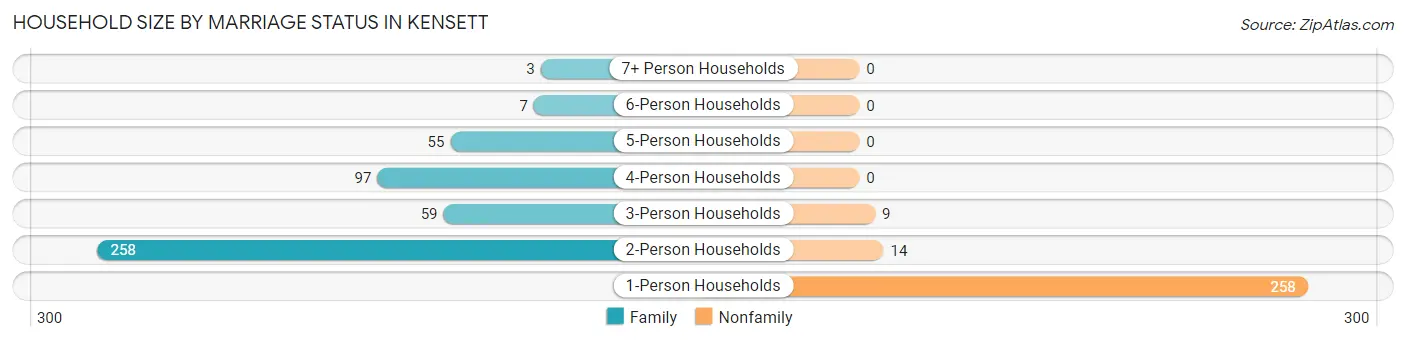
| Household Size | Family Households | Nonfamily Households |
| 1-Person Households | - | 258 (34.0%) |
| 2-Person Households | 258 (34.0%) | 14 (1.8%) |
| 3-Person Households | 59 (7.8%) | 9 (1.2%) |
| 4-Person Households | 97 (12.8%) | 0 (0.0%) |
| 5-Person Households | 55 (7.2%) | 0 (0.0%) |
| 6-Person Households | 7 (0.9%) | 0 (0.0%) |
| 7+ Person Households | 3 (0.4%) | 0 (0.0%) |
| Total | 479 (63.0%) | 281 (37.0%) |
Female Fertility in Kensett
Fertility by Age in Kensett
Average fertility rate in Kensett is 105.0 births per 1,000 women. Women in the age bracket of 20 to 34 years have the highest fertility rate with 276.0 births per 1,000 women. Women in the age bracket of 20 to 34 years acount for 100.0% of all women with births.
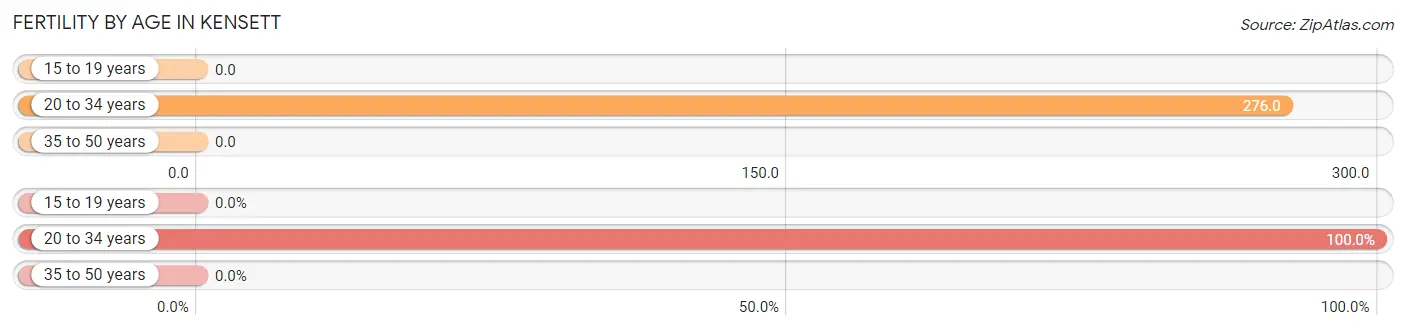
| Age Bracket | Women with Births | Births / 1,000 Women |
| 15 to 19 years | 0 (0.0%) | 0.0 |
| 20 to 34 years | 35 (100.0%) | 276.0 |
| 35 to 50 years | 0 (0.0%) | 0.0 |
| Total | 35 (100.0%) | 105.0 |
Fertility by Age by Marriage Status in Kensett
88.6% of women with births (35) in Kensett are married. The highest percentage of unmarried women with births falls into 20 to 34 years age bracket with 11.4% of them unmarried at the time of birth, while the lowest percentage of unmarried women with births belong to 20 to 34 years age bracket with 11.4% of them unmarried.
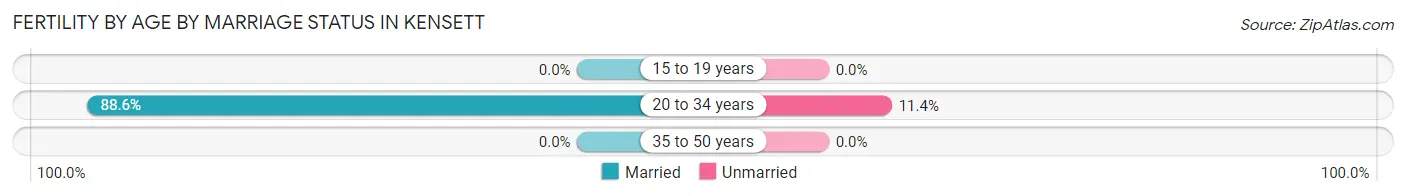
| Age Bracket | Married | Unmarried |
| 15 to 19 years | 0 (0.0%) | 0 (0.0%) |
| 20 to 34 years | 31 (88.6%) | 4 (11.4%) |
| 35 to 50 years | 0 (0.0%) | 0 (0.0%) |
| Total | 31 (88.6%) | 4 (11.4%) |
Fertility by Education in Kensett
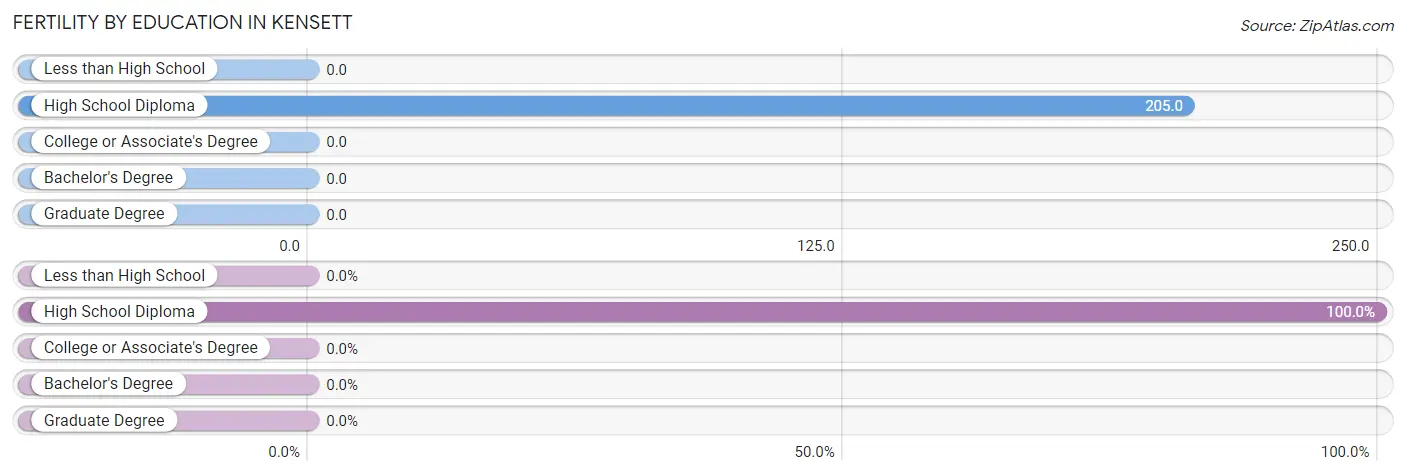
| Educational Attainment | Women with Births | Births / 1,000 Women |
| Less than High School | 0 (0.0%) | 0.0 |
| High School Diploma | 35 (100.0%) | 205.0 |
| College or Associate's Degree | 0 (0.0%) | 0.0 |
| Bachelor's Degree | 0 (0.0%) | 0.0 |
| Graduate Degree | 0 (0.0%) | 0.0 |
| Total | 35 (100.0%) | 105.0 |
Fertility by Education by Marriage Status in Kensett
11.4% of women with births in Kensett are unmarried. Women with the educational attainment of high school diploma are most likely to be married with 88.6% of them married at childbirth, while women with the educational attainment of high school diploma are least likely to be married with 11.4% of them unmarried at childbirth.
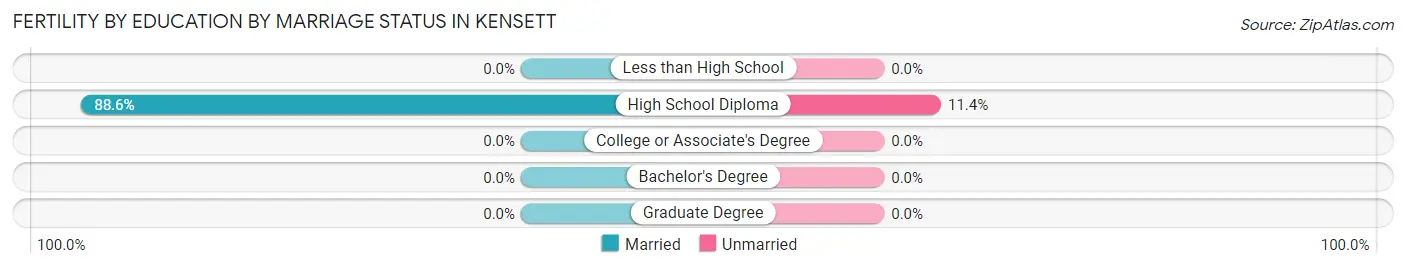
| Educational Attainment | Married | Unmarried |
| Less than High School | 0 (0.0%) | 0 (0.0%) |
| High School Diploma | 31 (88.6%) | 4 (11.4%) |
| College or Associate's Degree | 0 (0.0%) | 0 (0.0%) |
| Bachelor's Degree | 0 (0.0%) | 0 (0.0%) |
| Graduate Degree | 0 (0.0%) | 0 (0.0%) |
| Total | 31 (88.6%) | 4 (11.4%) |
Employment Characteristics in Kensett
Employment by Class of Employer in Kensett
Among the 684 employed individuals in Kensett, private company employees (521 | 76.2%), not-for-profit organizations (65 | 9.5%), and self-employed (not incorporated) (39 | 5.7%) make up the most common classes of employment.
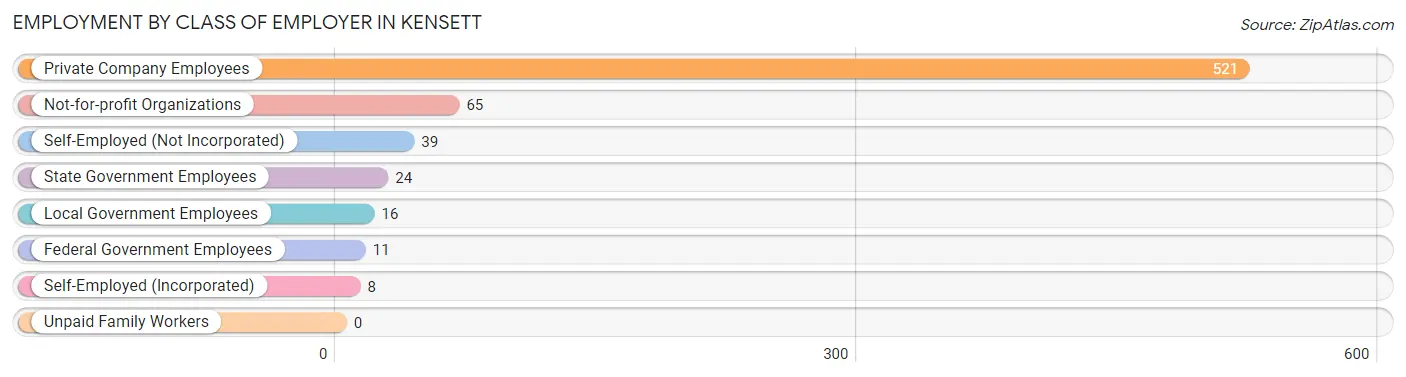
| Employer Class | # Employees | % Employees |
| Private Company Employees | 521 | 76.2% |
| Self-Employed (Incorporated) | 8 | 1.2% |
| Self-Employed (Not Incorporated) | 39 | 5.7% |
| Not-for-profit Organizations | 65 | 9.5% |
| Local Government Employees | 16 | 2.3% |
| State Government Employees | 24 | 3.5% |
| Federal Government Employees | 11 | 1.6% |
| Unpaid Family Workers | 0 | 0.0% |
| Total | 684 | 100.0% |
Employment Status by Age in Kensett
According to the labor force statistics for Kensett, out of the total population over 16 years of age (1,577), 46.9% or 740 individuals are in the labor force, with 7.4% or 55 of them unemployed. The age group with the highest labor force participation rate is 25 to 29 years, with 95.5% or 64 individuals in the labor force. Within the labor force, the 16 to 19 years age range has the highest percentage of unemployed individuals, with 50.0% or 3 of them being unemployed.
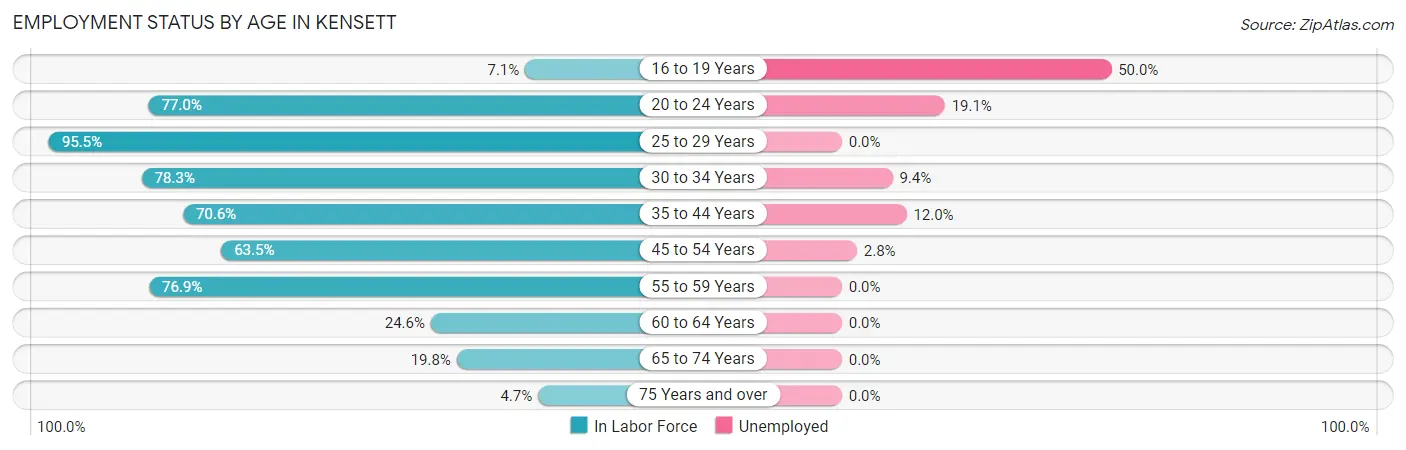
| Age Bracket | In Labor Force | Unemployed |
| 16 to 19 Years | 6 (7.1%) | 3 (50.0%) |
| 20 to 24 Years | 47 (77.0%) | 9 (19.1%) |
| 25 to 29 Years | 64 (95.5%) | 0 (0.0%) |
| 30 to 34 Years | 213 (78.3%) | 20 (9.4%) |
| 35 to 44 Years | 166 (70.6%) | 20 (12.0%) |
| 45 to 54 Years | 106 (63.5%) | 3 (2.8%) |
| 55 to 59 Years | 30 (76.9%) | 0 (0.0%) |
| 60 to 64 Years | 49 (24.6%) | 0 (0.0%) |
| 65 to 74 Years | 48 (19.8%) | 0 (0.0%) |
| 75 Years and over | 10 (4.7%) | 0 (0.0%) |
| Total | 740 (46.9%) | 55 (7.4%) |
Employment Status by Educational Attainment in Kensett
According to labor force statistics for Kensett, 64.1% of individuals (628) out of the total population between 25 and 64 years of age (979) are in the labor force, with 6.8% or 43 of them being unemployed. The group with the highest labor force participation rate are those with the educational attainment of college / associate degree, with 87.9% or 246 individuals in the labor force. Within the labor force, individuals with bachelor's degree or higher education have the highest percentage of unemployment, with 35.7% or 15 of them being unemployed.
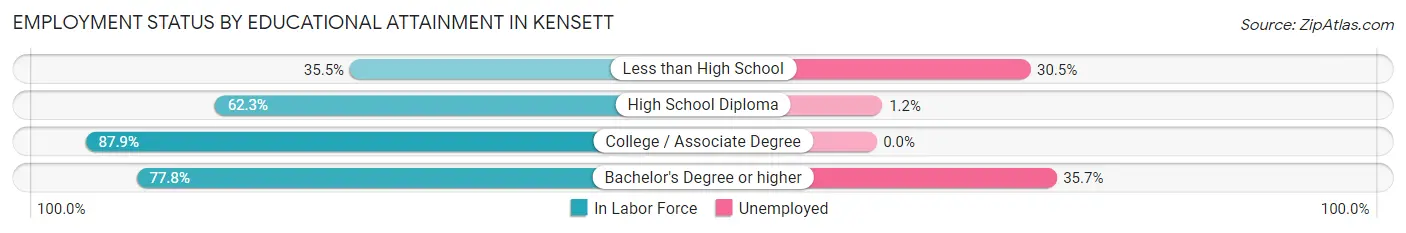
| Educational Attainment | In Labor Force | Unemployed |
| Less than High School | 82 (35.5%) | 70 (30.5%) |
| High School Diploma | 258 (62.3%) | 5 (1.2%) |
| College / Associate Degree | 246 (87.9%) | 0 (0.0%) |
| Bachelor's Degree or higher | 42 (77.8%) | 19 (35.7%) |
| Total | 628 (64.1%) | 67 (6.8%) |
Employment Occupations by Sex in Kensett
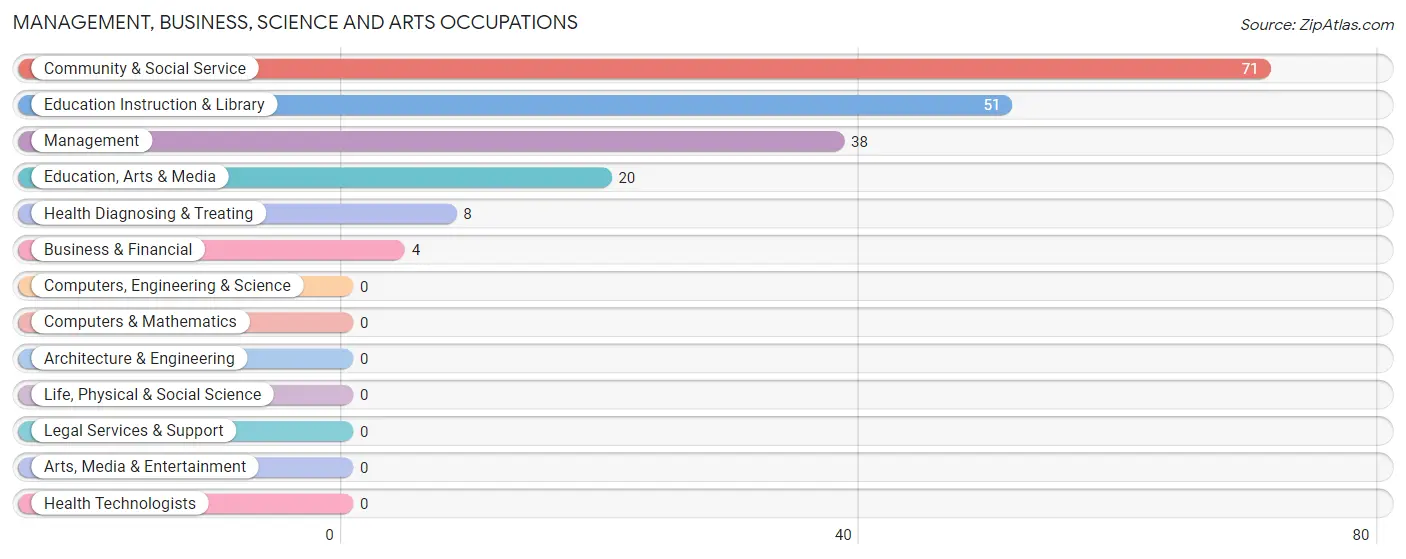
Management, Business, Science and Arts Occupations
The most common Management, Business, Science and Arts occupations in Kensett are Community & Social Service (71 | 10.4%), Education Instruction & Library (51 | 7.5%), Management (38 | 5.6%), Education, Arts & Media (20 | 2.9%), and Health Diagnosing & Treating (8 | 1.2%).
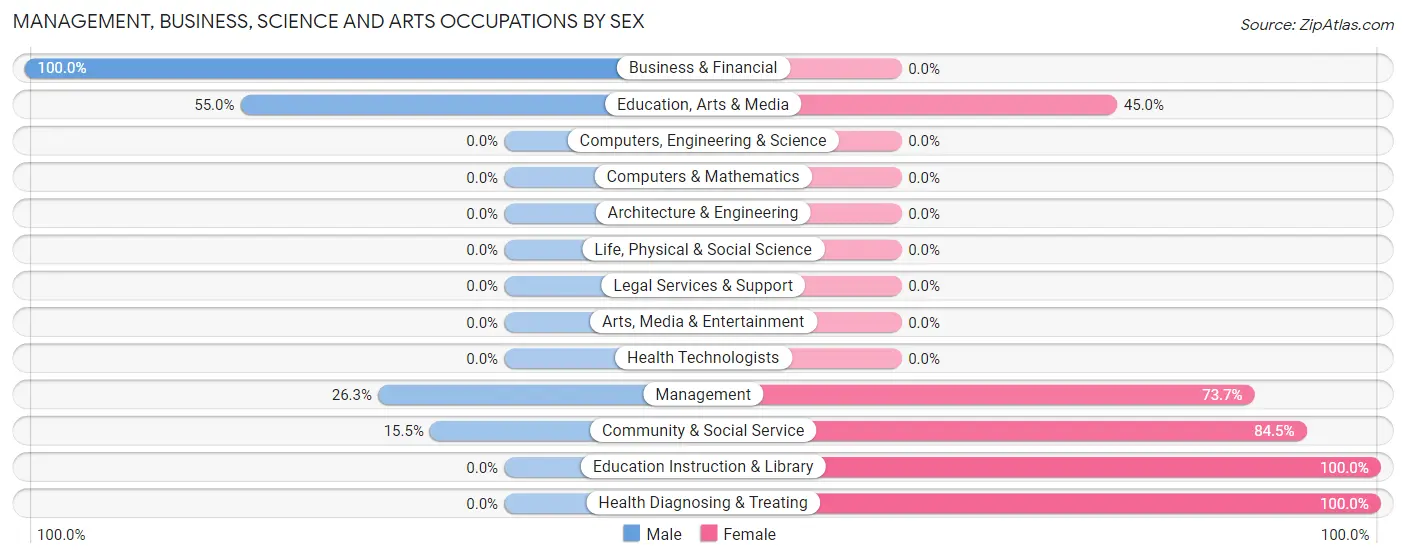
Management, Business, Science and Arts Occupations by Sex
Within the Management, Business, Science and Arts occupations in Kensett, the most male-oriented occupations are Business & Financial (100.0%), Education, Arts & Media (55.0%), and Management (26.3%), while the most female-oriented occupations are Education Instruction & Library (100.0%), Health Diagnosing & Treating (100.0%), and Community & Social Service (84.5%).
| Occupation | Male | Female |
| Management | 10 (26.3%) | 28 (73.7%) |
| Business & Financial | 4 (100.0%) | 0 (0.0%) |
| Computers, Engineering & Science | 0 (0.0%) | 0 (0.0%) |
| Computers & Mathematics | 0 (0.0%) | 0 (0.0%) |
| Architecture & Engineering | 0 (0.0%) | 0 (0.0%) |
| Life, Physical & Social Science | 0 (0.0%) | 0 (0.0%) |
| Community & Social Service | 11 (15.5%) | 60 (84.5%) |
| Education, Arts & Media | 11 (55.0%) | 9 (45.0%) |
| Legal Services & Support | 0 (0.0%) | 0 (0.0%) |
| Education Instruction & Library | 0 (0.0%) | 51 (100.0%) |
| Arts, Media & Entertainment | 0 (0.0%) | 0 (0.0%) |
| Health Diagnosing & Treating | 0 (0.0%) | 8 (100.0%) |
| Health Technologists | 0 (0.0%) | 0 (0.0%) |
| Total (Category) | 25 (20.7%) | 96 (79.3%) |
| Total (Overall) | 431 (63.0%) | 253 (37.0%) |
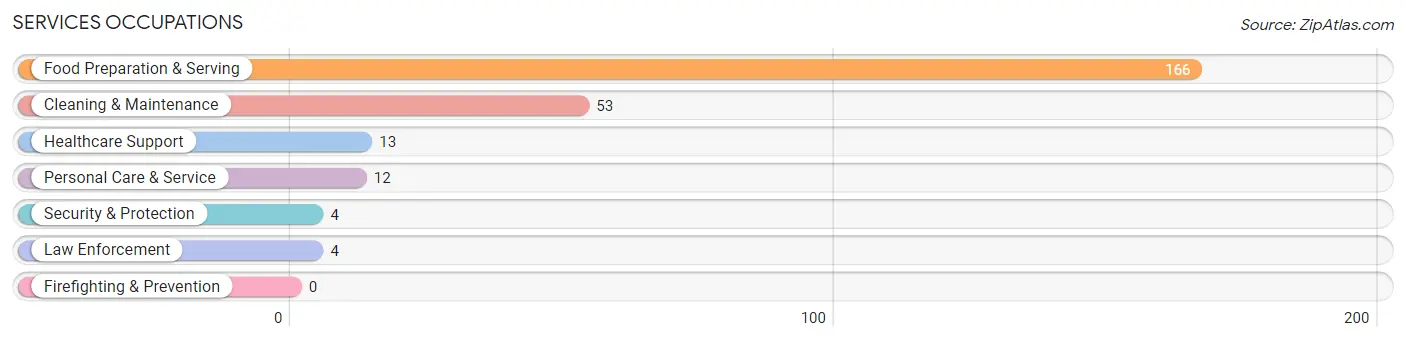
Services Occupations
The most common Services occupations in Kensett are Food Preparation & Serving (166 | 24.3%), Cleaning & Maintenance (53 | 7.7%), Healthcare Support (13 | 1.9%), Personal Care & Service (12 | 1.8%), and Security & Protection (4 | 0.6%).
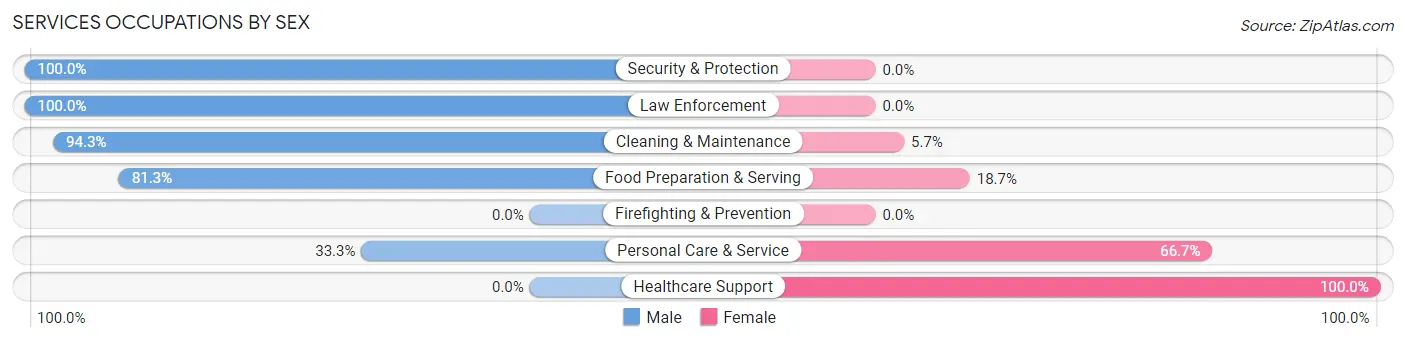
Services Occupations by Sex
Within the Services occupations in Kensett, the most male-oriented occupations are Security & Protection (100.0%), Law Enforcement (100.0%), and Cleaning & Maintenance (94.3%), while the most female-oriented occupations are Healthcare Support (100.0%), Personal Care & Service (66.7%), and Food Preparation & Serving (18.7%).
| Occupation | Male | Female |
| Healthcare Support | 0 (0.0%) | 13 (100.0%) |
| Security & Protection | 4 (100.0%) | 0 (0.0%) |
| Firefighting & Prevention | 0 (0.0%) | 0 (0.0%) |
| Law Enforcement | 4 (100.0%) | 0 (0.0%) |
| Food Preparation & Serving | 135 (81.3%) | 31 (18.7%) |
| Cleaning & Maintenance | 50 (94.3%) | 3 (5.7%) |
| Personal Care & Service | 4 (33.3%) | 8 (66.7%) |
| Total (Category) | 193 (77.8%) | 55 (22.2%) |
| Total (Overall) | 431 (63.0%) | 253 (37.0%) |
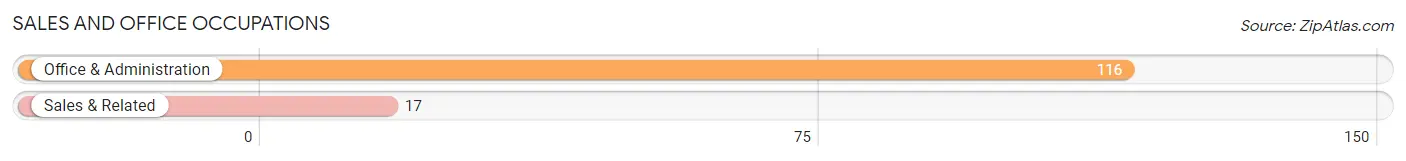
Sales and Office Occupations
The most common Sales and Office occupations in Kensett are Office & Administration (116 | 17.0%), and Sales & Related (17 | 2.5%).
Sales and Office Occupations by Sex
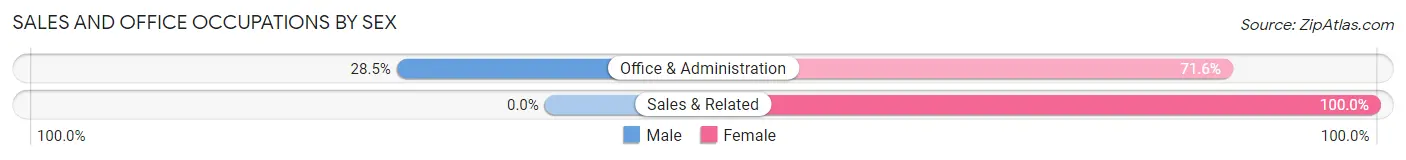
| Occupation | Male | Female |
| Sales & Related | 0 (0.0%) | 17 (100.0%) |
| Office & Administration | 33 (28.4%) | 83 (71.6%) |
| Total (Category) | 33 (24.8%) | 100 (75.2%) |
| Total (Overall) | 431 (63.0%) | 253 (37.0%) |
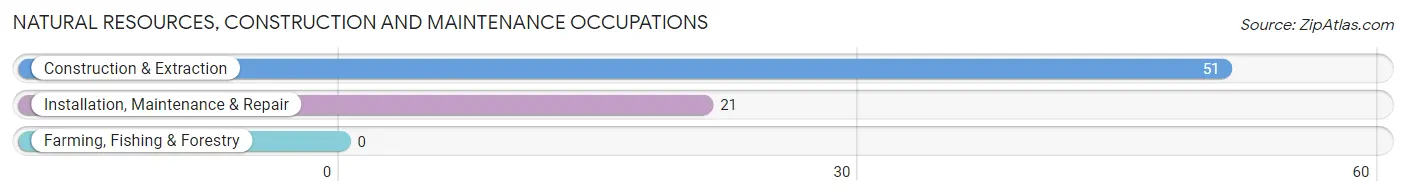
Natural Resources, Construction and Maintenance Occupations
The most common Natural Resources, Construction and Maintenance occupations in Kensett are Construction & Extraction (51 | 7.5%), and Installation, Maintenance & Repair (21 | 3.1%).
Natural Resources, Construction and Maintenance Occupations by Sex
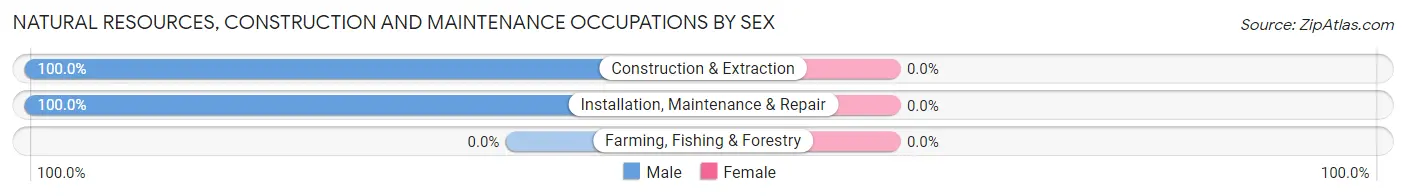
| Occupation | Male | Female |
| Farming, Fishing & Forestry | 0 (0.0%) | 0 (0.0%) |
| Construction & Extraction | 51 (100.0%) | 0 (0.0%) |
| Installation, Maintenance & Repair | 21 (100.0%) | 0 (0.0%) |
| Total (Category) | 72 (100.0%) | 0 (0.0%) |
| Total (Overall) | 431 (63.0%) | 253 (37.0%) |
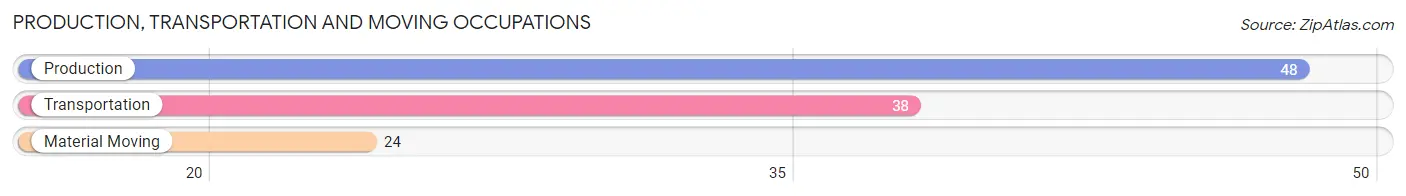
Production, Transportation and Moving Occupations
The most common Production, Transportation and Moving occupations in Kensett are Production (48 | 7.0%), Transportation (38 | 5.6%), and Material Moving (24 | 3.5%).
Production, Transportation and Moving Occupations by Sex
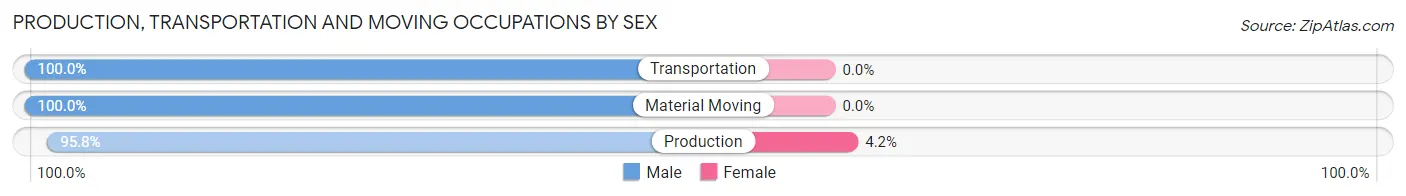
| Occupation | Male | Female |
| Production | 46 (95.8%) | 2 (4.2%) |
| Transportation | 38 (100.0%) | 0 (0.0%) |
| Material Moving | 24 (100.0%) | 0 (0.0%) |
| Total (Category) | 108 (98.2%) | 2 (1.8%) |
| Total (Overall) | 431 (63.0%) | 253 (37.0%) |
Employment Industries by Sex in Kensett
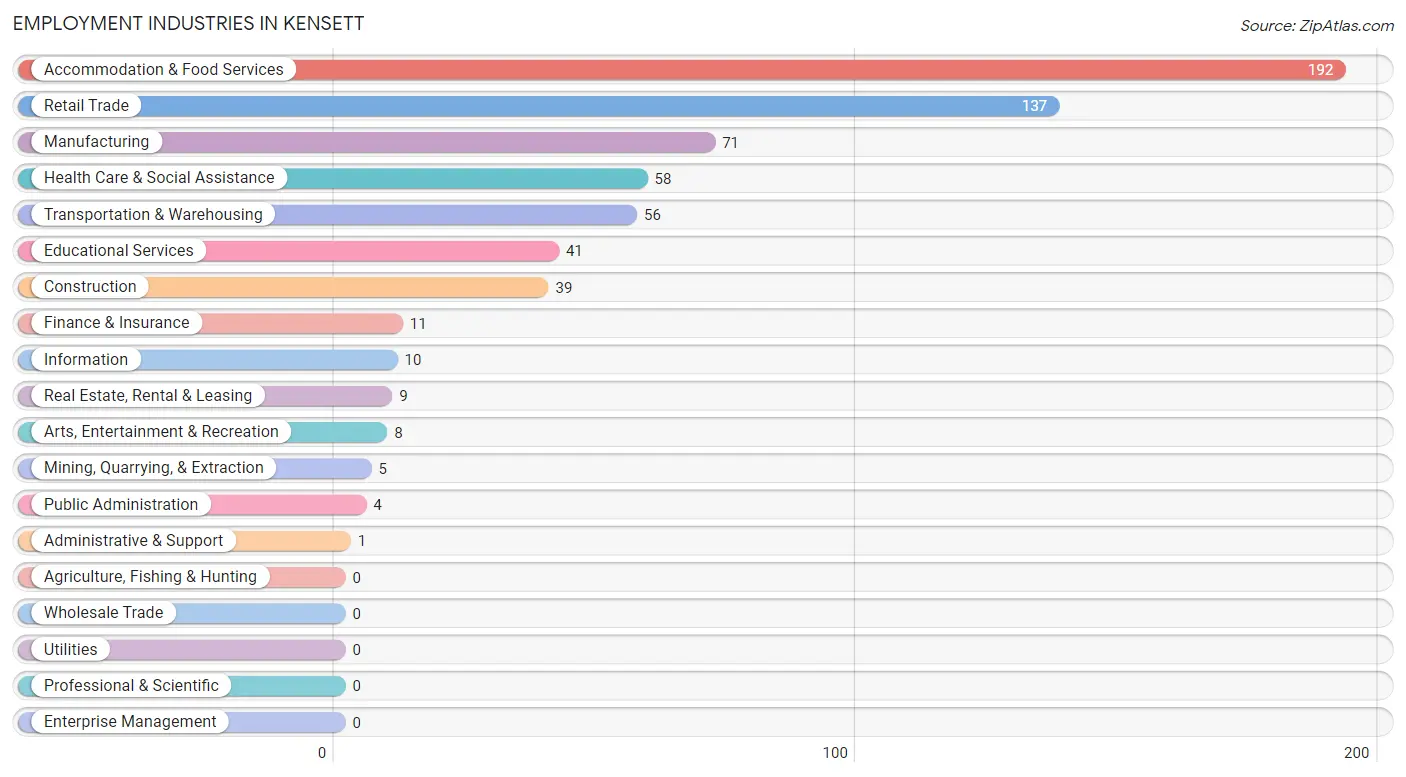
Employment Industries in Kensett
The major employment industries in Kensett include Accommodation & Food Services (192 | 28.1%), Retail Trade (137 | 20.0%), Manufacturing (71 | 10.4%), Health Care & Social Assistance (58 | 8.5%), and Transportation & Warehousing (56 | 8.2%).
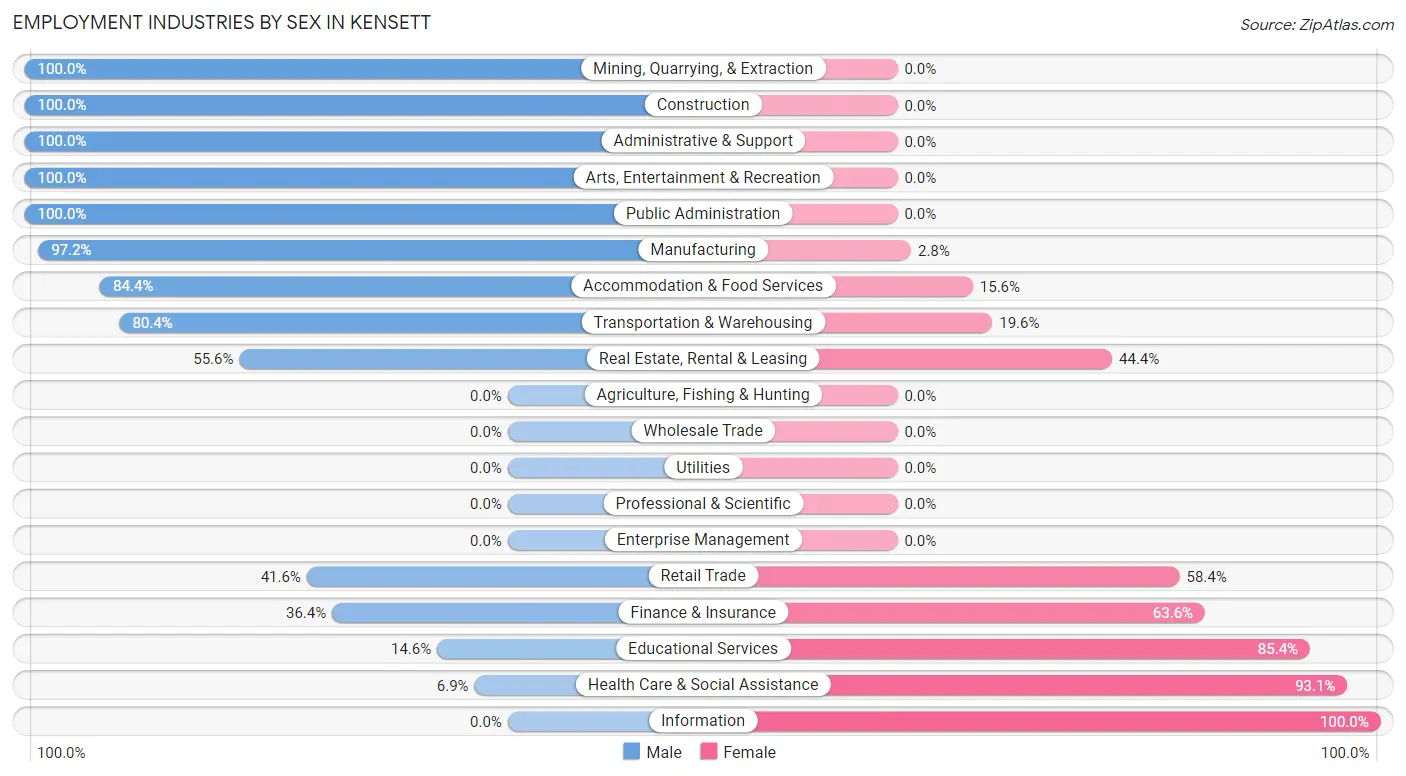
Employment Industries by Sex in Kensett
The Kensett industries that see more men than women are Mining, Quarrying, & Extraction (100.0%), Construction (100.0%), and Administrative & Support (100.0%), whereas the industries that tend to have a higher number of women are Information (100.0%), Health Care & Social Assistance (93.1%), and Educational Services (85.4%).
| Industry | Male | Female |
| Agriculture, Fishing & Hunting | 0 (0.0%) | 0 (0.0%) |
| Mining, Quarrying, & Extraction | 5 (100.0%) | 0 (0.0%) |
| Construction | 39 (100.0%) | 0 (0.0%) |
| Manufacturing | 69 (97.2%) | 2 (2.8%) |
| Wholesale Trade | 0 (0.0%) | 0 (0.0%) |
| Retail Trade | 57 (41.6%) | 80 (58.4%) |
| Transportation & Warehousing | 45 (80.4%) | 11 (19.6%) |
| Utilities | 0 (0.0%) | 0 (0.0%) |
| Information | 0 (0.0%) | 10 (100.0%) |
| Finance & Insurance | 4 (36.4%) | 7 (63.6%) |
| Real Estate, Rental & Leasing | 5 (55.6%) | 4 (44.4%) |
| Professional & Scientific | 0 (0.0%) | 0 (0.0%) |
| Enterprise Management | 0 (0.0%) | 0 (0.0%) |
| Administrative & Support | 1 (100.0%) | 0 (0.0%) |
| Educational Services | 6 (14.6%) | 35 (85.4%) |
| Health Care & Social Assistance | 4 (6.9%) | 54 (93.1%) |
| Arts, Entertainment & Recreation | 8 (100.0%) | 0 (0.0%) |
| Accommodation & Food Services | 162 (84.4%) | 30 (15.6%) |
| Public Administration | 4 (100.0%) | 0 (0.0%) |
| Total | 431 (63.0%) | 253 (37.0%) |
Education in Kensett
School Enrollment in Kensett
The most common levels of schooling among the 465 students in Kensett are college / undergraduate (141 | 30.3%), middle school (110 | 23.7%), and high school (100 | 21.5%).
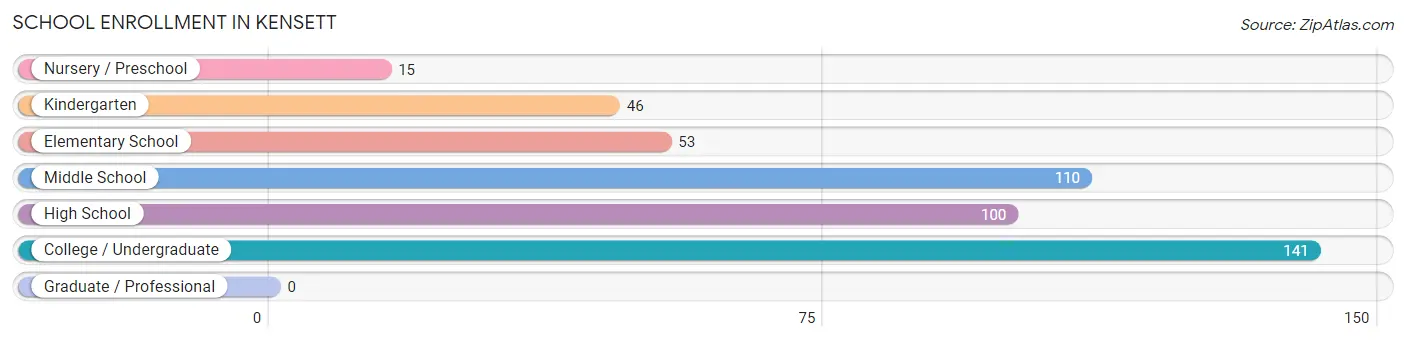
| School Level | # Students | % Students |
| Nursery / Preschool | 15 | 3.2% |
| Kindergarten | 46 | 9.9% |
| Elementary School | 53 | 11.4% |
| Middle School | 110 | 23.7% |
| High School | 100 | 21.5% |
| College / Undergraduate | 141 | 30.3% |
| Graduate / Professional | 0 | 0.0% |
| Total | 465 | 100.0% |
School Enrollment by Age by Funding Source in Kensett
Out of a total of 465 students who are enrolled in schools in Kensett, 33 (7.1%) attend a private institution, while the remaining 432 (92.9%) are enrolled in public schools. The age group of 20 to 24 year olds has the highest likelihood of being enrolled in private schools, with 10 (100.0% in the age bracket) enrolled. Conversely, the age group of 3 to 4 year olds has the lowest likelihood of being enrolled in a private school, with 7 (100.0% in the age bracket) attending a public institution.
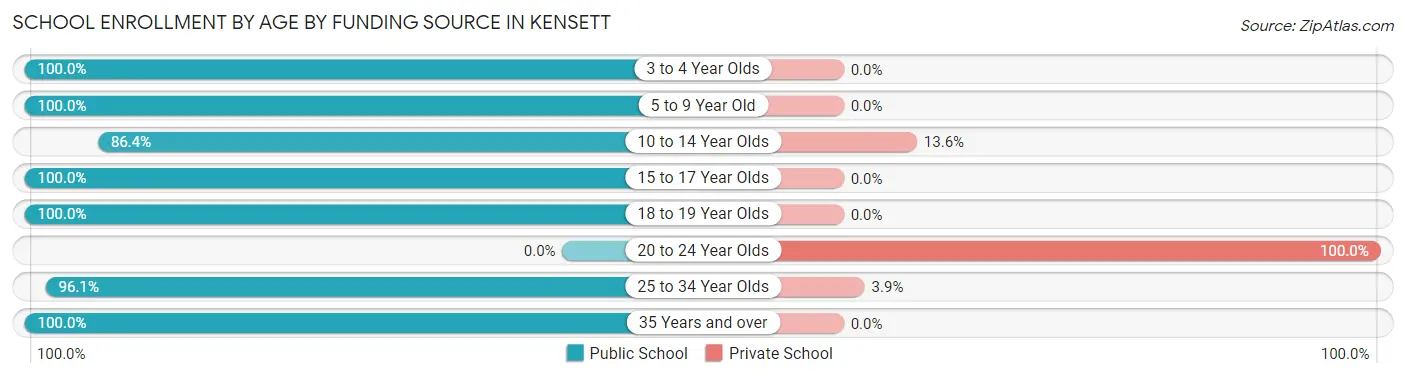
| Age Bracket | Public School | Private School |
| 3 to 4 Year Olds | 7 (100.0%) | 0 (0.0%) |
| 5 to 9 Year Old | 99 (100.0%) | 0 (0.0%) |
| 10 to 14 Year Olds | 114 (86.4%) | 18 (13.6%) |
| 15 to 17 Year Olds | 82 (100.0%) | 0 (0.0%) |
| 18 to 19 Year Olds | 4 (100.0%) | 0 (0.0%) |
| 20 to 24 Year Olds | 0 (0.0%) | 10 (100.0%) |
| 25 to 34 Year Olds | 123 (96.1%) | 5 (3.9%) |
| 35 Years and over | 3 (100.0%) | 0 (0.0%) |
| Total | 432 (92.9%) | 33 (7.1%) |
Educational Attainment by Field of Study in Kensett
Business (21 | 21.6%), computers & mathematics (19 | 19.6%), education (16 | 16.5%), communications (15 | 15.5%), and bio, nature & agricultural (10 | 10.3%) are the most common fields of study among 97 individuals in Kensett who have obtained a bachelor's degree or higher.
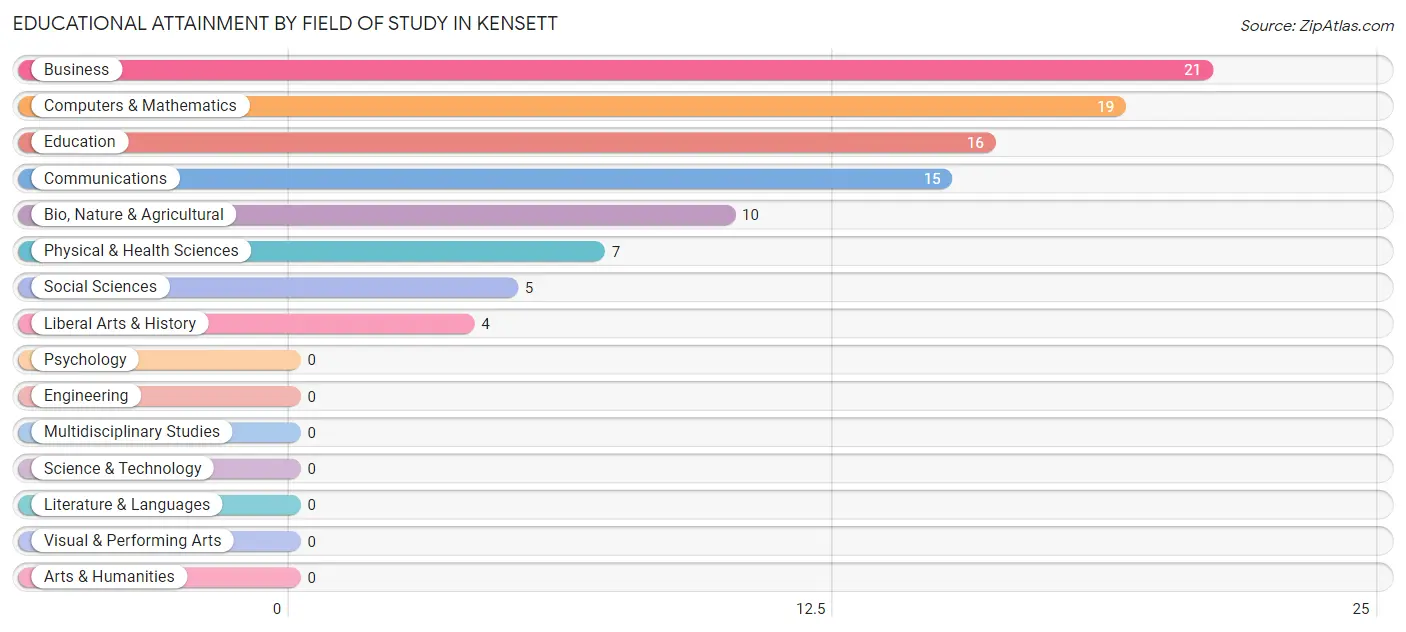
| Field of Study | # Graduates | % Graduates |
| Computers & Mathematics | 19 | 19.6% |
| Bio, Nature & Agricultural | 10 | 10.3% |
| Physical & Health Sciences | 7 | 7.2% |
| Psychology | 0 | 0.0% |
| Social Sciences | 5 | 5.1% |
| Engineering | 0 | 0.0% |
| Multidisciplinary Studies | 0 | 0.0% |
| Science & Technology | 0 | 0.0% |
| Business | 21 | 21.6% |
| Education | 16 | 16.5% |
| Literature & Languages | 0 | 0.0% |
| Liberal Arts & History | 4 | 4.1% |
| Visual & Performing Arts | 0 | 0.0% |
| Communications | 15 | 15.5% |
| Arts & Humanities | 0 | 0.0% |
| Total | 97 | 100.0% |
Transportation & Commute in Kensett
Vehicle Availability by Sex in Kensett
The most prevalent vehicle ownership categories in Kensett are males with 3 vehicles (202, accounting for 46.9%) and females with 3 vehicles (53, making up 79.8%).
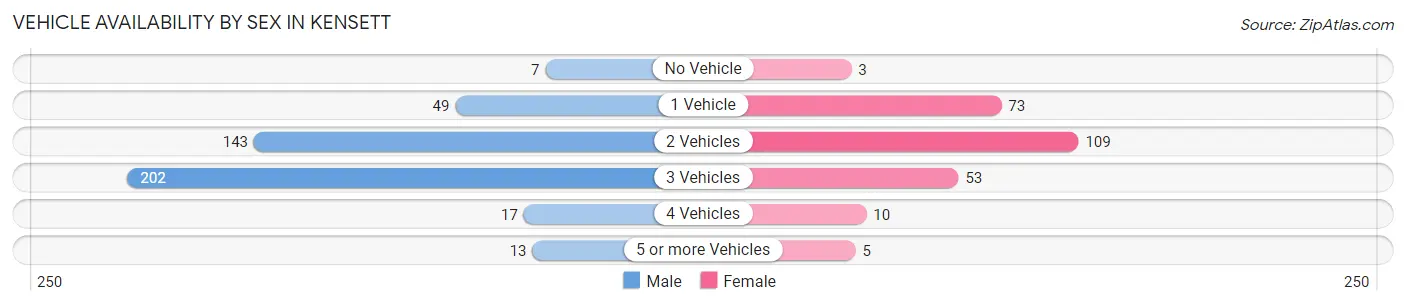
| Vehicles Available | Male | Female |
| No Vehicle | 7 (1.6%) | 3 (1.2%) |
| 1 Vehicle | 49 (11.4%) | 73 (28.8%) |
| 2 Vehicles | 143 (33.2%) | 109 (43.1%) |
| 3 Vehicles | 202 (46.9%) | 53 (20.9%) |
| 4 Vehicles | 17 (3.9%) | 10 (4.0%) |
| 5 or more Vehicles | 13 (3.0%) | 5 (2.0%) |
| Total | 431 (100.0%) | 253 (100.0%) |
Commute Time in Kensett
The most frequently occuring commute durations in Kensett are 10 to 14 minutes (281 commuters, 41.1%), 15 to 19 minutes (134 commuters, 19.6%), and 5 to 9 minutes (97 commuters, 14.2%).
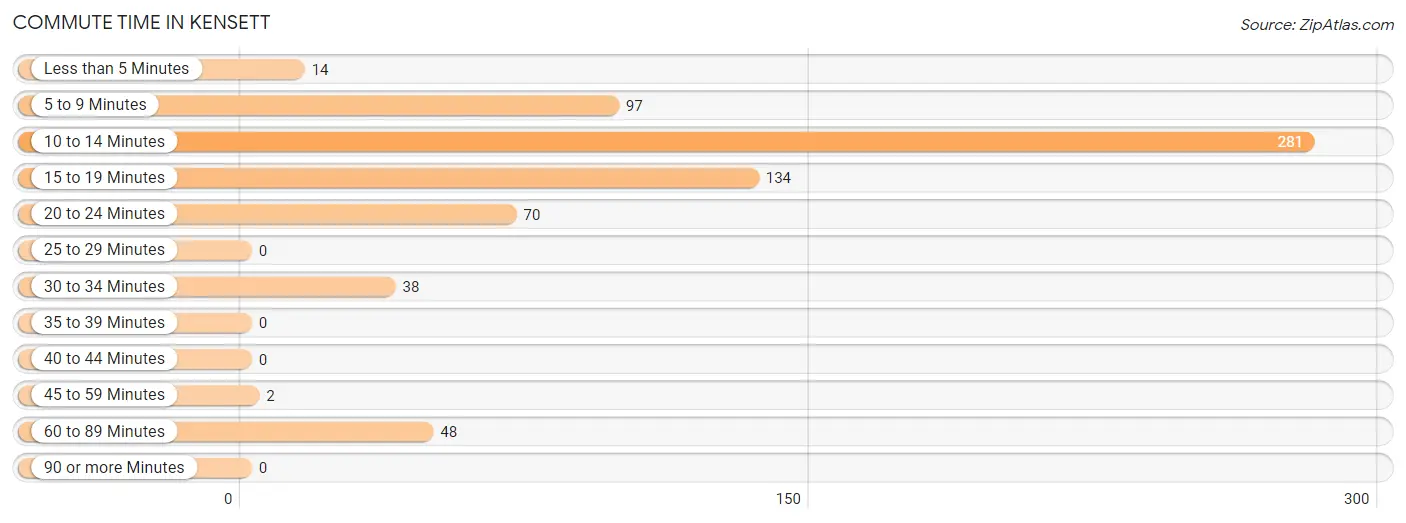
| Commute Time | # Commuters | % Commuters |
| Less than 5 Minutes | 14 | 2.1% |
| 5 to 9 Minutes | 97 | 14.2% |
| 10 to 14 Minutes | 281 | 41.1% |
| 15 to 19 Minutes | 134 | 19.6% |
| 20 to 24 Minutes | 70 | 10.2% |
| 25 to 29 Minutes | 0 | 0.0% |
| 30 to 34 Minutes | 38 | 5.6% |
| 35 to 39 Minutes | 0 | 0.0% |
| 40 to 44 Minutes | 0 | 0.0% |
| 45 to 59 Minutes | 2 | 0.3% |
| 60 to 89 Minutes | 48 | 7.0% |
| 90 or more Minutes | 0 | 0.0% |
Commute Time by Sex in Kensett
The most common commute times in Kensett are 10 to 14 minutes (198 commuters, 45.9%) for males and 10 to 14 minutes (83 commuters, 32.8%) for females.
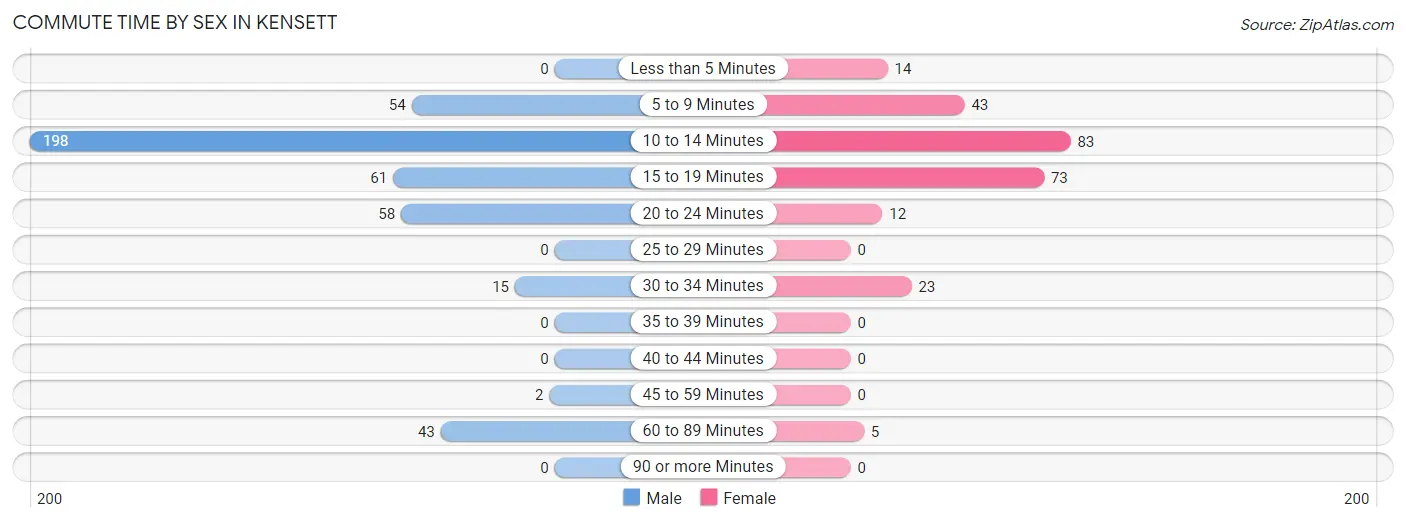
| Commute Time | Male | Female |
| Less than 5 Minutes | 0 (0.0%) | 14 (5.5%) |
| 5 to 9 Minutes | 54 (12.5%) | 43 (17.0%) |
| 10 to 14 Minutes | 198 (45.9%) | 83 (32.8%) |
| 15 to 19 Minutes | 61 (14.1%) | 73 (28.8%) |
| 20 to 24 Minutes | 58 (13.5%) | 12 (4.7%) |
| 25 to 29 Minutes | 0 (0.0%) | 0 (0.0%) |
| 30 to 34 Minutes | 15 (3.5%) | 23 (9.1%) |
| 35 to 39 Minutes | 0 (0.0%) | 0 (0.0%) |
| 40 to 44 Minutes | 0 (0.0%) | 0 (0.0%) |
| 45 to 59 Minutes | 2 (0.5%) | 0 (0.0%) |
| 60 to 89 Minutes | 43 (10.0%) | 5 (2.0%) |
| 90 or more Minutes | 0 (0.0%) | 0 (0.0%) |
Time of Departure to Work by Sex in Kensett
The most frequent times of departure to work in Kensett are 7:30 AM to 7:59 AM (133, 30.9%) for males and 7:30 AM to 7:59 AM (80, 31.6%) for females.
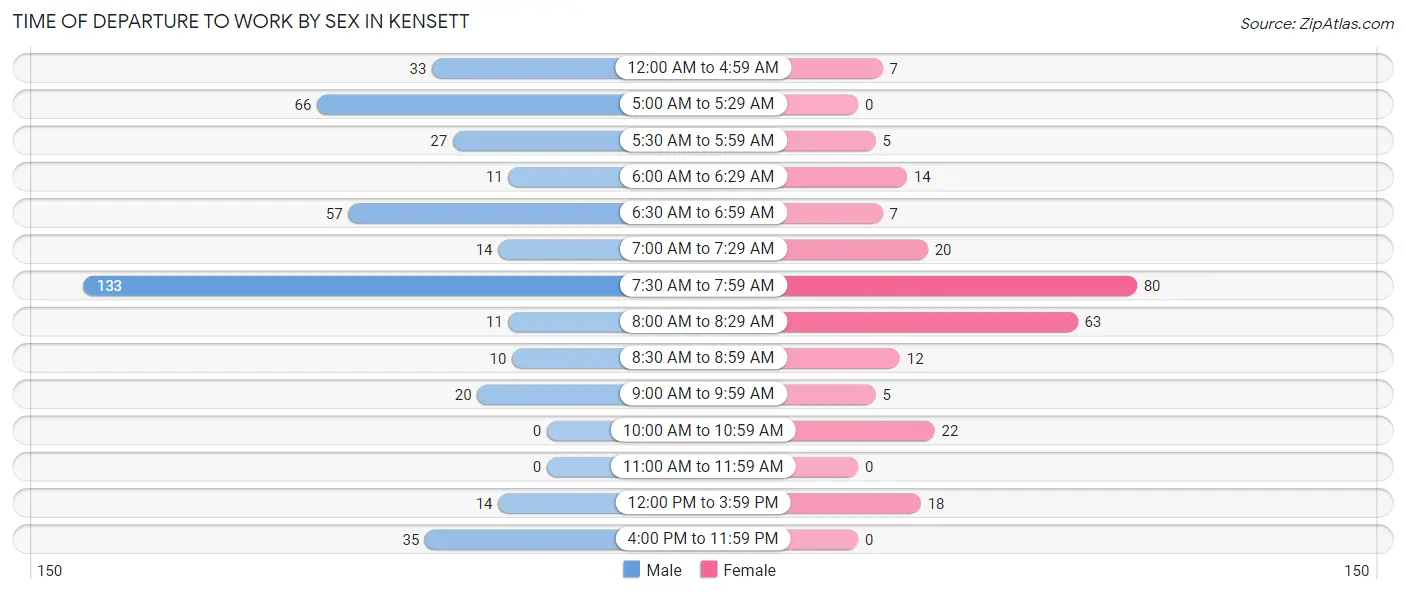
| Time of Departure | Male | Female |
| 12:00 AM to 4:59 AM | 33 (7.7%) | 7 (2.8%) |
| 5:00 AM to 5:29 AM | 66 (15.3%) | 0 (0.0%) |
| 5:30 AM to 5:59 AM | 27 (6.3%) | 5 (2.0%) |
| 6:00 AM to 6:29 AM | 11 (2.5%) | 14 (5.5%) |
| 6:30 AM to 6:59 AM | 57 (13.2%) | 7 (2.8%) |
| 7:00 AM to 7:29 AM | 14 (3.3%) | 20 (7.9%) |
| 7:30 AM to 7:59 AM | 133 (30.9%) | 80 (31.6%) |
| 8:00 AM to 8:29 AM | 11 (2.5%) | 63 (24.9%) |
| 8:30 AM to 8:59 AM | 10 (2.3%) | 12 (4.7%) |
| 9:00 AM to 9:59 AM | 20 (4.6%) | 5 (2.0%) |
| 10:00 AM to 10:59 AM | 0 (0.0%) | 22 (8.7%) |
| 11:00 AM to 11:59 AM | 0 (0.0%) | 0 (0.0%) |
| 12:00 PM to 3:59 PM | 14 (3.3%) | 18 (7.1%) |
| 4:00 PM to 11:59 PM | 35 (8.1%) | 0 (0.0%) |
| Total | 431 (100.0%) | 253 (100.0%) |
Housing Occupancy in Kensett
Occupancy by Ownership in Kensett
Of the total 760 dwellings in Kensett, owner-occupied units account for 339 (44.6%), while renter-occupied units make up 421 (55.4%).
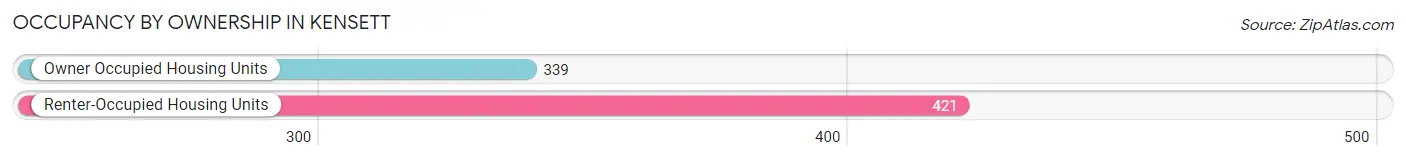
| Occupancy | # Housing Units | % Housing Units |
| Owner Occupied Housing Units | 339 | 44.6% |
| Renter-Occupied Housing Units | 421 | 55.4% |
| Total Occupied Housing Units | 760 | 100.0% |
Occupancy by Household Size in Kensett
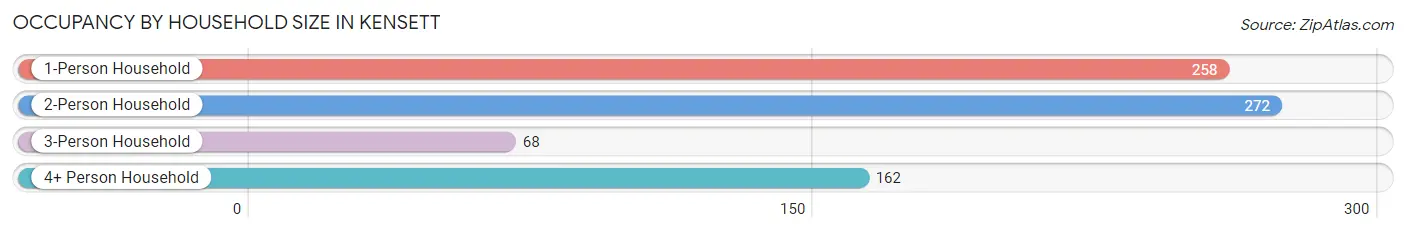
| Household Size | # Housing Units | % Housing Units |
| 1-Person Household | 258 | 34.0% |
| 2-Person Household | 272 | 35.8% |
| 3-Person Household | 68 | 8.9% |
| 4+ Person Household | 162 | 21.3% |
| Total Housing Units | 760 | 100.0% |
Occupancy by Ownership by Household Size in Kensett
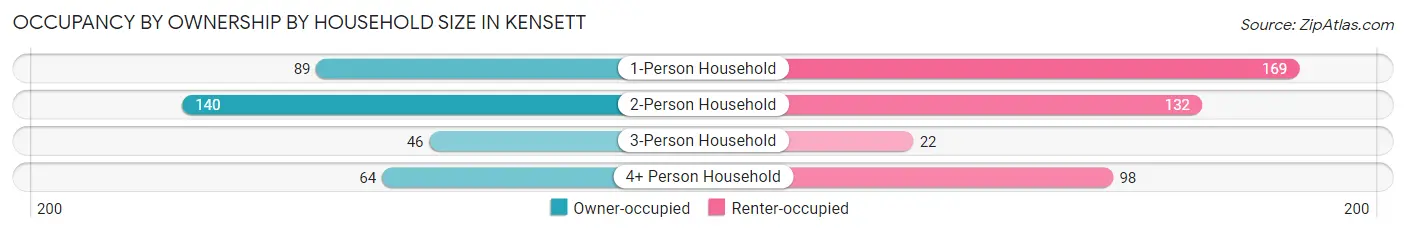
| Household Size | Owner-occupied | Renter-occupied |
| 1-Person Household | 89 (34.5%) | 169 (65.5%) |
| 2-Person Household | 140 (51.5%) | 132 (48.5%) |
| 3-Person Household | 46 (67.6%) | 22 (32.4%) |
| 4+ Person Household | 64 (39.5%) | 98 (60.5%) |
| Total Housing Units | 339 (44.6%) | 421 (55.4%) |
Occupancy by Educational Attainment in Kensett
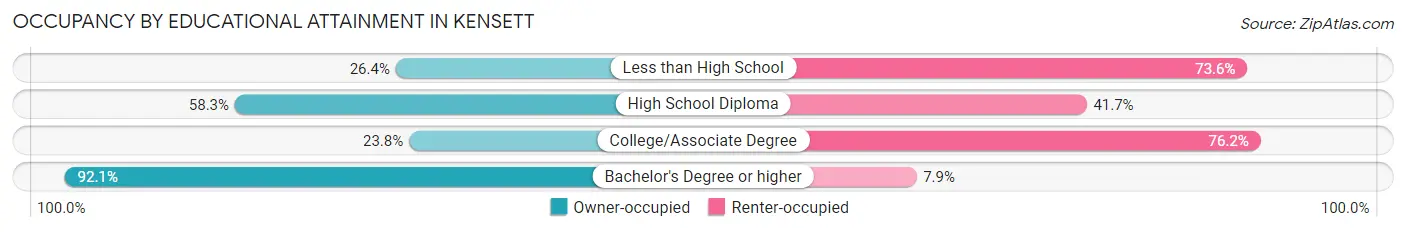
| Household Size | Owner-occupied | Renter-occupied |
| Less than High School | 51 (26.4%) | 142 (73.6%) |
| High School Diploma | 186 (58.3%) | 133 (41.7%) |
| College/Associate Degree | 44 (23.8%) | 141 (76.2%) |
| Bachelor's Degree or higher | 58 (92.1%) | 5 (7.9%) |
Occupancy by Age of Householder in Kensett
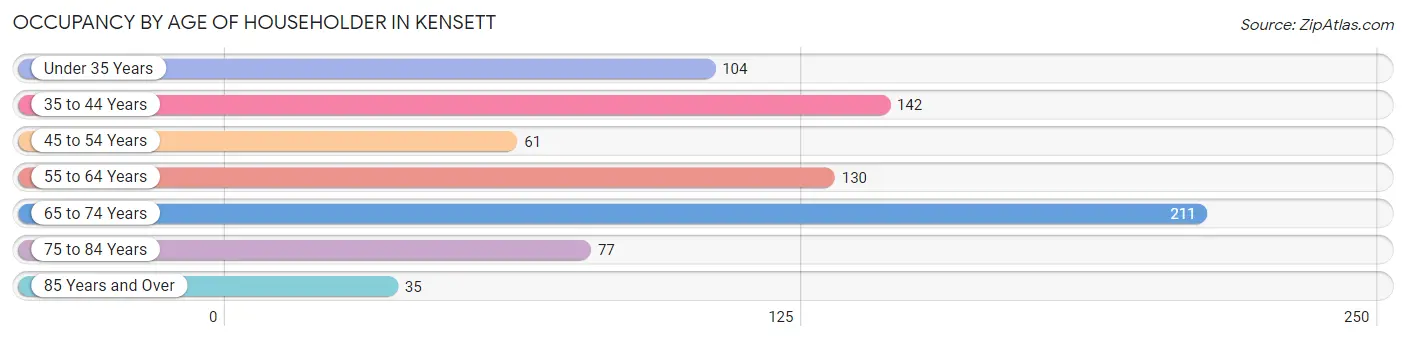
| Age Bracket | # Households | % Households |
| Under 35 Years | 104 | 13.7% |
| 35 to 44 Years | 142 | 18.7% |
| 45 to 54 Years | 61 | 8.0% |
| 55 to 64 Years | 130 | 17.1% |
| 65 to 74 Years | 211 | 27.8% |
| 75 to 84 Years | 77 | 10.1% |
| 85 Years and Over | 35 | 4.6% |
| Total | 760 | 100.0% |
Housing Finances in Kensett
Median Income by Occupancy in Kensett
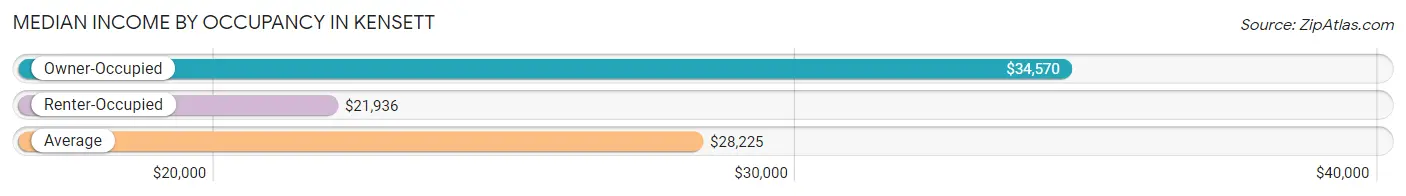
| Occupancy Type | # Households | Median Income |
| Owner-Occupied | 339 (44.6%) | $34,570 |
| Renter-Occupied | 421 (55.4%) | $21,936 |
| Average | 760 (100.0%) | $28,225 |
Occupancy by Householder Income Bracket in Kensett
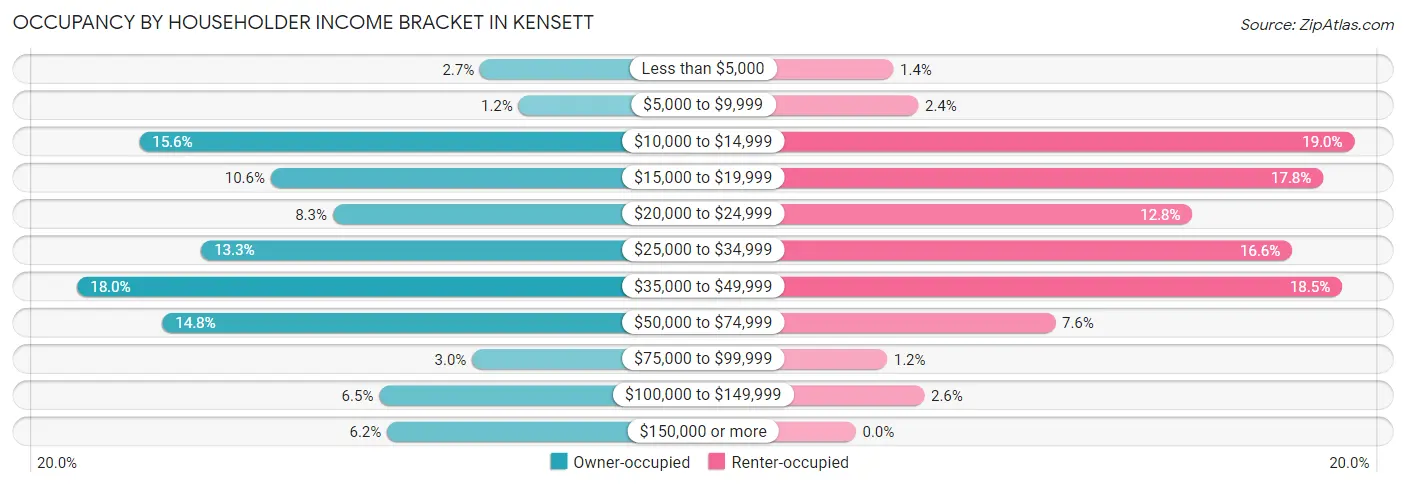
| Income Bracket | Owner-occupied | Renter-occupied |
| Less than $5,000 | 9 (2.6%) | 6 (1.4%) |
| $5,000 to $9,999 | 4 (1.2%) | 10 (2.4%) |
| $10,000 to $14,999 | 53 (15.6%) | 80 (19.0%) |
| $15,000 to $19,999 | 36 (10.6%) | 75 (17.8%) |
| $20,000 to $24,999 | 28 (8.3%) | 54 (12.8%) |
| $25,000 to $34,999 | 45 (13.3%) | 70 (16.6%) |
| $35,000 to $49,999 | 61 (18.0%) | 78 (18.5%) |
| $50,000 to $74,999 | 50 (14.7%) | 32 (7.6%) |
| $75,000 to $99,999 | 10 (2.9%) | 5 (1.2%) |
| $100,000 to $149,999 | 22 (6.5%) | 11 (2.6%) |
| $150,000 or more | 21 (6.2%) | 0 (0.0%) |
| Total | 339 (100.0%) | 421 (100.0%) |
Monthly Housing Cost Tiers in Kensett
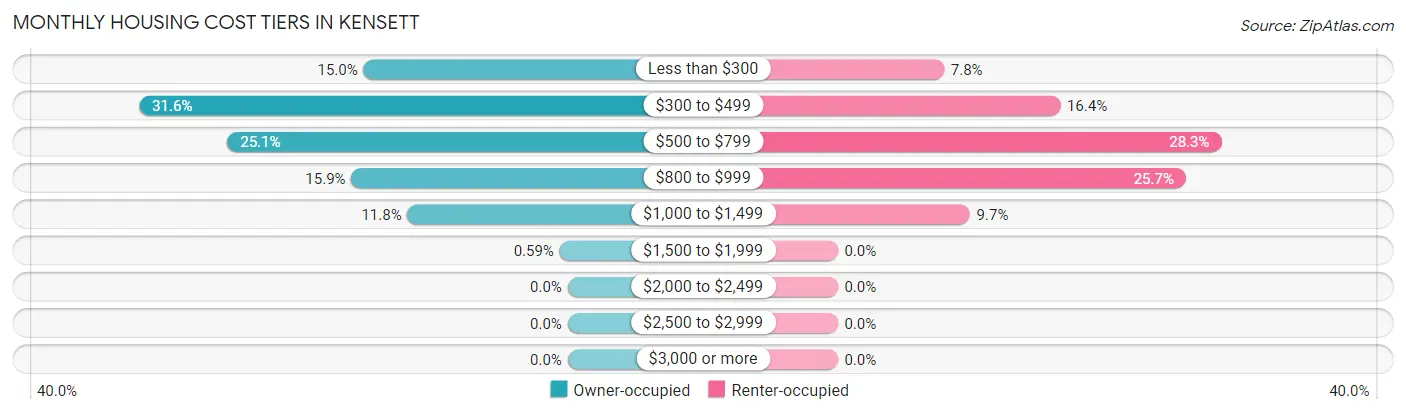
| Monthly Cost | Owner-occupied | Renter-occupied |
| Less than $300 | 51 (15.0%) | 33 (7.8%) |
| $300 to $499 | 107 (31.6%) | 69 (16.4%) |
| $500 to $799 | 85 (25.1%) | 119 (28.3%) |
| $800 to $999 | 54 (15.9%) | 108 (25.7%) |
| $1,000 to $1,499 | 40 (11.8%) | 41 (9.7%) |
| $1,500 to $1,999 | 2 (0.6%) | 0 (0.0%) |
| $2,000 to $2,499 | 0 (0.0%) | 0 (0.0%) |
| $2,500 to $2,999 | 0 (0.0%) | 0 (0.0%) |
| $3,000 or more | 0 (0.0%) | 0 (0.0%) |
| Total | 339 (100.0%) | 421 (100.0%) |
Physical Housing Characteristics in Kensett
Housing Structures in Kensett
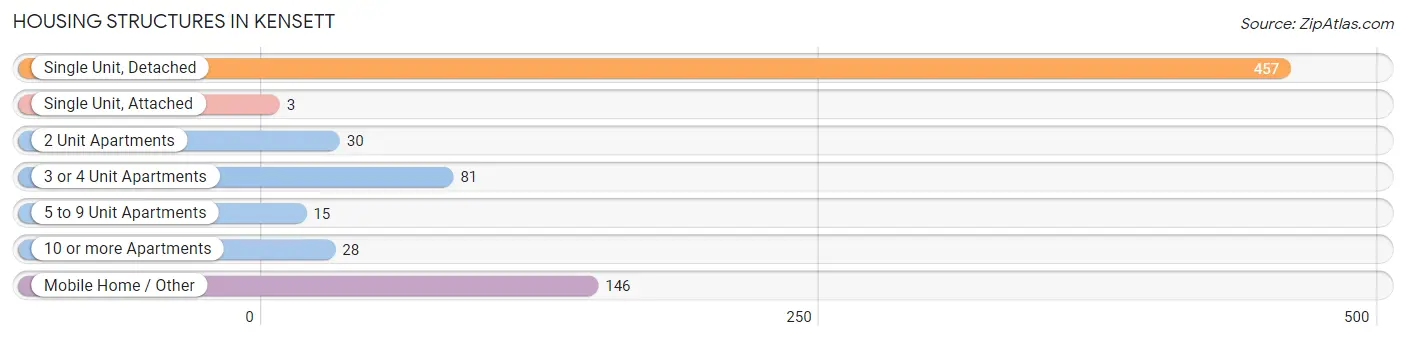
| Structure Type | # Housing Units | % Housing Units |
| Single Unit, Detached | 457 | 60.1% |
| Single Unit, Attached | 3 | 0.4% |
| 2 Unit Apartments | 30 | 4.0% |
| 3 or 4 Unit Apartments | 81 | 10.7% |
| 5 to 9 Unit Apartments | 15 | 2.0% |
| 10 or more Apartments | 28 | 3.7% |
| Mobile Home / Other | 146 | 19.2% |
| Total | 760 | 100.0% |
Housing Structures by Occupancy in Kensett
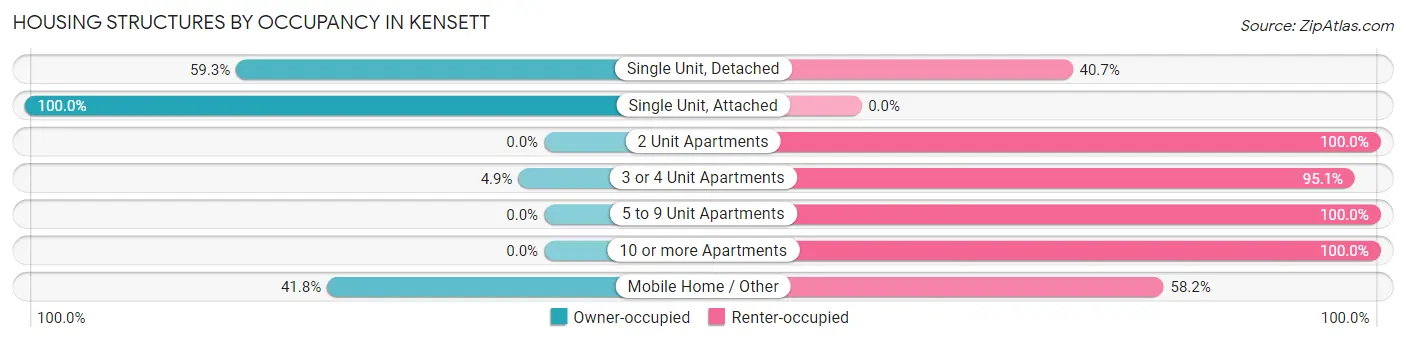
| Structure Type | Owner-occupied | Renter-occupied |
| Single Unit, Detached | 271 (59.3%) | 186 (40.7%) |
| Single Unit, Attached | 3 (100.0%) | 0 (0.0%) |
| 2 Unit Apartments | 0 (0.0%) | 30 (100.0%) |
| 3 or 4 Unit Apartments | 4 (4.9%) | 77 (95.1%) |
| 5 to 9 Unit Apartments | 0 (0.0%) | 15 (100.0%) |
| 10 or more Apartments | 0 (0.0%) | 28 (100.0%) |
| Mobile Home / Other | 61 (41.8%) | 85 (58.2%) |
| Total | 339 (44.6%) | 421 (55.4%) |
Housing Structures by Number of Rooms in Kensett
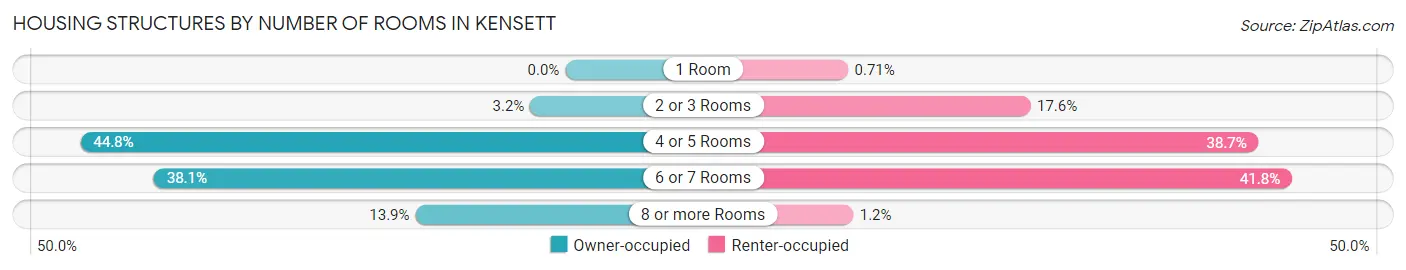
| Number of Rooms | Owner-occupied | Renter-occupied |
| 1 Room | 0 (0.0%) | 3 (0.7%) |
| 2 or 3 Rooms | 11 (3.2%) | 74 (17.6%) |
| 4 or 5 Rooms | 152 (44.8%) | 163 (38.7%) |
| 6 or 7 Rooms | 129 (38.1%) | 176 (41.8%) |
| 8 or more Rooms | 47 (13.9%) | 5 (1.2%) |
| Total | 339 (100.0%) | 421 (100.0%) |
Housing Structure by Heating Type in Kensett
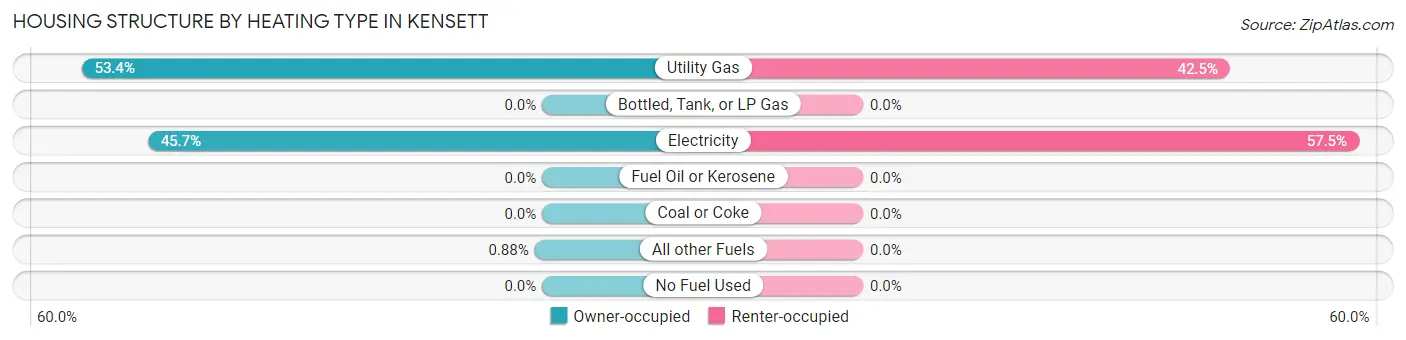
| Heating Type | Owner-occupied | Renter-occupied |
| Utility Gas | 181 (53.4%) | 179 (42.5%) |
| Bottled, Tank, or LP Gas | 0 (0.0%) | 0 (0.0%) |
| Electricity | 155 (45.7%) | 242 (57.5%) |
| Fuel Oil or Kerosene | 0 (0.0%) | 0 (0.0%) |
| Coal or Coke | 0 (0.0%) | 0 (0.0%) |
| All other Fuels | 3 (0.9%) | 0 (0.0%) |
| No Fuel Used | 0 (0.0%) | 0 (0.0%) |
| Total | 339 (100.0%) | 421 (100.0%) |
Household Vehicle Usage in Kensett
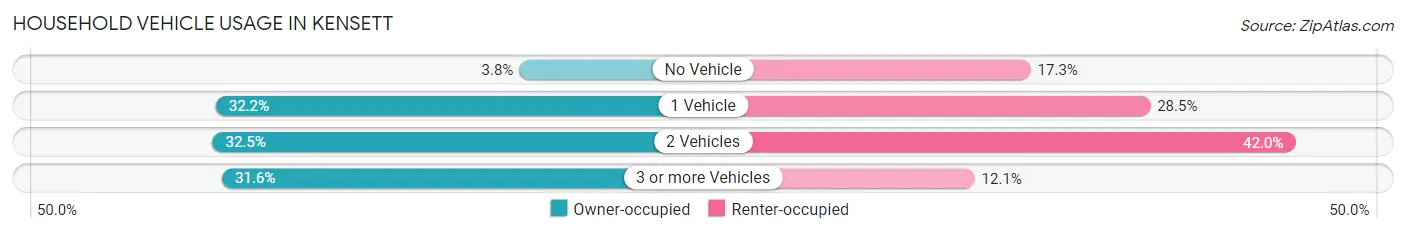
| Vehicles per Household | Owner-occupied | Renter-occupied |
| No Vehicle | 13 (3.8%) | 73 (17.3%) |
| 1 Vehicle | 109 (32.2%) | 120 (28.5%) |
| 2 Vehicles | 110 (32.5%) | 177 (42.0%) |
| 3 or more Vehicles | 107 (31.6%) | 51 (12.1%) |
| Total | 339 (100.0%) | 421 (100.0%) |
Real Estate & Mortgages in Kensett
Real Estate and Mortgage Overview in Kensett
| Characteristic | Without Mortgage | With Mortgage |
| Housing Units | 197 | 142 |
| Median Property Value | $85,000 | $80,000 |
| Median Household Income | $34,567 | $11 |
| Monthly Housing Costs | $395 | $0 |
| Real Estate Taxes | - | - |
Property Value by Mortgage Status in Kensett
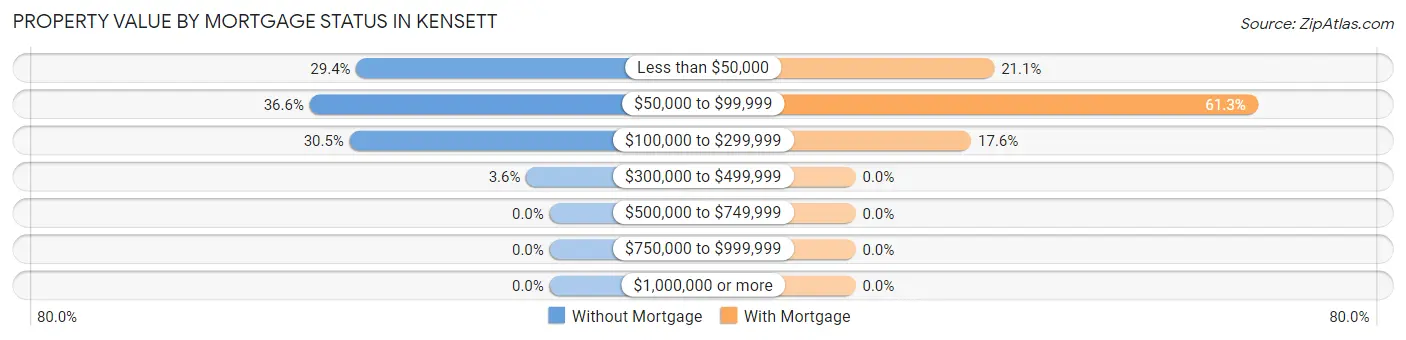
| Property Value | Without Mortgage | With Mortgage |
| Less than $50,000 | 58 (29.4%) | 30 (21.1%) |
| $50,000 to $99,999 | 72 (36.5%) | 87 (61.3%) |
| $100,000 to $299,999 | 60 (30.5%) | 25 (17.6%) |
| $300,000 to $499,999 | 7 (3.5%) | 0 (0.0%) |
| $500,000 to $749,999 | 0 (0.0%) | 0 (0.0%) |
| $750,000 to $999,999 | 0 (0.0%) | 0 (0.0%) |
| $1,000,000 or more | 0 (0.0%) | 0 (0.0%) |
| Total | 197 (100.0%) | 142 (100.0%) |
Household Income by Mortgage Status in Kensett
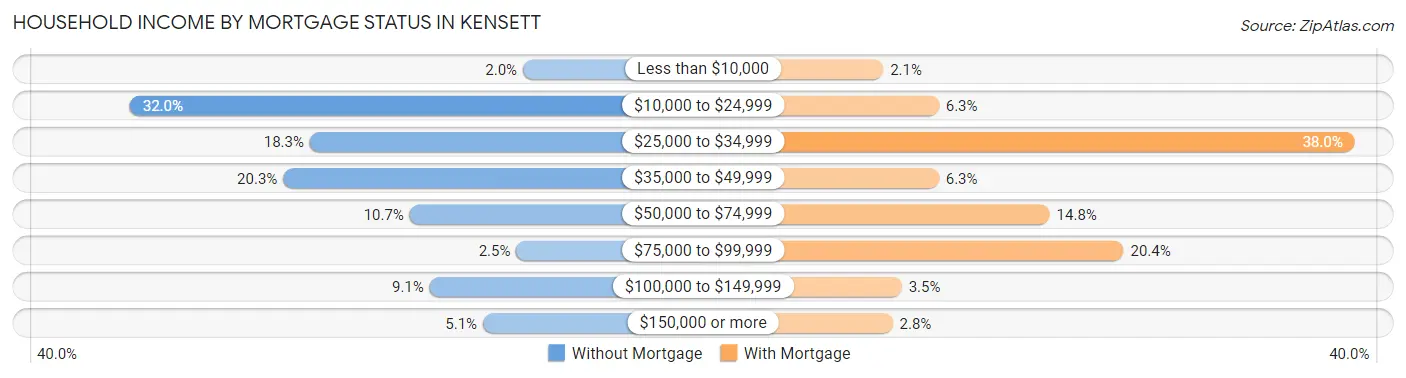
| Household Income | Without Mortgage | With Mortgage |
| Less than $10,000 | 4 (2.0%) | 3 (2.1%) |
| $10,000 to $24,999 | 63 (32.0%) | 9 (6.3%) |
| $25,000 to $34,999 | 36 (18.3%) | 54 (38.0%) |
| $35,000 to $49,999 | 40 (20.3%) | 9 (6.3%) |
| $50,000 to $74,999 | 21 (10.7%) | 21 (14.8%) |
| $75,000 to $99,999 | 5 (2.5%) | 29 (20.4%) |
| $100,000 to $149,999 | 18 (9.1%) | 5 (3.5%) |
| $150,000 or more | 10 (5.1%) | 4 (2.8%) |
| Total | 197 (100.0%) | 142 (100.0%) |
Property Value to Household Income Ratio in Kensett
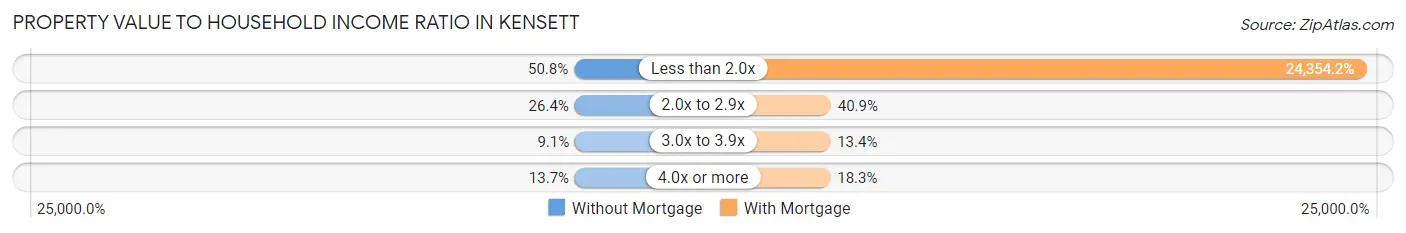
| Value-to-Income Ratio | Without Mortgage | With Mortgage |
| Less than 2.0x | 100 (50.8%) | 34,583 (24,354.2%) |
| 2.0x to 2.9x | 52 (26.4%) | 58 (40.8%) |
| 3.0x to 3.9x | 18 (9.1%) | 19 (13.4%) |
| 4.0x or more | 27 (13.7%) | 26 (18.3%) |
| Total | 197 (100.0%) | 142 (100.0%) |
Real Estate Taxes by Mortgage Status in Kensett
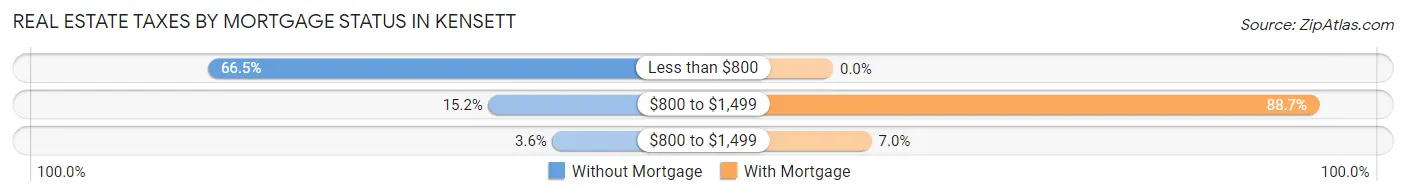
| Property Taxes | Without Mortgage | With Mortgage |
| Less than $800 | 131 (66.5%) | 0 (0.0%) |
| $800 to $1,499 | 30 (15.2%) | 126 (88.7%) |
| $800 to $1,499 | 7 (3.5%) | 10 (7.0%) |
| Total | 197 (100.0%) | 142 (100.0%) |
Health & Disability in Kensett
Health Insurance Coverage by Age in Kensett
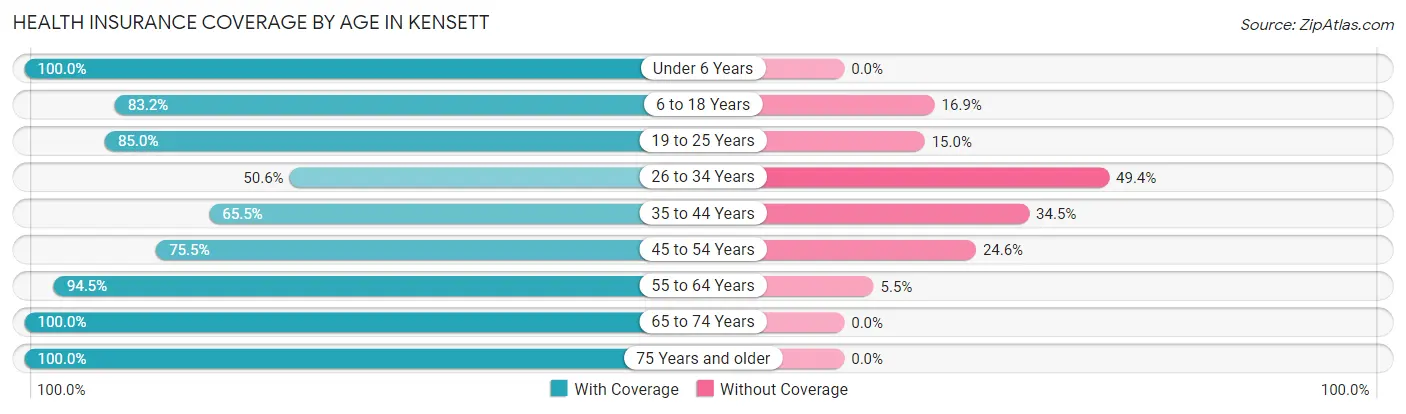
| Age Bracket | With Coverage | Without Coverage |
| Under 6 Years | 189 (100.0%) | 0 (0.0%) |
| 6 to 18 Years | 301 (83.2%) | 61 (16.9%) |
| 19 to 25 Years | 68 (85.0%) | 12 (15.0%) |
| 26 to 34 Years | 162 (50.6%) | 158 (49.4%) |
| 35 to 44 Years | 154 (65.5%) | 81 (34.5%) |
| 45 to 54 Years | 126 (75.4%) | 41 (24.5%) |
| 55 to 64 Years | 225 (94.5%) | 13 (5.5%) |
| 65 to 74 Years | 242 (100.0%) | 0 (0.0%) |
| 75 Years and older | 211 (100.0%) | 0 (0.0%) |
| Total | 1,678 (82.1%) | 366 (17.9%) |
Health Insurance Coverage by Citizenship Status in Kensett
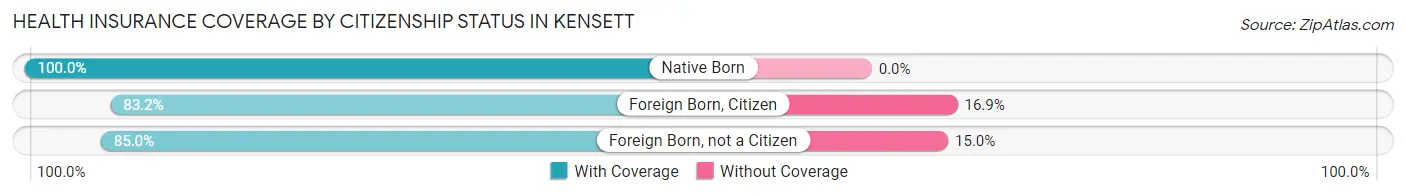
| Citizenship Status | With Coverage | Without Coverage |
| Native Born | 189 (100.0%) | 0 (0.0%) |
| Foreign Born, Citizen | 301 (83.2%) | 61 (16.9%) |
| Foreign Born, not a Citizen | 68 (85.0%) | 12 (15.0%) |
Health Insurance Coverage by Household Income in Kensett
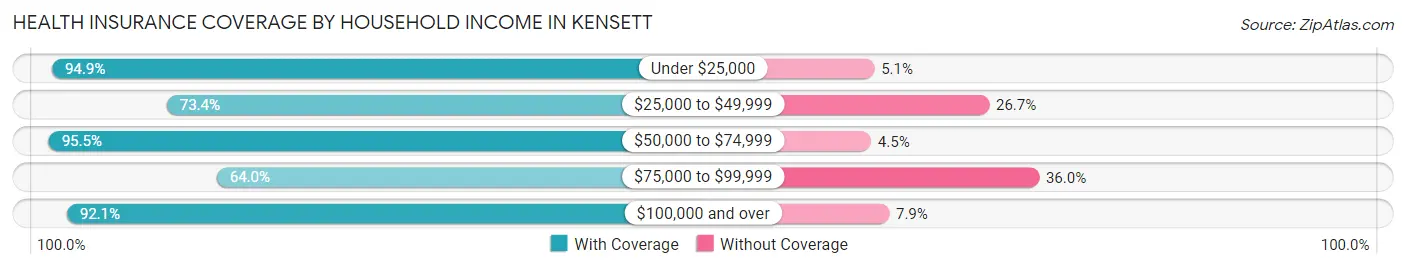
| Household Income | With Coverage | Without Coverage |
| Under $25,000 | 628 (94.9%) | 34 (5.1%) |
| $25,000 to $49,999 | 501 (73.4%) | 182 (26.7%) |
| $50,000 to $74,999 | 190 (95.5%) | 9 (4.5%) |
| $75,000 to $99,999 | 231 (64.0%) | 130 (36.0%) |
| $100,000 and over | 128 (92.1%) | 11 (7.9%) |
Public vs Private Health Insurance Coverage by Age in Kensett
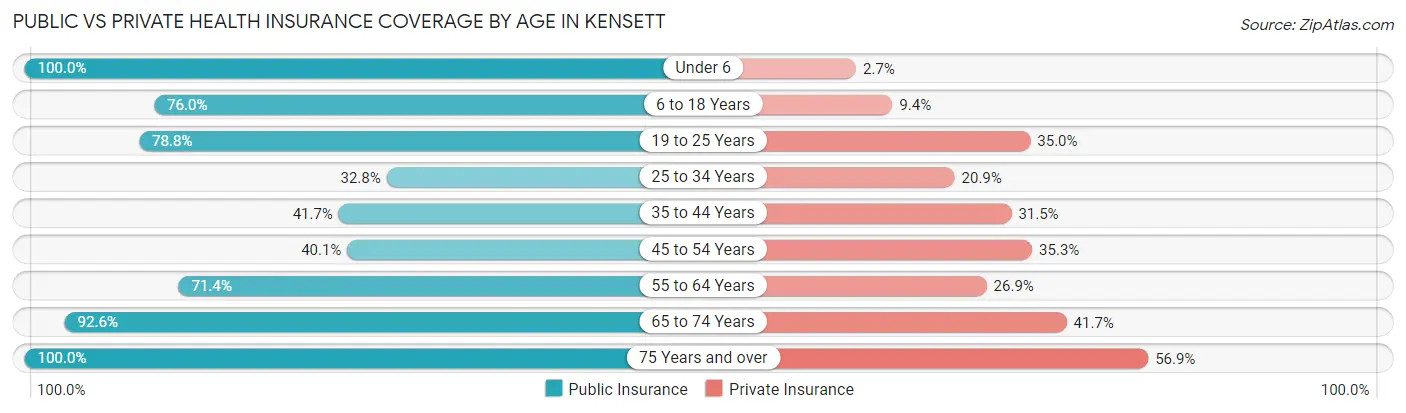
| Age Bracket | Public Insurance | Private Insurance |
| Under 6 | 189 (100.0%) | 5 (2.6%) |
| 6 to 18 Years | 275 (76.0%) | 34 (9.4%) |
| 19 to 25 Years | 63 (78.7%) | 28 (35.0%) |
| 25 to 34 Years | 105 (32.8%) | 67 (20.9%) |
| 35 to 44 Years | 98 (41.7%) | 74 (31.5%) |
| 45 to 54 Years | 67 (40.1%) | 59 (35.3%) |
| 55 to 64 Years | 170 (71.4%) | 64 (26.9%) |
| 65 to 74 Years | 224 (92.6%) | 101 (41.7%) |
| 75 Years and over | 211 (100.0%) | 120 (56.9%) |
| Total | 1,402 (68.6%) | 552 (27.0%) |
Disability Status by Sex by Age in Kensett
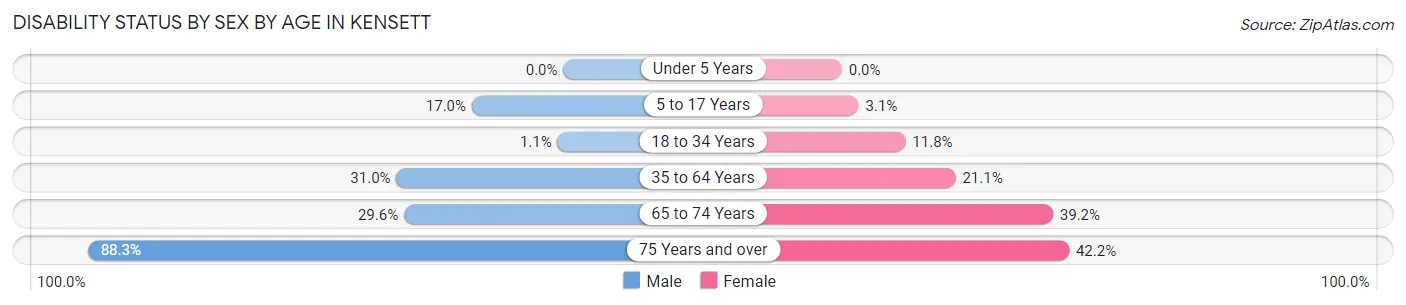
| Age Bracket | Male | Female |
| Under 5 Years | 0 (0.0%) | 0 (0.0%) |
| 5 to 17 Years | 36 (17.0%) | 6 (3.1%) |
| 18 to 34 Years | 3 (1.1%) | 15 (11.8%) |
| 35 to 64 Years | 97 (31.0%) | 69 (21.1%) |
| 65 to 74 Years | 21 (29.6%) | 67 (39.2%) |
| 75 Years and over | 113 (88.3%) | 35 (42.2%) |
Disability Class by Sex by Age in Kensett
Disability Class: Hearing Difficulty
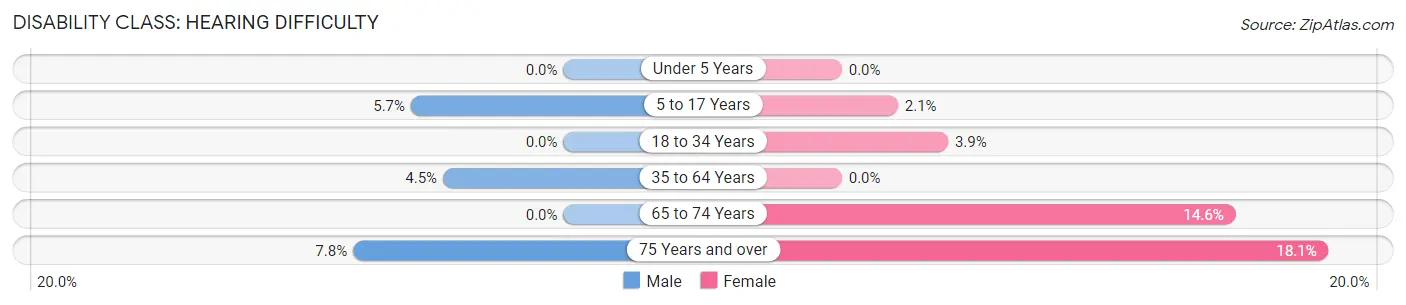
| Age Bracket | Male | Female |
| Under 5 Years | 0 (0.0%) | 0 (0.0%) |
| 5 to 17 Years | 12 (5.7%) | 4 (2.1%) |
| 18 to 34 Years | 0 (0.0%) | 5 (3.9%) |
| 35 to 64 Years | 14 (4.5%) | 0 (0.0%) |
| 65 to 74 Years | 0 (0.0%) | 25 (14.6%) |
| 75 Years and over | 10 (7.8%) | 15 (18.1%) |
Disability Class: Vision Difficulty
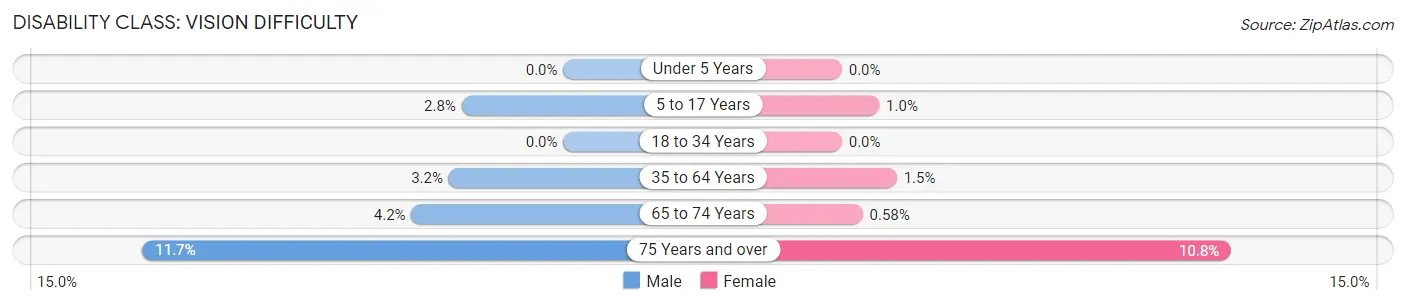
| Age Bracket | Male | Female |
| Under 5 Years | 0 (0.0%) | 0 (0.0%) |
| 5 to 17 Years | 6 (2.8%) | 2 (1.0%) |
| 18 to 34 Years | 0 (0.0%) | 0 (0.0%) |
| 35 to 64 Years | 10 (3.2%) | 5 (1.5%) |
| 65 to 74 Years | 3 (4.2%) | 1 (0.6%) |
| 75 Years and over | 15 (11.7%) | 9 (10.8%) |
Disability Class: Cognitive Difficulty
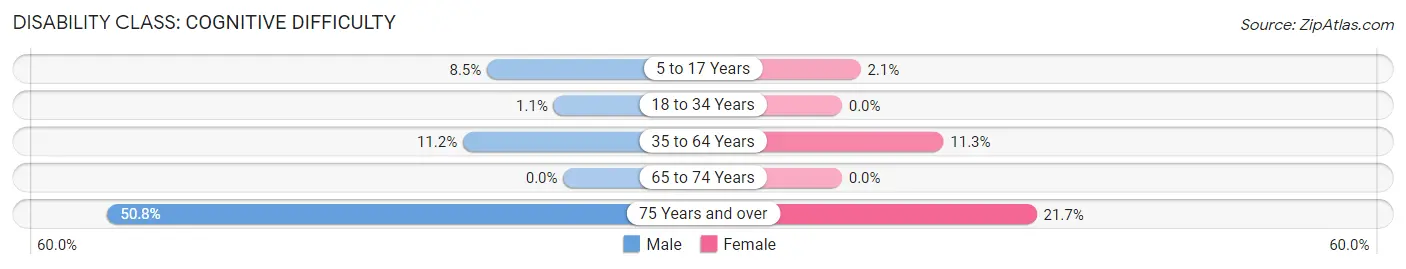
| Age Bracket | Male | Female |
| 5 to 17 Years | 18 (8.5%) | 4 (2.1%) |
| 18 to 34 Years | 3 (1.1%) | 0 (0.0%) |
| 35 to 64 Years | 35 (11.2%) | 37 (11.3%) |
| 65 to 74 Years | 0 (0.0%) | 0 (0.0%) |
| 75 Years and over | 65 (50.8%) | 18 (21.7%) |
Disability Class: Ambulatory Difficulty
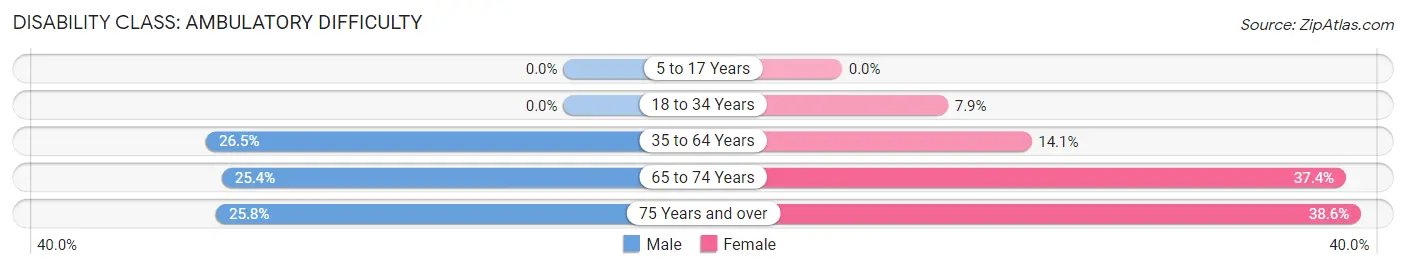
| Age Bracket | Male | Female |
| 5 to 17 Years | 0 (0.0%) | 0 (0.0%) |
| 18 to 34 Years | 0 (0.0%) | 10 (7.9%) |
| 35 to 64 Years | 83 (26.5%) | 46 (14.1%) |
| 65 to 74 Years | 18 (25.4%) | 64 (37.4%) |
| 75 Years and over | 33 (25.8%) | 32 (38.6%) |
Disability Class: Self-Care Difficulty
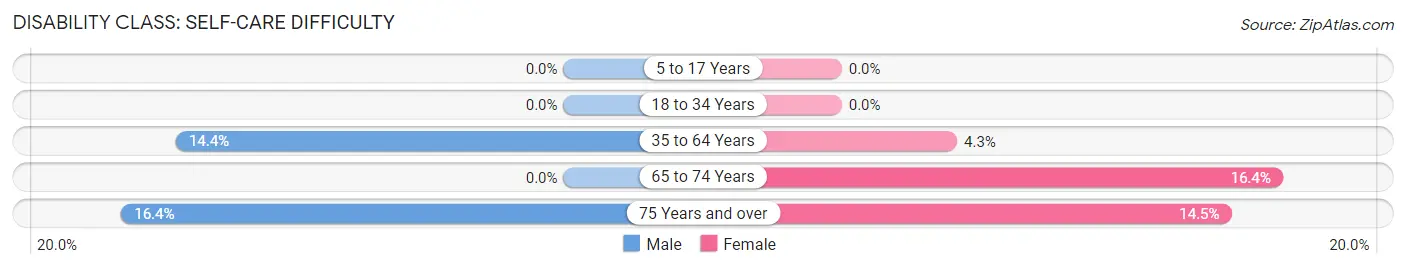
| Age Bracket | Male | Female |
| 5 to 17 Years | 0 (0.0%) | 0 (0.0%) |
| 18 to 34 Years | 0 (0.0%) | 0 (0.0%) |
| 35 to 64 Years | 45 (14.4%) | 14 (4.3%) |
| 65 to 74 Years | 0 (0.0%) | 28 (16.4%) |
| 75 Years and over | 21 (16.4%) | 12 (14.5%) |
Technology Access in Kensett
Computing Device Access in Kensett
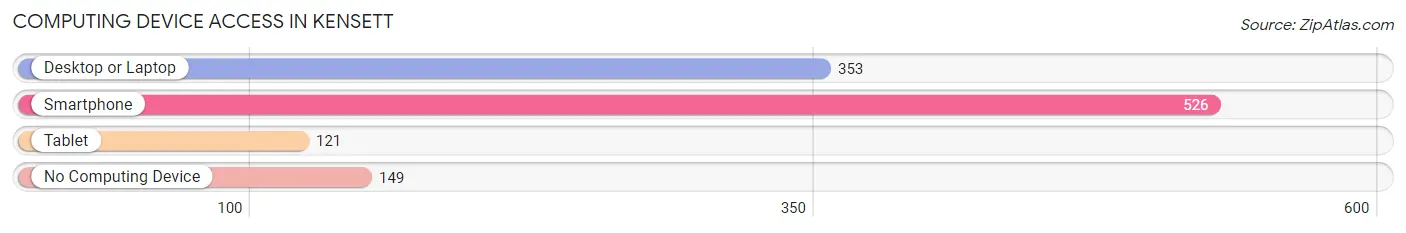
| Device Type | # Households | % Households |
| Desktop or Laptop | 353 | 46.5% |
| Smartphone | 526 | 69.2% |
| Tablet | 121 | 15.9% |
| No Computing Device | 149 | 19.6% |
| Total | 760 | 100.0% |
Internet Access in Kensett
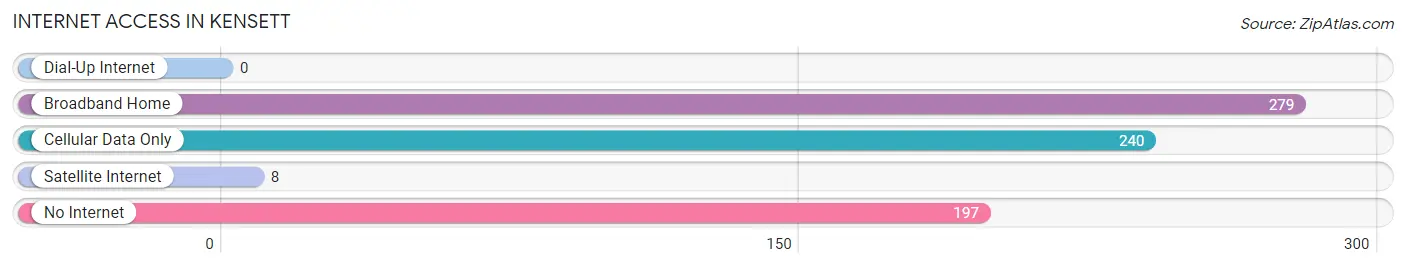
| Internet Type | # Households | % Households |
| Dial-Up Internet | 0 | 0.0% |
| Broadband Home | 279 | 36.7% |
| Cellular Data Only | 240 | 31.6% |
| Satellite Internet | 8 | 1.1% |
| No Internet | 197 | 25.9% |
| Total | 760 | 100.0% |
Kensett Summary
Kensett is a small city located in White County, Arkansas. It is situated in the foothills of the Ozark Mountains, about 25 miles north of Little Rock. The city has a population of 1,845 people, according to the 2010 census.
History
Kensett was founded in 1872 by the St. Louis, Iron Mountain and Southern Railway. The city was named after the railroad's president, William Kensett. The railroad was instrumental in the development of the city, as it provided transportation for the area's agricultural products.
The city was incorporated in 1883 and was home to a variety of businesses, including a cotton gin, a grist mill, a sawmill, and a brickyard. The city also had a hotel, a bank, and a post office.
In the early 1900s, the city experienced a period of growth and prosperity. The population increased from 1,000 in 1900 to 1,500 in 1910. The city was home to a variety of businesses, including a cotton gin, a grist mill, a sawmill, and a brickyard.
Geography
Kensett is located in the foothills of the Ozark Mountains, about 25 miles north of Little Rock. The city is situated on the banks of the White River, which flows through the city. The city is surrounded by rolling hills and forests.
The climate in Kensett is humid subtropical, with hot, humid summers and mild winters. The average annual temperature is 63 degrees Fahrenheit. The average annual precipitation is 48 inches.
Economy
Kensett's economy is largely based on agriculture. The city is home to a variety of farms, including cattle, poultry, and hog farms. The city is also home to a variety of manufacturing businesses, including a furniture factory, a woodworking plant, and a plastics factory.
The city is also home to a variety of retail businesses, including grocery stores, restaurants, and clothing stores. The city is also home to a variety of service businesses, including auto repair shops, beauty salons, and medical offices.
Demographics
According to the 2010 census, the population of Kensett was 1,845. The racial makeup of the city was 95.3% White, 0.7% African American, 0.3% Native American, 0.2% Asian, 0.1% Pacific Islander, and 3.4% from other races.
The median household income in Kensett was $35,938, and the median family income was $41,250. The per capita income was $17,845. About 16.3% of the population was below the poverty line.
Conclusion
Kensett is a small city located in White County, Arkansas. It is situated in the foothills of the Ozark Mountains, about 25 miles north of Little Rock. The city has a population of 1,845 people, according to the 2010 census. The city's economy is largely based on agriculture, and it is home to a variety of retail and service businesses. The racial makeup of the city is 95.3% White, 0.7% African American, 0.3% Native American, 0.2% Asian, 0.1% Pacific Islander, and 3.4% from other races. The median household income in Kensett was $35,938, and the median family income was $41,250. The per capita income was $17,845. About 16.3% of the population was below the poverty line.
Common Questions
What is Per Capita Income in Kensett?
Per Capita income in Kensett is $17,495.
What is the Median Family Income in Kensett?
Median Family Income in Kensett is $29,728.
What is the Median Household income in Kensett?
Median Household Income in Kensett is $28,225.
What is Income or Wage Gap in Kensett?
Income or Wage Gap in Kensett is 34.7%.
Women in Kensett earn 65.3 cents for every dollar earned by a man.
What is Inequality or Gini Index in Kensett?
Inequality or Gini Index in Kensett is 0.42.
What is the Total Population of Kensett?
Total Population of Kensett is 2,044.
What is the Total Male Population of Kensett?
Total Male Population of Kensett is 1,029.
What is the Total Female Population of Kensett?
Total Female Population of Kensett is 1,015.
What is the Ratio of Males per 100 Females in Kensett?
There are 101.38 Males per 100 Females in Kensett.
What is the Ratio of Females per 100 Males in Kensett?
There are 98.64 Females per 100 Males in Kensett.
What is the Median Population Age in Kensett?
Median Population Age in Kensett is 37.5 Years.
What is the Average Family Size in Kensett
Average Family Size in Kensett is 3.5 People.
What is the Average Household Size in Kensett
Average Household Size in Kensett is 2.7 People.
How Large is the Labor Force in Kensett?
There are 740 People in the Labor Forcein in Kensett.
What is the Percentage of People in the Labor Force in Kensett?
46.9% of People are in the Labor Force in Kensett.
What is the Unemployment Rate in Kensett?
Unemployment Rate in Kensett is 7.4%.