Forrest City, AR Map & Demographics
Forrest City Map
Forrest City Overview
$16,551
PER CAPITA INCOME
$39,342
AVG FAMILY INCOME
$36,368
AVG HOUSEHOLD INCOME
11.0%
WAGE / INCOME GAP [ % ]
89.0¢/ $1
WAGE / INCOME GAP [ $ ]
0.49
INEQUALITY / GINI INDEX
13,010
TOTAL POPULATION
7,537
MALE POPULATION
5,473
FEMALE POPULATION
137.71
MALES / 100 FEMALES
72.62
FEMALES / 100 MALES
35.2
MEDIAN AGE
3.3
AVG FAMILY SIZE
2.5
AVG HOUSEHOLD SIZE
4,026
LABOR FORCE [ PEOPLE ]
39.0%
PERCENT IN LABOR FORCE
9.3%
UNEMPLOYMENT RATE
Forrest City Zip Codes
Forrest City Area Codes
Income in Forrest City
Income Overview in Forrest City
Per Capita Income in Forrest City is $16,551, while median incomes of families and households are $39,342 and $36,368 respectively.
| Characteristic | Number | Measure |
| Per Capita Income | 13,010 | $16,551 |
| Median Family Income | 2,382 | $39,342 |
| Mean Family Income | 2,382 | $48,815 |
| Median Household Income | 3,976 | $36,368 |
| Mean Household Income | 3,976 | $49,200 |
| Income Deficit | 2,382 | $0 |
| Wage / Income Gap (%) | 13,010 | 10.97% |
| Wage / Income Gap ($) | 13,010 | 89.03¢ per $1 |
| Gini / Inequality Index | 13,010 | 0.49 |
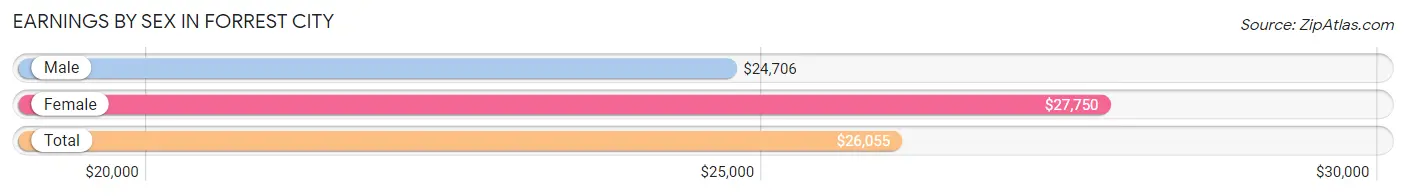
Earnings by Sex in Forrest City
Average Earnings in Forrest City are $26,055, $24,706 for men and $27,750 for women, a difference of 11.0%.
| Sex | Number | Average Earnings |
| Male | 2,600 (55.4%) | $24,706 |
| Female | 2,095 (44.6%) | $27,750 |
| Total | 4,695 (100.0%) | $26,055 |
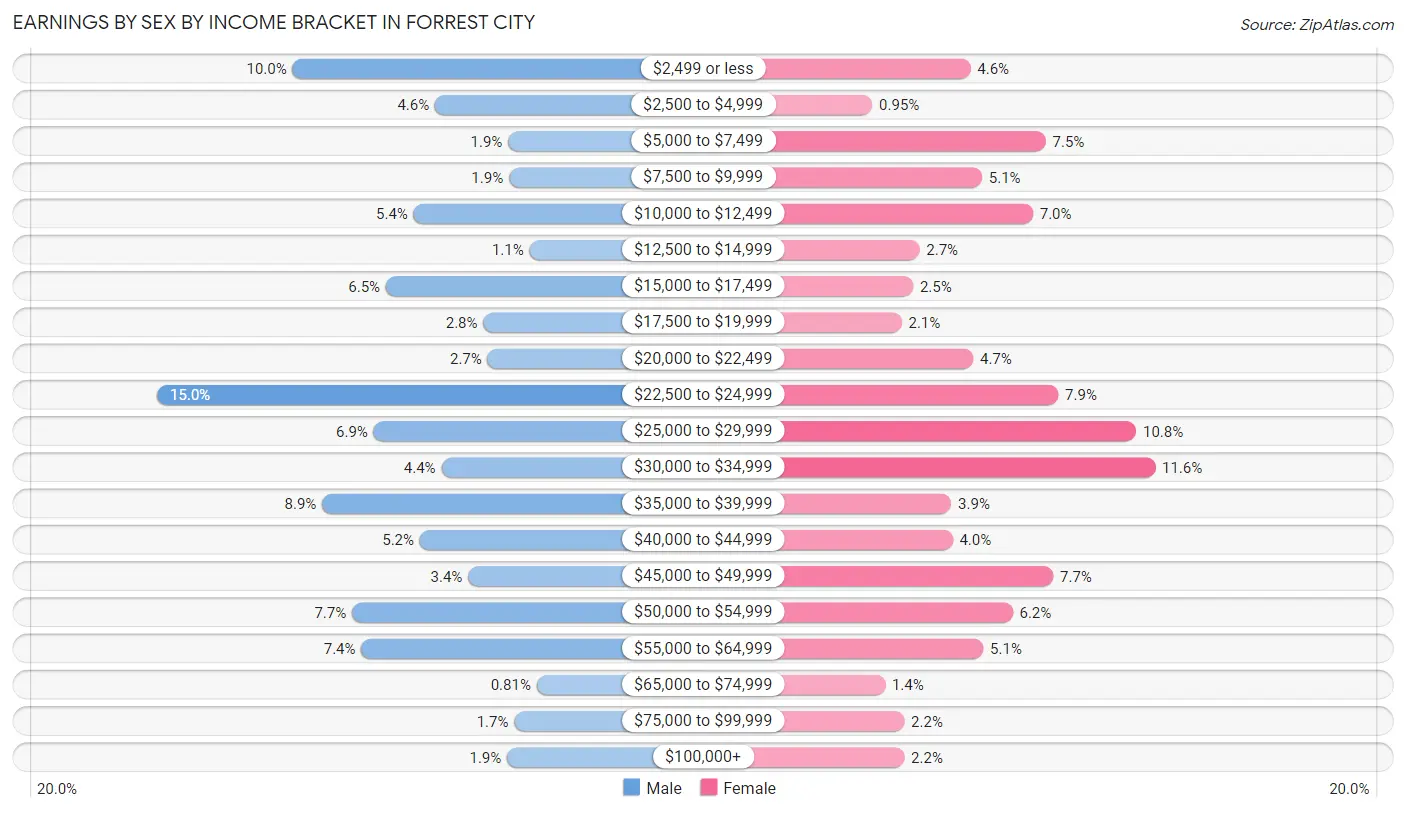
Earnings by Sex by Income Bracket in Forrest City
The most common earnings brackets in Forrest City are $22,500 to $24,999 for men (391 | 15.0%) and $30,000 to $34,999 for women (242 | 11.6%).
| Income | Male | Female |
| $2,499 or less | 259 (10.0%) | 97 (4.6%) |
| $2,500 to $4,999 | 120 (4.6%) | 20 (0.9%) |
| $5,000 to $7,499 | 49 (1.9%) | 156 (7.4%) |
| $7,500 to $9,999 | 48 (1.8%) | 106 (5.1%) |
| $10,000 to $12,499 | 141 (5.4%) | 146 (7.0%) |
| $12,500 to $14,999 | 28 (1.1%) | 57 (2.7%) |
| $15,000 to $17,499 | 168 (6.5%) | 52 (2.5%) |
| $17,500 to $19,999 | 73 (2.8%) | 43 (2.1%) |
| $20,000 to $22,499 | 69 (2.6%) | 99 (4.7%) |
| $22,500 to $24,999 | 391 (15.0%) | 166 (7.9%) |
| $25,000 to $29,999 | 180 (6.9%) | 227 (10.8%) |
| $30,000 to $34,999 | 114 (4.4%) | 242 (11.6%) |
| $35,000 to $39,999 | 230 (8.8%) | 82 (3.9%) |
| $40,000 to $44,999 | 135 (5.2%) | 83 (4.0%) |
| $45,000 to $49,999 | 88 (3.4%) | 162 (7.7%) |
| $50,000 to $54,999 | 201 (7.7%) | 130 (6.2%) |
| $55,000 to $64,999 | 192 (7.4%) | 107 (5.1%) |
| $65,000 to $74,999 | 21 (0.8%) | 30 (1.4%) |
| $75,000 to $99,999 | 43 (1.7%) | 45 (2.1%) |
| $100,000+ | 50 (1.9%) | 45 (2.1%) |
| Total | 2,600 (100.0%) | 2,095 (100.0%) |
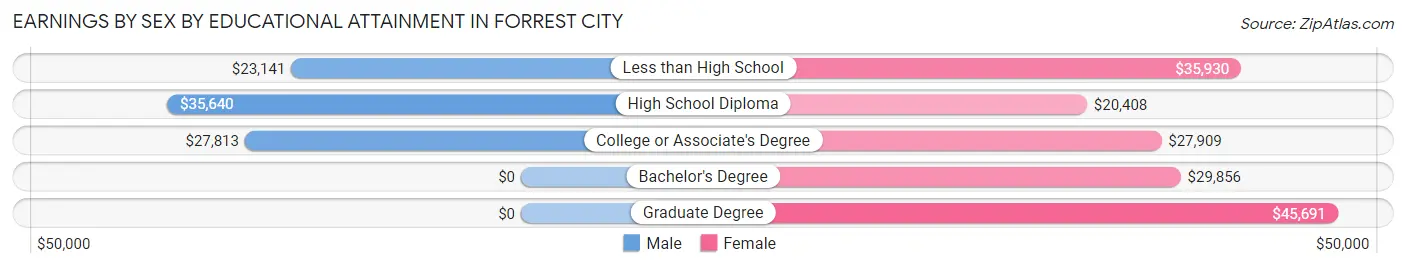
Earnings by Sex by Educational Attainment in Forrest City
Average earnings in Forrest City are $24,840 for men and $29,806 for women, a difference of 16.7%. Men with an educational attainment of high school diploma enjoy the highest average annual earnings of $35,640, while those with less than high school education earn the least with $23,141. Women with an educational attainment of graduate degree earn the most with the average annual earnings of $45,691, while those with high school diploma education have the smallest earnings of $20,408.
| Educational Attainment | Male Income | Female Income |
| Less than High School | $23,141 | $35,930 |
| High School Diploma | $35,640 | $20,408 |
| College or Associate's Degree | $27,813 | $27,909 |
| Bachelor's Degree | - | - |
| Graduate Degree | - | - |
| Total | $24,840 | $29,806 |
Family Income in Forrest City
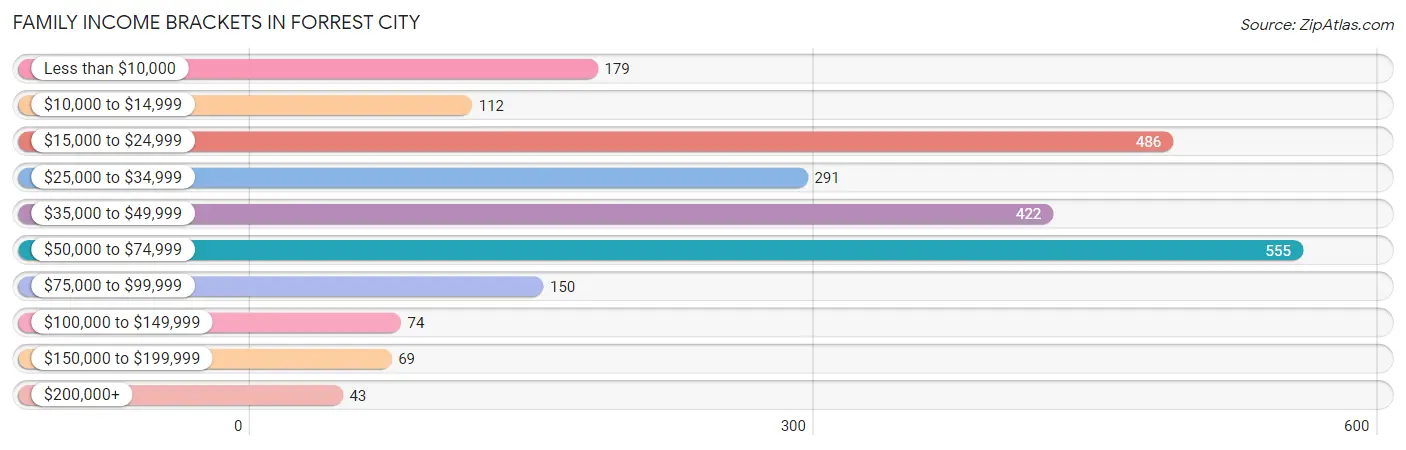
Family Income Brackets in Forrest City
According to the Forrest City family income data, there are 555 families falling into the $50,000 to $74,999 income range, which is the most common income bracket and makes up 23.3% of all families. Conversely, the $200,000+ income bracket is the least frequent group with only 43 families (1.8%) belonging to this category.
| Income Bracket | # Families | % Families |
| Less than $10,000 | 179 | 7.5% |
| $10,000 to $14,999 | 112 | 4.7% |
| $15,000 to $24,999 | 486 | 20.4% |
| $25,000 to $34,999 | 291 | 12.2% |
| $35,000 to $49,999 | 422 | 17.7% |
| $50,000 to $74,999 | 555 | 23.3% |
| $75,000 to $99,999 | 150 | 6.3% |
| $100,000 to $149,999 | 74 | 3.1% |
| $150,000 to $199,999 | 69 | 2.9% |
| $200,000+ | 43 | 1.8% |
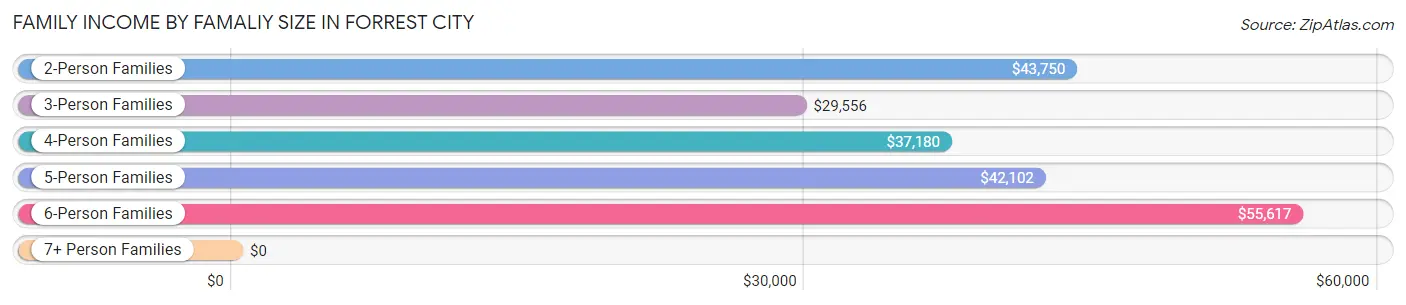
Family Income by Famaliy Size in Forrest City
6-person families (116 | 4.9%) account for the highest median family income in Forrest City with $55,617 per family, while 2-person families (850 | 35.7%) have the highest median income of $21,875 per family member.
| Income Bracket | # Families | Median Income |
| 2-Person Families | 850 (35.7%) | $43,750 |
| 3-Person Families | 908 (38.1%) | $29,556 |
| 4-Person Families | 307 (12.9%) | $37,180 |
| 5-Person Families | 195 (8.2%) | $42,102 |
| 6-Person Families | 116 (4.9%) | $55,617 |
| 7+ Person Families | 6 (0.3%) | $0 |
| Total | 2,382 (100.0%) | $39,342 |
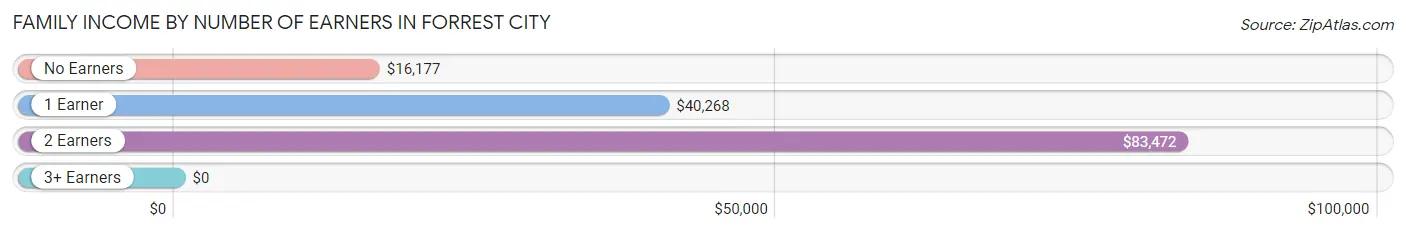
Family Income by Number of Earners in Forrest City
| Number of Earners | # Families | Median Income |
| No Earners | 523 (22.0%) | $16,177 |
| 1 Earner | 1,360 (57.1%) | $40,268 |
| 2 Earners | 407 (17.1%) | $83,472 |
| 3+ Earners | 92 (3.9%) | $0 |
| Total | 2,382 (100.0%) | $39,342 |
Household Income in Forrest City
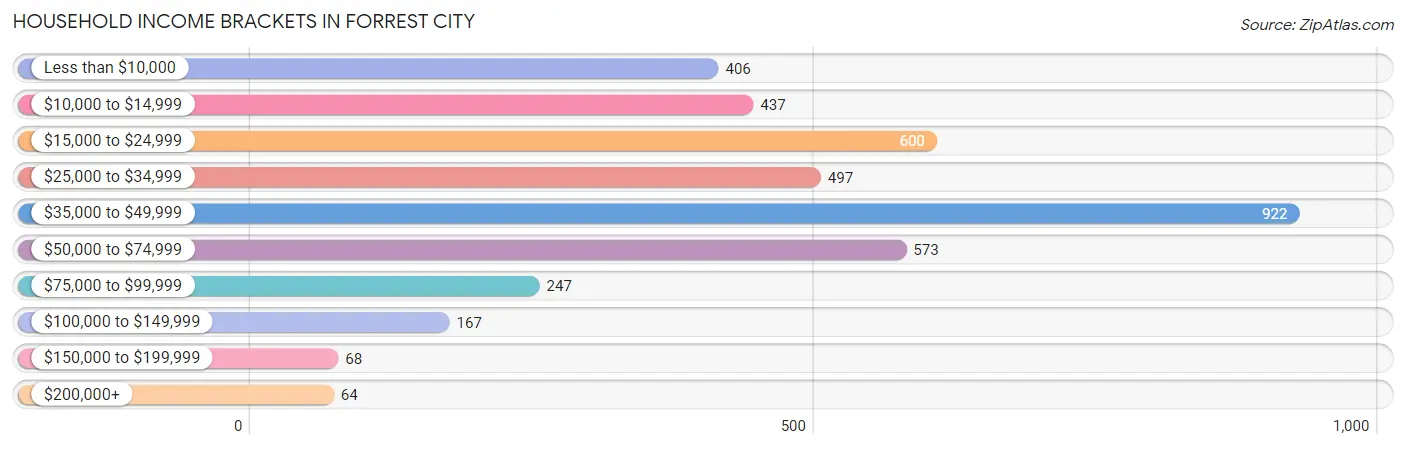
Household Income Brackets in Forrest City
With 922 households falling in the category, the $35,000 to $49,999 income range is the most frequent in Forrest City, accounting for 23.2% of all households. In contrast, only 64 households (1.6%) fall into the $200,000+ income bracket, making it the least populous group.
| Income Bracket | # Households | % Households |
| Less than $10,000 | 406 | 10.2% |
| $10,000 to $14,999 | 437 | 11.0% |
| $15,000 to $24,999 | 600 | 15.1% |
| $25,000 to $34,999 | 497 | 12.5% |
| $35,000 to $49,999 | 922 | 23.2% |
| $50,000 to $74,999 | 573 | 14.4% |
| $75,000 to $99,999 | 247 | 6.2% |
| $100,000 to $149,999 | 167 | 4.2% |
| $150,000 to $199,999 | 68 | 1.7% |
| $200,000+ | 64 | 1.6% |
Household Income by Householder Age in Forrest City
The median household income in Forrest City is $36,368, with the highest median household income of $44,699 found in the 25 to 44 years age bracket for the primary householder. A total of 1,697 households (42.7%) fall into this category. Meanwhile, the 15 to 24 years age bracket for the primary householder has the lowest median household income of $0, with 146 households (3.7%) in this group.
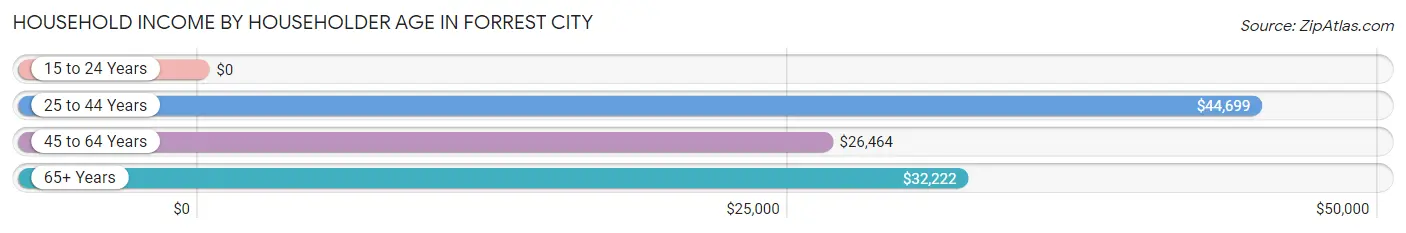
| Income Bracket | # Households | Median Income |
| 15 to 24 Years | 146 (3.7%) | $0 |
| 25 to 44 Years | 1,697 (42.7%) | $44,699 |
| 45 to 64 Years | 1,301 (32.7%) | $26,464 |
| 65+ Years | 832 (20.9%) | $32,222 |
| Total | 3,976 (100.0%) | $36,368 |
Poverty in Forrest City
Income Below Poverty by Sex and Age in Forrest City
With 33.9% poverty level for males and 36.5% for females among the residents of Forrest City, 6 to 11 year old males and under 5 year old females are the most vulnerable to poverty, with 234 males (50.2%) and 256 females (68.3%) in their respective age groups living below the poverty level.
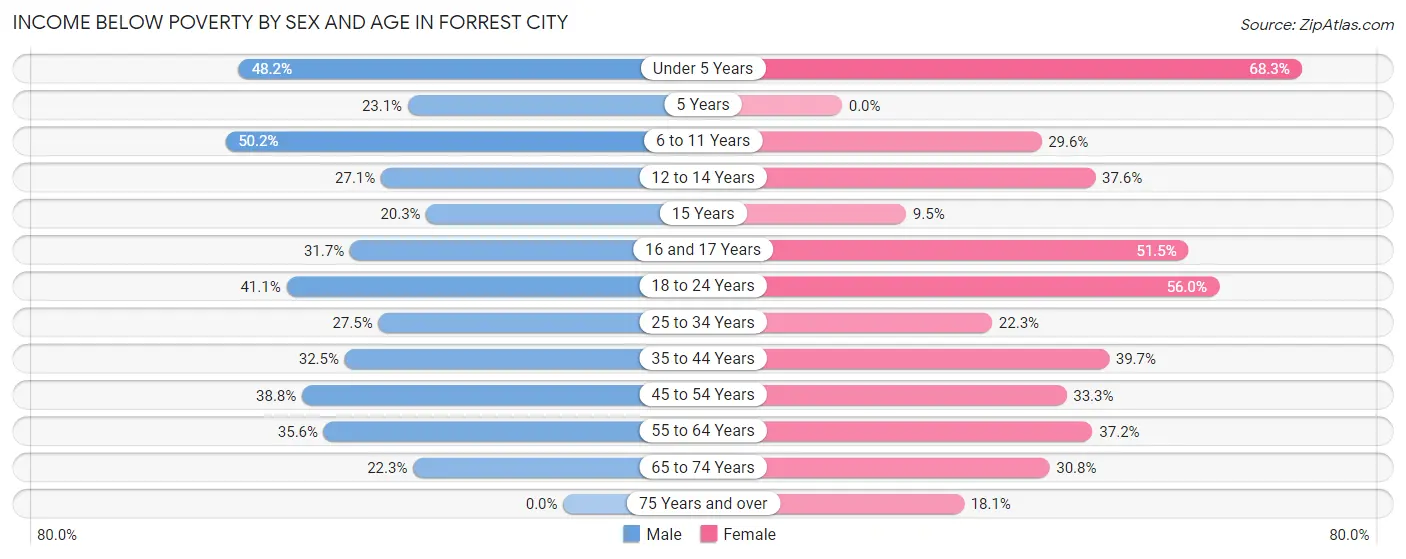
| Age Bracket | Male | Female |
| Under 5 Years | 201 (48.2%) | 256 (68.3%) |
| 5 Years | 36 (23.1%) | 0 (0.0%) |
| 6 to 11 Years | 234 (50.2%) | 159 (29.6%) |
| 12 to 14 Years | 46 (27.1%) | 82 (37.6%) |
| 15 Years | 25 (20.3%) | 6 (9.5%) |
| 16 and 17 Years | 32 (31.7%) | 52 (51.5%) |
| 18 to 24 Years | 229 (41.1%) | 333 (56.0%) |
| 25 to 34 Years | 266 (27.5%) | 173 (22.3%) |
| 35 to 44 Years | 160 (32.5%) | 247 (39.7%) |
| 45 to 54 Years | 83 (38.8%) | 170 (33.3%) |
| 55 to 64 Years | 186 (35.6%) | 259 (37.2%) |
| 65 to 74 Years | 76 (22.3%) | 163 (30.8%) |
| 75 Years and over | 0 (0.0%) | 59 (18.1%) |
| Total | 1,574 (33.9%) | 1,959 (36.5%) |
Income Above Poverty by Sex and Age in Forrest City
According to the poverty statistics in Forrest City, males aged 75 years and over and females aged 5 years are the age groups that are most secure financially, with 100.0% of males and 100.0% of females in these age groups living above the poverty line.
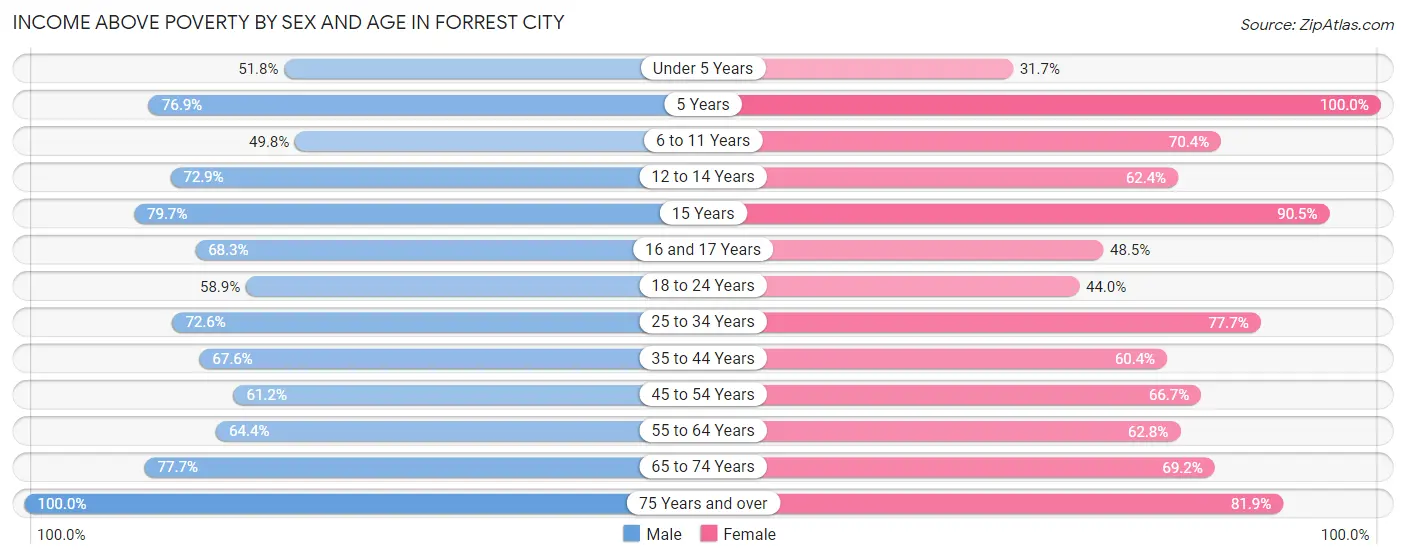
| Age Bracket | Male | Female |
| Under 5 Years | 216 (51.8%) | 119 (31.7%) |
| 5 Years | 120 (76.9%) | 22 (100.0%) |
| 6 to 11 Years | 232 (49.8%) | 378 (70.4%) |
| 12 to 14 Years | 124 (72.9%) | 136 (62.4%) |
| 15 Years | 98 (79.7%) | 57 (90.5%) |
| 16 and 17 Years | 69 (68.3%) | 49 (48.5%) |
| 18 to 24 Years | 328 (58.9%) | 262 (44.0%) |
| 25 to 34 Years | 703 (72.6%) | 603 (77.7%) |
| 35 to 44 Years | 333 (67.5%) | 376 (60.4%) |
| 45 to 54 Years | 131 (61.2%) | 340 (66.7%) |
| 55 to 64 Years | 337 (64.4%) | 437 (62.8%) |
| 65 to 74 Years | 265 (77.7%) | 366 (69.2%) |
| 75 Years and over | 107 (100.0%) | 267 (81.9%) |
| Total | 3,063 (66.1%) | 3,412 (63.5%) |
Income Below Poverty Among Married-Couple Families in Forrest City
The poverty statistics for married-couple families in Forrest City show that 37.0% or 443 of the total 1,198 families live below the poverty line. Families with 5 or more children have the highest poverty rate of 100.0%, comprising of 6 families. On the other hand, families with no children have the lowest poverty rate of 19.4%, which includes 113 families.
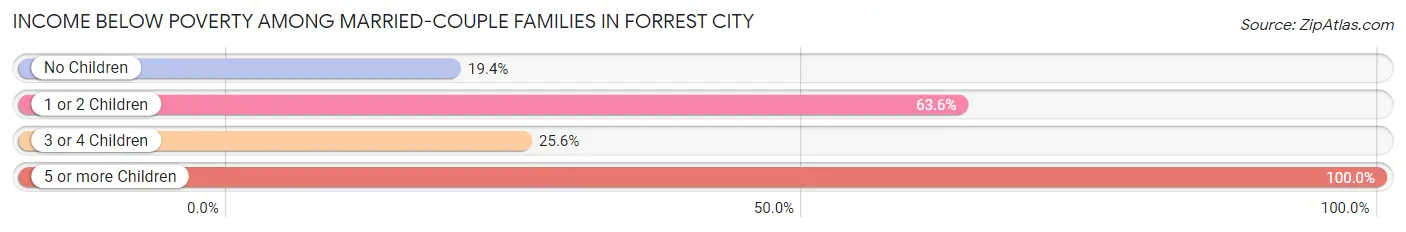
| Children | Above Poverty | Below Poverty |
| No Children | 469 (80.6%) | 113 (19.4%) |
| 1 or 2 Children | 161 (36.4%) | 281 (63.6%) |
| 3 or 4 Children | 125 (74.4%) | 43 (25.6%) |
| 5 or more Children | 0 (0.0%) | 6 (100.0%) |
| Total | 755 (63.0%) | 443 (37.0%) |
Income Below Poverty Among Single-Parent Households in Forrest City
According to the poverty data in Forrest City, 10.0% or 9 single-father households and 31.0% or 339 single-mother households are living below the poverty line. Among single-father households, those with 1 or 2 children have the highest poverty rate, with 9 households (52.9%) experiencing poverty. Likewise, among single-mother households, those with 5 or more children have the highest poverty rate, with 7 households (100.0%) falling below the poverty line.
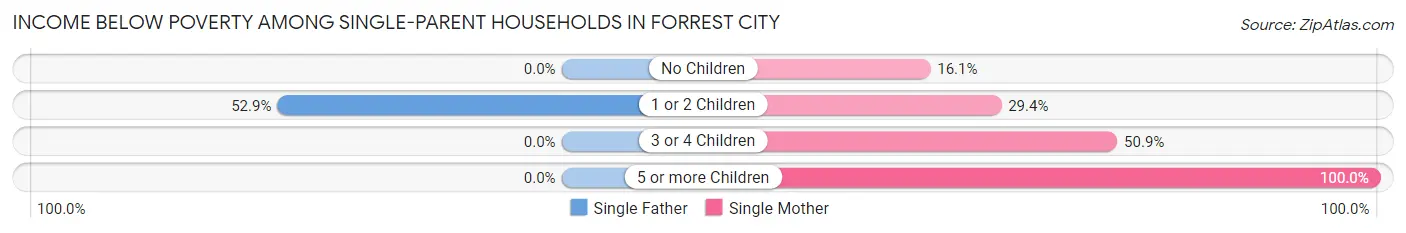
| Children | Single Father | Single Mother |
| No Children | 0 (0.0%) | 40 (16.1%) |
| 1 or 2 Children | 9 (52.9%) | 184 (29.3%) |
| 3 or 4 Children | 0 (0.0%) | 108 (50.9%) |
| 5 or more Children | 0 (0.0%) | 7 (100.0%) |
| Total | 9 (10.0%) | 339 (31.0%) |
Income Below Poverty Among Married-Couple vs Single-Parent Households in Forrest City
The poverty data for Forrest City shows that 443 of the married-couple family households (37.0%) and 348 of the single-parent households (29.4%) are living below the poverty level. Within the married-couple family households, those with 5 or more children have the highest poverty rate, with 6 households (100.0%) falling below the poverty line. Among the single-parent households, those with 5 or more children have the highest poverty rate, with 7 household (100.0%) living below poverty.
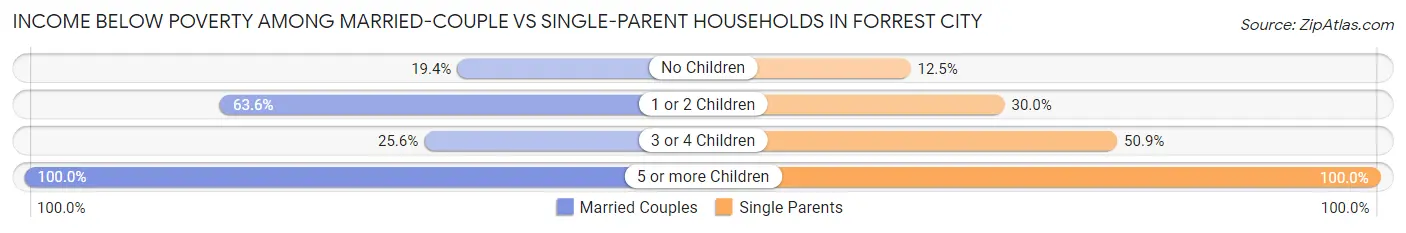
| Children | Married-Couple Families | Single-Parent Households |
| No Children | 113 (19.4%) | 40 (12.5%) |
| 1 or 2 Children | 281 (63.6%) | 193 (30.0%) |
| 3 or 4 Children | 43 (25.6%) | 108 (50.9%) |
| 5 or more Children | 6 (100.0%) | 7 (100.0%) |
| Total | 443 (37.0%) | 348 (29.4%) |
Race in Forrest City
The most populous races in Forrest City are Black / African American (9,303 | 71.5%), White / Caucasian (3,005 | 23.1%), and Hispanic or Latino (749 | 5.8%).
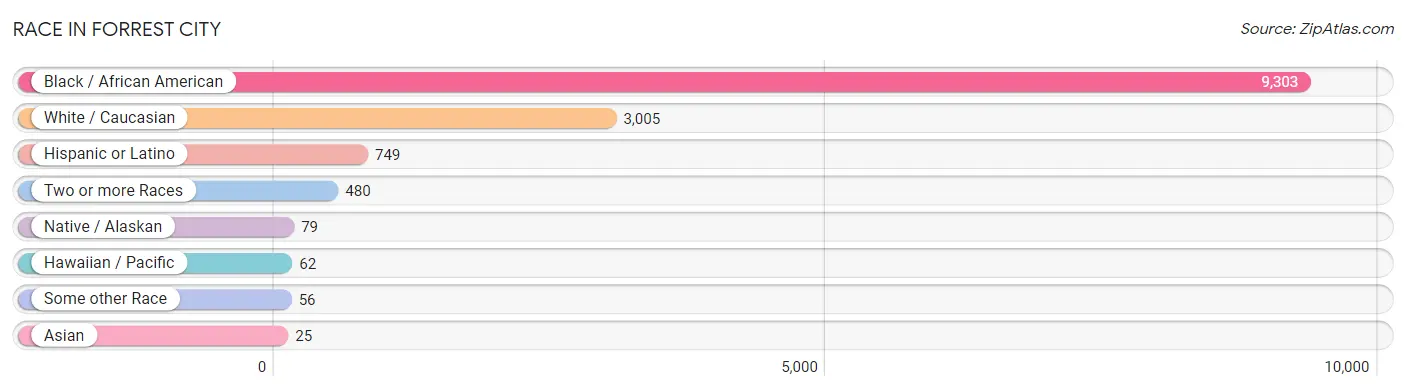
| Race | # Population | % Population |
| Asian | 25 | 0.2% |
| Black / African American | 9,303 | 71.5% |
| Hawaiian / Pacific | 62 | 0.5% |
| Hispanic or Latino | 749 | 5.8% |
| Native / Alaskan | 79 | 0.6% |
| White / Caucasian | 3,005 | 23.1% |
| Two or more Races | 480 | 3.7% |
| Some other Race | 56 | 0.4% |
| Total | 13,010 | 100.0% |
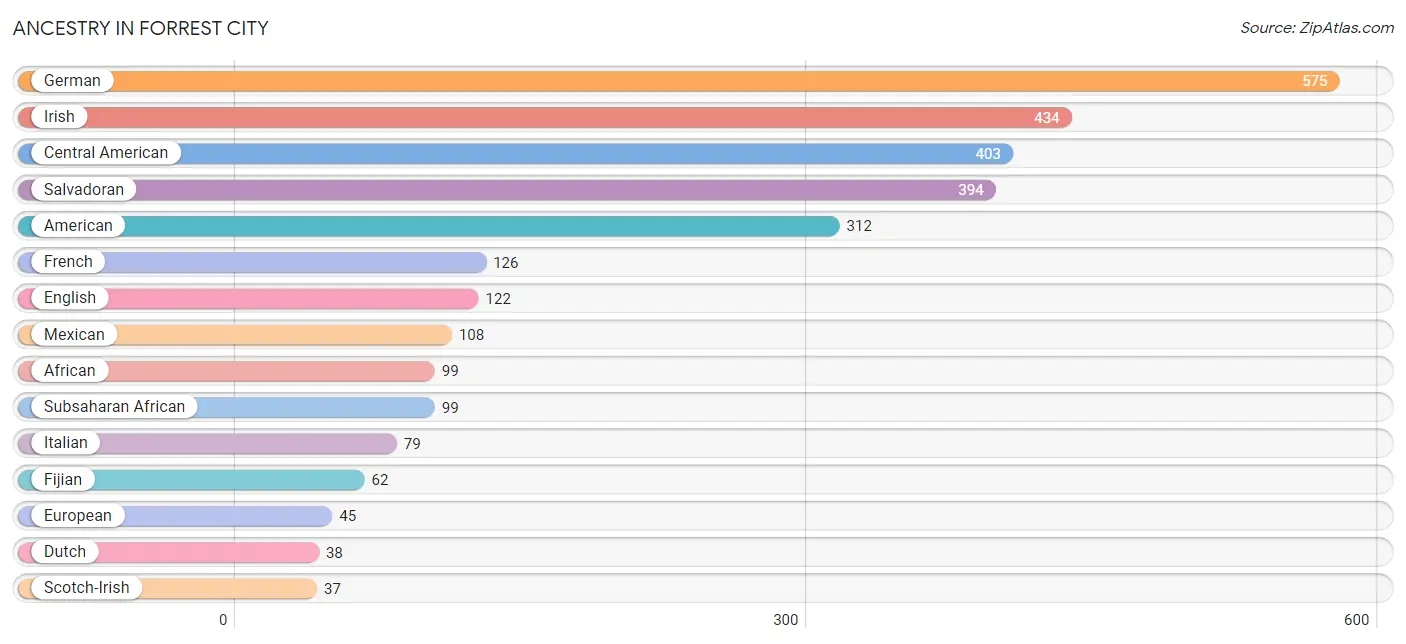
Ancestry in Forrest City
The most populous ancestries reported in Forrest City are German (575 | 4.4%), Irish (434 | 3.3%), Central American (403 | 3.1%), Salvadoran (394 | 3.0%), and American (312 | 2.4%), together accounting for 16.3% of all Forrest City residents.
| Ancestry | # Population | % Population |
| African | 99 | 0.8% |
| American | 312 | 2.4% |
| Apache | 9 | 0.1% |
| Arab | 19 | 0.2% |
| British | 31 | 0.2% |
| Burmese | 9 | 0.1% |
| Central American | 403 | 3.1% |
| Cherokee | 18 | 0.1% |
| Choctaw | 7 | 0.1% |
| Colville | 9 | 0.1% |
| Czech | 9 | 0.1% |
| Danish | 9 | 0.1% |
| Dutch | 38 | 0.3% |
| English | 122 | 0.9% |
| European | 45 | 0.4% |
| Fijian | 62 | 0.5% |
| Finnish | 9 | 0.1% |
| French | 126 | 1.0% |
| French Canadian | 7 | 0.1% |
| German | 575 | 4.4% |
| Guatemalan | 9 | 0.1% |
| Iraqi | 10 | 0.1% |
| Irish | 434 | 3.3% |
| Italian | 79 | 0.6% |
| Mexican | 108 | 0.8% |
| Mexican American Indian | 9 | 0.1% |
| Moroccan | 9 | 0.1% |
| Norwegian | 12 | 0.1% |
| Polish | 19 | 0.2% |
| Puerto Rican | 18 | 0.1% |
| Salvadoran | 394 | 3.0% |
| Scandinavian | 9 | 0.1% |
| Scotch-Irish | 37 | 0.3% |
| Scottish | 24 | 0.2% |
| Subsaharan African | 99 | 0.8% |
| Thai | 26 | 0.2% |
| Welsh | 16 | 0.1% | View All 37 Rows |
Immigrants in Forrest City
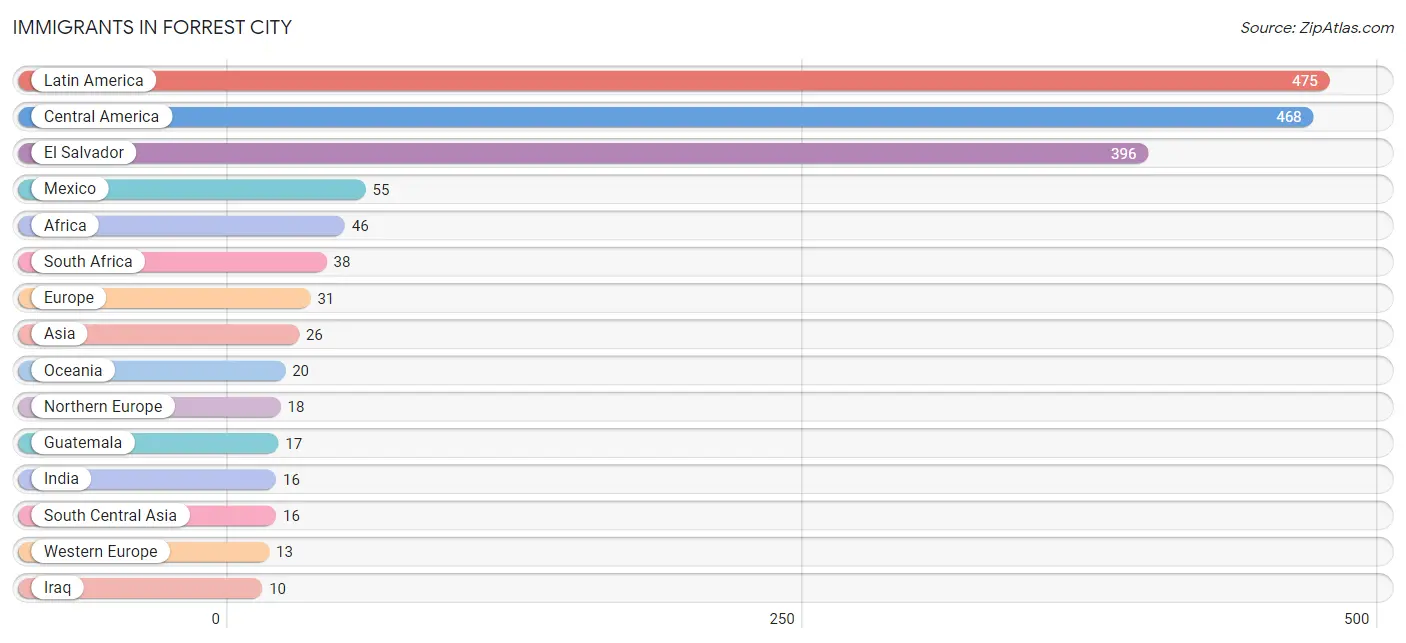
The most numerous immigrant groups reported in Forrest City came from Latin America (475 | 3.6%), Central America (468 | 3.6%), El Salvador (396 | 3.0%), Mexico (55 | 0.4%), and Africa (46 | 0.4%), together accounting for 11.1% of all Forrest City residents.
| Immigration Origin | # Population | % Population |
| Africa | 46 | 0.4% |
| Asia | 26 | 0.2% |
| Caribbean | 7 | 0.1% |
| Central America | 468 | 3.6% |
| Dominican Republic | 7 | 0.1% |
| El Salvador | 396 | 3.0% |
| England | 9 | 0.1% |
| Europe | 31 | 0.2% |
| France | 6 | 0.1% |
| Germany | 7 | 0.1% |
| Guatemala | 17 | 0.1% |
| India | 16 | 0.1% |
| Iraq | 10 | 0.1% |
| Latin America | 475 | 3.6% |
| Mexico | 55 | 0.4% |
| Nigeria | 8 | 0.1% |
| Northern Europe | 18 | 0.1% |
| Norway | 9 | 0.1% |
| Oceania | 20 | 0.2% |
| South Africa | 38 | 0.3% |
| South Central Asia | 16 | 0.1% |
| Western Africa | 8 | 0.1% |
| Western Asia | 10 | 0.1% |
| Western Europe | 13 | 0.1% | View All 24 Rows |
Sex and Age in Forrest City
Sex and Age in Forrest City
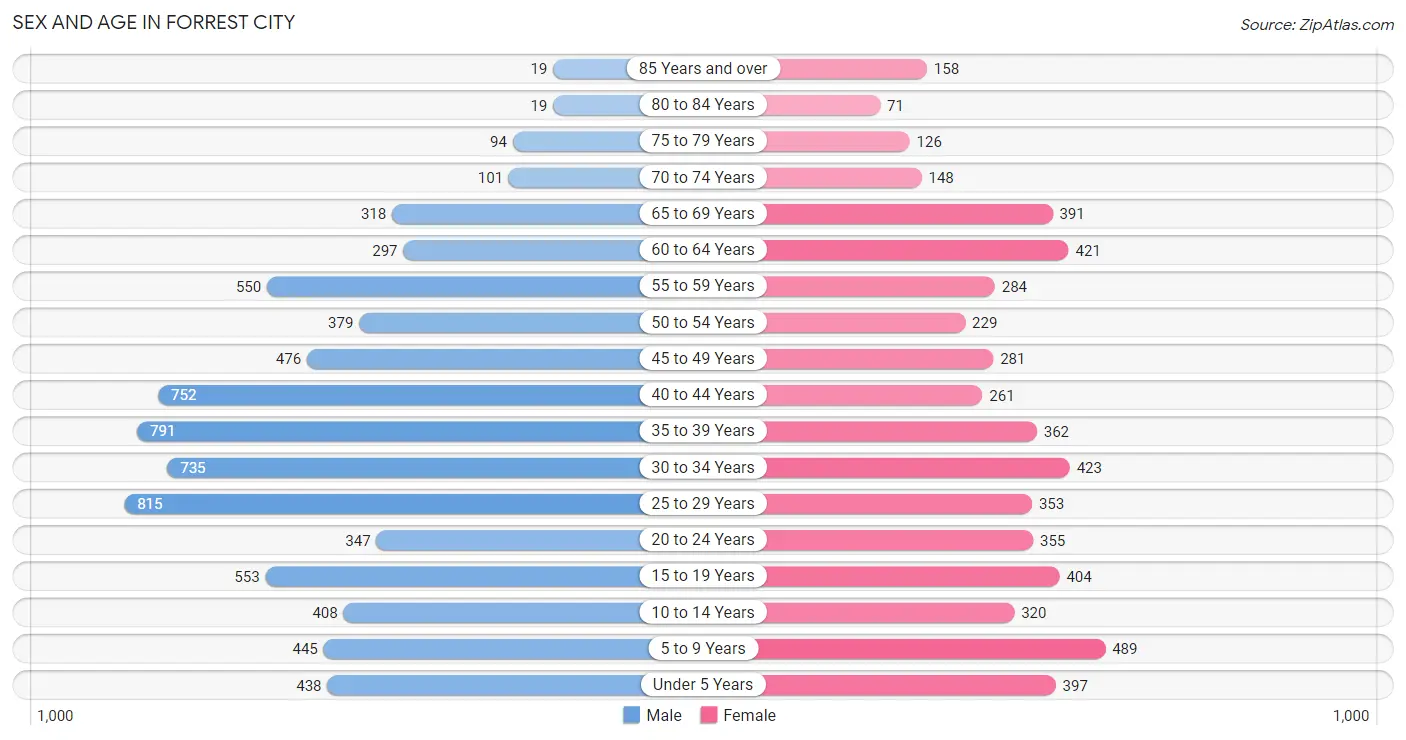
The most populous age groups in Forrest City are 25 to 29 Years (815 | 10.8%) for men and 5 to 9 Years (489 | 8.9%) for women.
| Age Bracket | Male | Female |
| Under 5 Years | 438 (5.8%) | 397 (7.2%) |
| 5 to 9 Years | 445 (5.9%) | 489 (8.9%) |
| 10 to 14 Years | 408 (5.4%) | 320 (5.9%) |
| 15 to 19 Years | 553 (7.3%) | 404 (7.4%) |
| 20 to 24 Years | 347 (4.6%) | 355 (6.5%) |
| 25 to 29 Years | 815 (10.8%) | 353 (6.5%) |
| 30 to 34 Years | 735 (9.8%) | 423 (7.7%) |
| 35 to 39 Years | 791 (10.5%) | 362 (6.6%) |
| 40 to 44 Years | 752 (10.0%) | 261 (4.8%) |
| 45 to 49 Years | 476 (6.3%) | 281 (5.1%) |
| 50 to 54 Years | 379 (5.0%) | 229 (4.2%) |
| 55 to 59 Years | 550 (7.3%) | 284 (5.2%) |
| 60 to 64 Years | 297 (3.9%) | 421 (7.7%) |
| 65 to 69 Years | 318 (4.2%) | 391 (7.1%) |
| 70 to 74 Years | 101 (1.3%) | 148 (2.7%) |
| 75 to 79 Years | 94 (1.3%) | 126 (2.3%) |
| 80 to 84 Years | 19 (0.3%) | 71 (1.3%) |
| 85 Years and over | 19 (0.3%) | 158 (2.9%) |
| Total | 7,537 (100.0%) | 5,473 (100.0%) |
Families and Households in Forrest City
Median Family Size in Forrest City
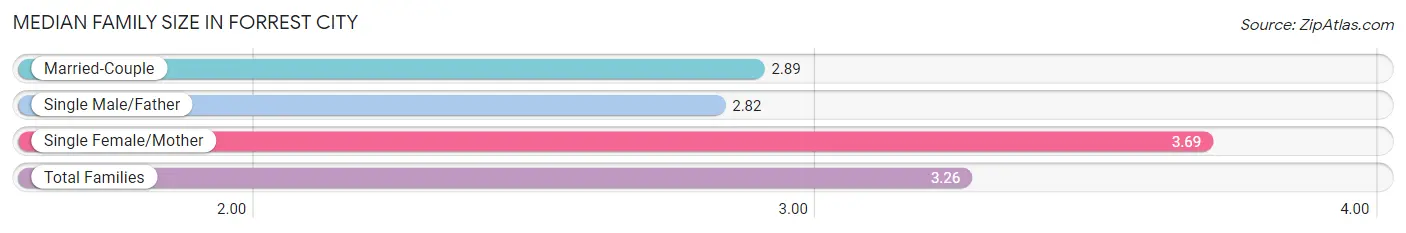
The median family size in Forrest City is 3.26 persons per family, with single female/mother families (1,094 | 45.9%) accounting for the largest median family size of 3.69 persons per family. On the other hand, single male/father families (90 | 3.8%) represent the smallest median family size with 2.82 persons per family.
| Family Type | # Families | Family Size |
| Married-Couple | 1,198 (50.3%) | 2.89 |
| Single Male/Father | 90 (3.8%) | 2.82 |
| Single Female/Mother | 1,094 (45.9%) | 3.69 |
| Total Families | 2,382 (100.0%) | 3.26 |
Median Household Size in Forrest City
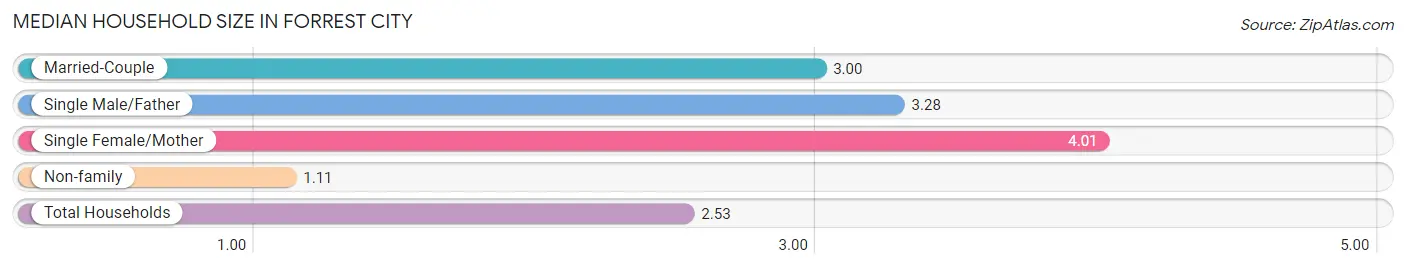
The median household size in Forrest City is 2.53 persons per household, with single female/mother households (1,094 | 27.5%) accounting for the largest median household size of 4.01 persons per household. non-family households (1,594 | 40.1%) represent the smallest median household size with 1.11 persons per household.
| Household Type | # Households | Household Size |
| Married-Couple | 1,198 (30.1%) | 3.00 |
| Single Male/Father | 90 (2.3%) | 3.28 |
| Single Female/Mother | 1,094 (27.5%) | 4.01 |
| Non-family | 1,594 (40.1%) | 1.11 |
| Total Households | 3,976 (100.0%) | 2.53 |
Household Size by Marriage Status in Forrest City
Out of a total of 3,976 households in Forrest City, 2,382 (59.9%) are family households, while 1,594 (40.1%) are nonfamily households. The most numerous type of family households are 2-person households, comprising 753, and the most common type of nonfamily households are 1-person households, comprising 1,512.
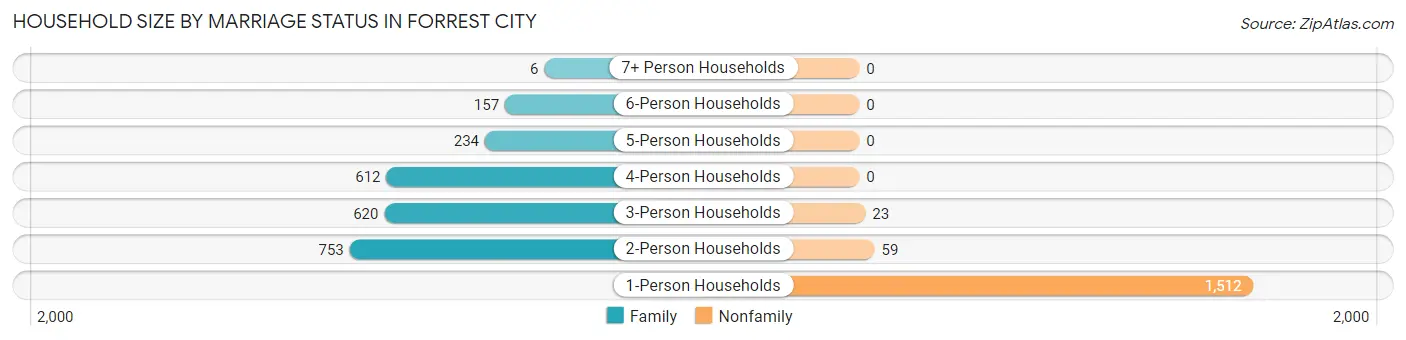
| Household Size | Family Households | Nonfamily Households |
| 1-Person Households | - | 1,512 (38.0%) |
| 2-Person Households | 753 (18.9%) | 59 (1.5%) |
| 3-Person Households | 620 (15.6%) | 23 (0.6%) |
| 4-Person Households | 612 (15.4%) | 0 (0.0%) |
| 5-Person Households | 234 (5.9%) | 0 (0.0%) |
| 6-Person Households | 157 (4.0%) | 0 (0.0%) |
| 7+ Person Households | 6 (0.2%) | 0 (0.0%) |
| Total | 2,382 (59.9%) | 1,594 (40.1%) |
Female Fertility in Forrest City
Fertility by Age in Forrest City
Average fertility rate in Forrest City is 78.0 births per 1,000 women. Women in the age bracket of 20 to 34 years have the highest fertility rate with 127.0 births per 1,000 women. Women in the age bracket of 20 to 34 years acount for 75.4% of all women with births.
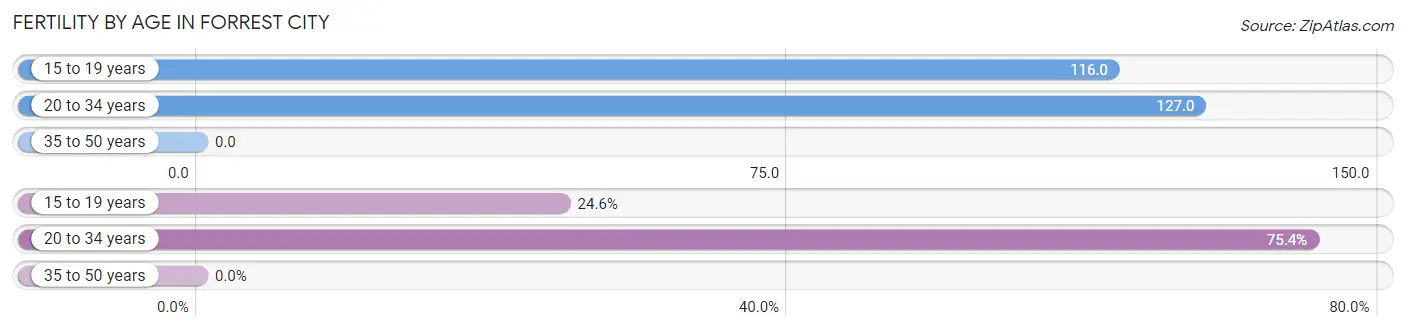
| Age Bracket | Women with Births | Births / 1,000 Women |
| 15 to 19 years | 47 (24.6%) | 116.0 |
| 20 to 34 years | 144 (75.4%) | 127.0 |
| 35 to 50 years | 0 (0.0%) | 0.0 |
| Total | 191 (100.0%) | 78.0 |
Fertility by Age by Marriage Status in Forrest City
34.0% of women with births (191) in Forrest City are married. The highest percentage of unmarried women with births falls into 15 to 19 years age bracket with 100.0% of them unmarried at the time of birth, while the lowest percentage of unmarried women with births belong to 20 to 34 years age bracket with 54.9% of them unmarried.
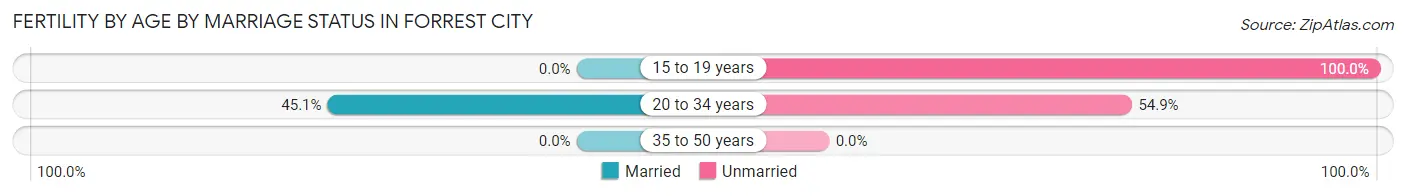
| Age Bracket | Married | Unmarried |
| 15 to 19 years | 0 (0.0%) | 47 (100.0%) |
| 20 to 34 years | 65 (45.1%) | 79 (54.9%) |
| 35 to 50 years | 0 (0.0%) | 0 (0.0%) |
| Total | 65 (34.0%) | 126 (66.0%) |
Fertility by Education in Forrest City
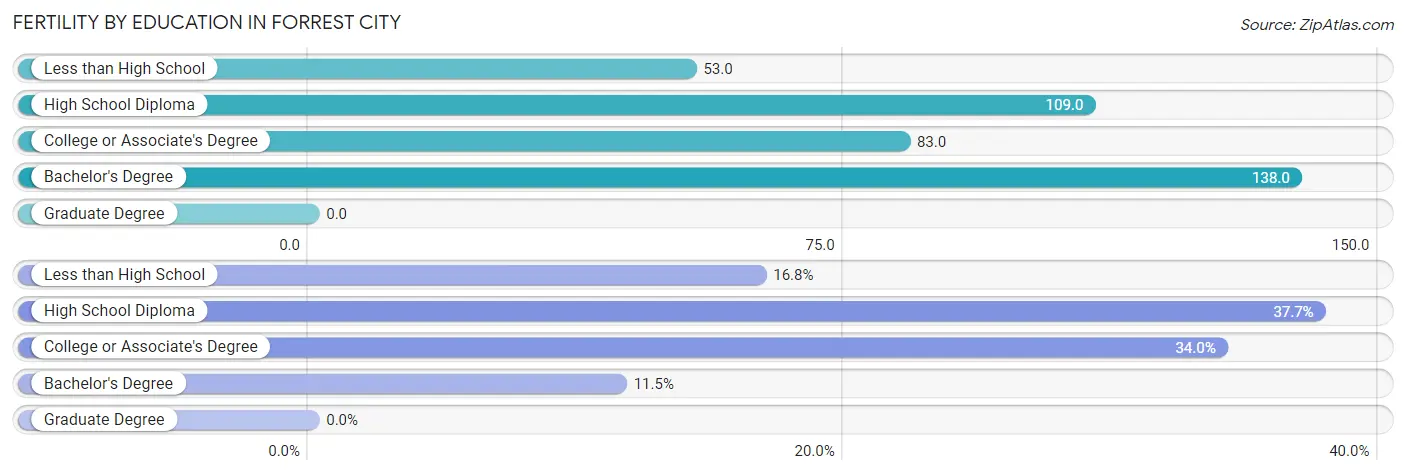
| Educational Attainment | Women with Births | Births / 1,000 Women |
| Less than High School | 32 (16.8%) | 53.0 |
| High School Diploma | 72 (37.7%) | 109.0 |
| College or Associate's Degree | 65 (34.0%) | 83.0 |
| Bachelor's Degree | 22 (11.5%) | 138.0 |
| Graduate Degree | 0 (0.0%) | 0.0 |
| Total | 191 (100.0%) | 78.0 |
Fertility by Education by Marriage Status in Forrest City
66.0% of women with births in Forrest City are unmarried. Women with the educational attainment of college or associate's degree are most likely to be married with 100.0% of them married at childbirth, while women with the educational attainment of less than high school are least likely to be married with 100.0% of them unmarried at childbirth.
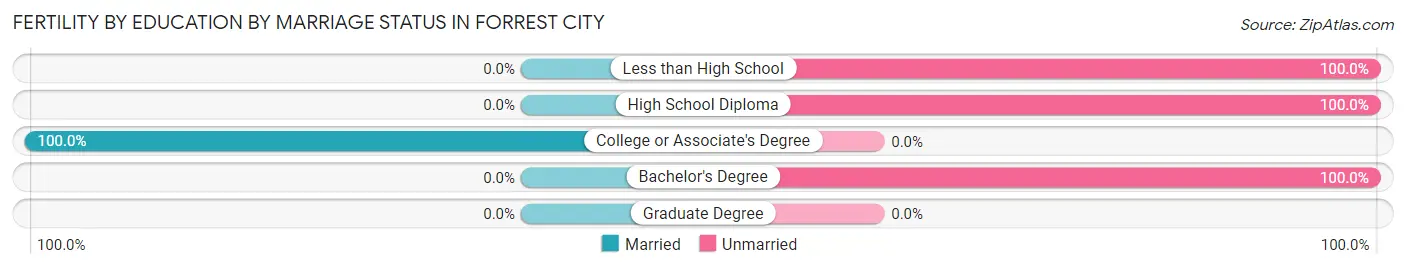
| Educational Attainment | Married | Unmarried |
| Less than High School | 0 (0.0%) | 32 (100.0%) |
| High School Diploma | 0 (0.0%) | 72 (100.0%) |
| College or Associate's Degree | 65 (100.0%) | 0 (0.0%) |
| Bachelor's Degree | 0 (0.0%) | 22 (100.0%) |
| Graduate Degree | 0 (0.0%) | 0 (0.0%) |
| Total | 65 (34.0%) | 126 (66.0%) |
Employment Characteristics in Forrest City
Employment by Class of Employer in Forrest City
Among the 3,575 employed individuals in Forrest City, private company employees (2,215 | 62.0%), local government employees (383 | 10.7%), and federal government employees (290 | 8.1%) make up the most common classes of employment.
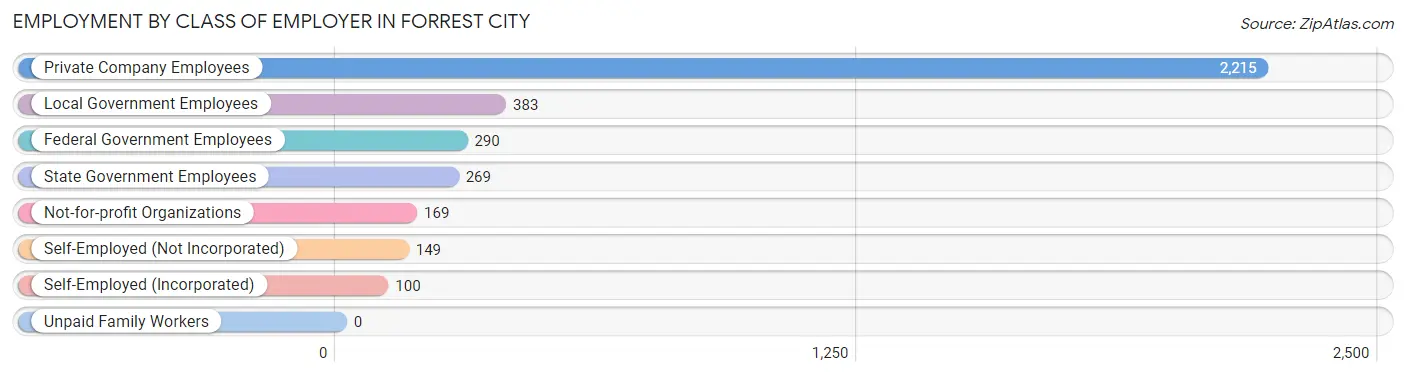
| Employer Class | # Employees | % Employees |
| Private Company Employees | 2,215 | 62.0% |
| Self-Employed (Incorporated) | 100 | 2.8% |
| Self-Employed (Not Incorporated) | 149 | 4.2% |
| Not-for-profit Organizations | 169 | 4.7% |
| Local Government Employees | 383 | 10.7% |
| State Government Employees | 269 | 7.5% |
| Federal Government Employees | 290 | 8.1% |
| Unpaid Family Workers | 0 | 0.0% |
| Total | 3,575 | 100.0% |
Employment Status by Age in Forrest City
According to the labor force statistics for Forrest City, out of the total population over 16 years of age (10,322), 39.0% or 4,026 individuals are in the labor force, with 9.3% or 374 of them unemployed. The age group with the highest labor force participation rate is 25 to 29 years, with 66.5% or 777 individuals in the labor force. Within the labor force, the 20 to 24 years age range has the highest percentage of unemployed individuals, with 35.6% or 135 of them being unemployed.
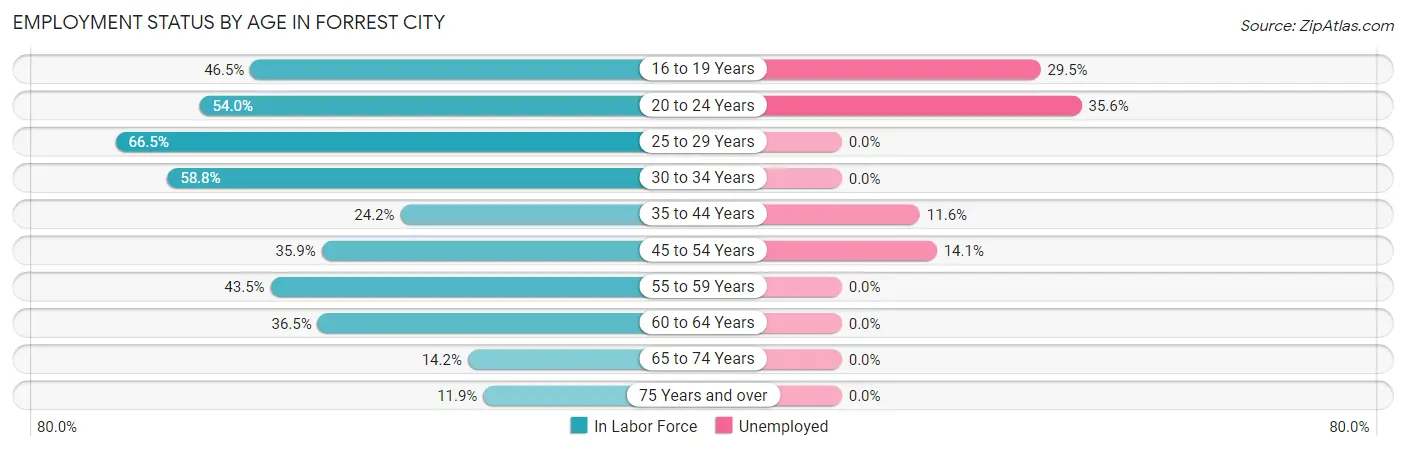
| Age Bracket | In Labor Force | Unemployed |
| 16 to 19 Years | 356 (46.5%) | 105 (29.5%) |
| 20 to 24 Years | 379 (54.0%) | 135 (35.6%) |
| 25 to 29 Years | 777 (66.5%) | 0 (0.0%) |
| 30 to 34 Years | 681 (58.8%) | 0 (0.0%) |
| 35 to 44 Years | 524 (24.2%) | 61 (11.6%) |
| 45 to 54 Years | 490 (35.9%) | 69 (14.1%) |
| 55 to 59 Years | 363 (43.5%) | 0 (0.0%) |
| 60 to 64 Years | 262 (36.5%) | 0 (0.0%) |
| 65 to 74 Years | 136 (14.2%) | 0 (0.0%) |
| 75 Years and over | 58 (11.9%) | 0 (0.0%) |
| Total | 4,026 (39.0%) | 374 (9.3%) |
Employment Status by Educational Attainment in Forrest City
According to labor force statistics for Forrest City, 41.8% of individuals (3,097) out of the total population between 25 and 64 years of age (7,409) are in the labor force, with 4.3% or 133 of them being unemployed. The group with the highest labor force participation rate are those with the educational attainment of bachelor's degree or higher, with 71.6% or 606 individuals in the labor force. Within the labor force, individuals with college / associate degree education have the highest percentage of unemployment, with 6.2% or 64 of them being unemployed.
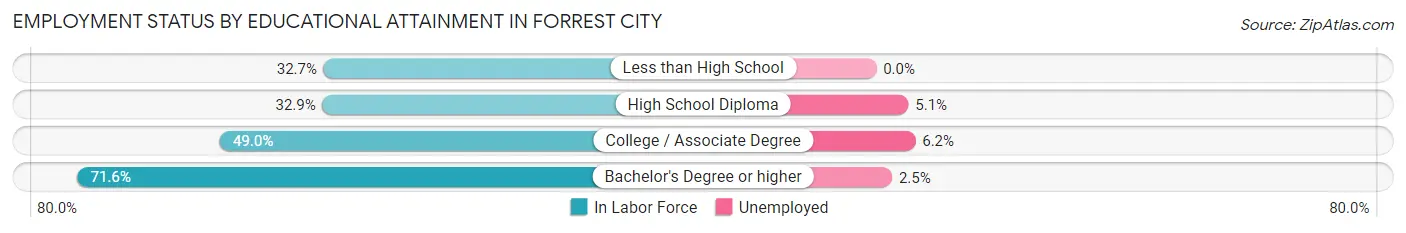
| Educational Attainment | In Labor Force | Unemployed |
| Less than High School | 420 (32.7%) | 0 (0.0%) |
| High School Diploma | 1,047 (32.9%) | 162 (5.1%) |
| College / Associate Degree | 1,027 (49.0%) | 130 (6.2%) |
| Bachelor's Degree or higher | 606 (71.6%) | 21 (2.5%) |
| Total | 3,097 (41.8%) | 319 (4.3%) |
Employment Occupations by Sex in Forrest City
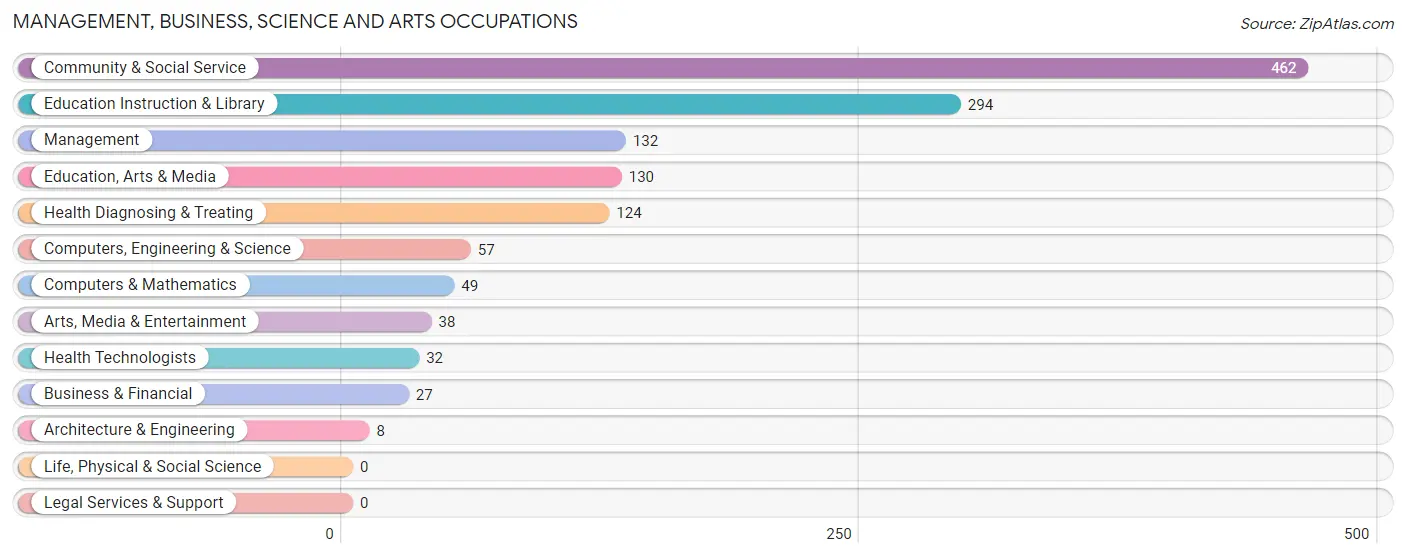
Management, Business, Science and Arts Occupations
The most common Management, Business, Science and Arts occupations in Forrest City are Community & Social Service (462 | 12.8%), Education Instruction & Library (294 | 8.1%), Management (132 | 3.6%), Education, Arts & Media (130 | 3.6%), and Health Diagnosing & Treating (124 | 3.4%).
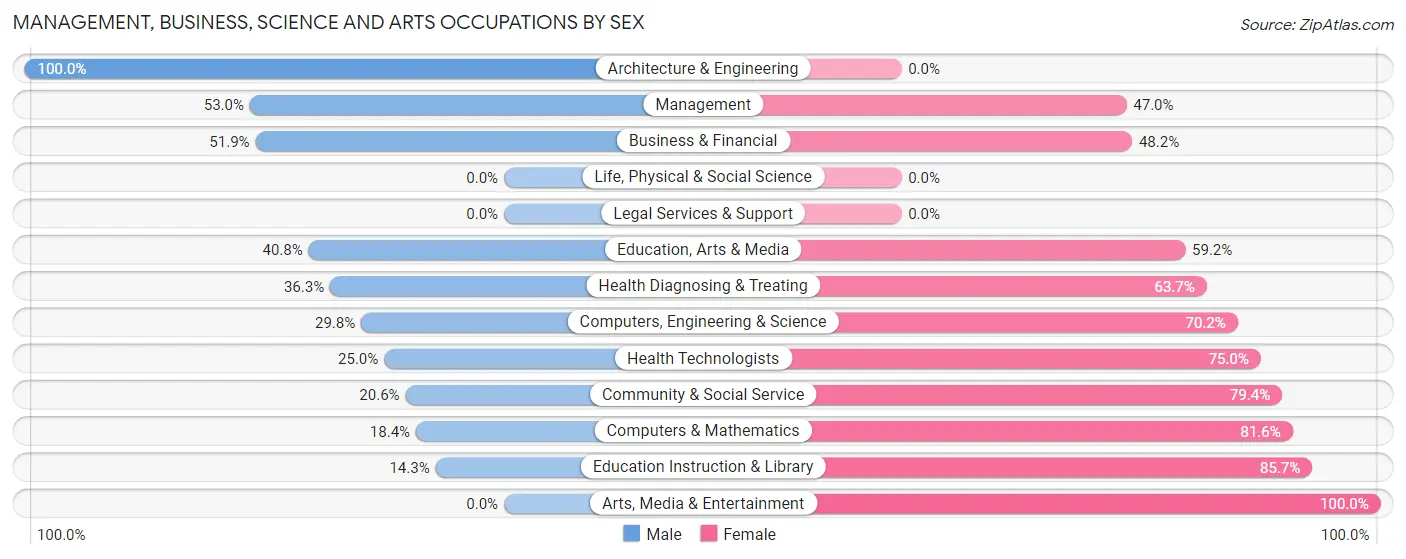
Management, Business, Science and Arts Occupations by Sex
Within the Management, Business, Science and Arts occupations in Forrest City, the most male-oriented occupations are Architecture & Engineering (100.0%), Management (53.0%), and Business & Financial (51.8%), while the most female-oriented occupations are Arts, Media & Entertainment (100.0%), Education Instruction & Library (85.7%), and Computers & Mathematics (81.6%).
| Occupation | Male | Female |
| Management | 70 (53.0%) | 62 (47.0%) |
| Business & Financial | 14 (51.8%) | 13 (48.1%) |
| Computers, Engineering & Science | 17 (29.8%) | 40 (70.2%) |
| Computers & Mathematics | 9 (18.4%) | 40 (81.6%) |
| Architecture & Engineering | 8 (100.0%) | 0 (0.0%) |
| Life, Physical & Social Science | 0 (0.0%) | 0 (0.0%) |
| Community & Social Service | 95 (20.6%) | 367 (79.4%) |
| Education, Arts & Media | 53 (40.8%) | 77 (59.2%) |
| Legal Services & Support | 0 (0.0%) | 0 (0.0%) |
| Education Instruction & Library | 42 (14.3%) | 252 (85.7%) |
| Arts, Media & Entertainment | 0 (0.0%) | 38 (100.0%) |
| Health Diagnosing & Treating | 45 (36.3%) | 79 (63.7%) |
| Health Technologists | 8 (25.0%) | 24 (75.0%) |
| Total (Category) | 241 (30.0%) | 561 (70.0%) |
| Total (Overall) | 1,782 (49.3%) | 1,835 (50.7%) |
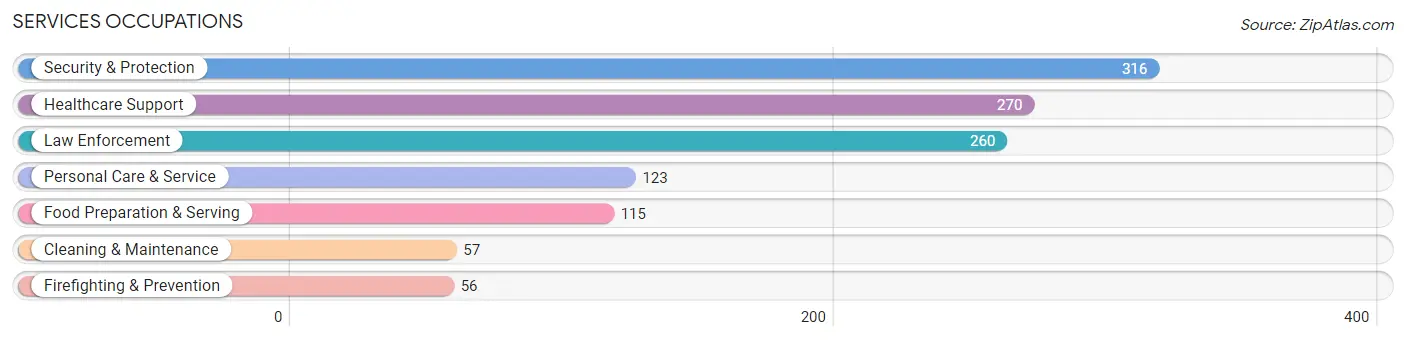
Services Occupations
The most common Services occupations in Forrest City are Security & Protection (316 | 8.7%), Healthcare Support (270 | 7.5%), Law Enforcement (260 | 7.2%), Personal Care & Service (123 | 3.4%), and Food Preparation & Serving (115 | 3.2%).
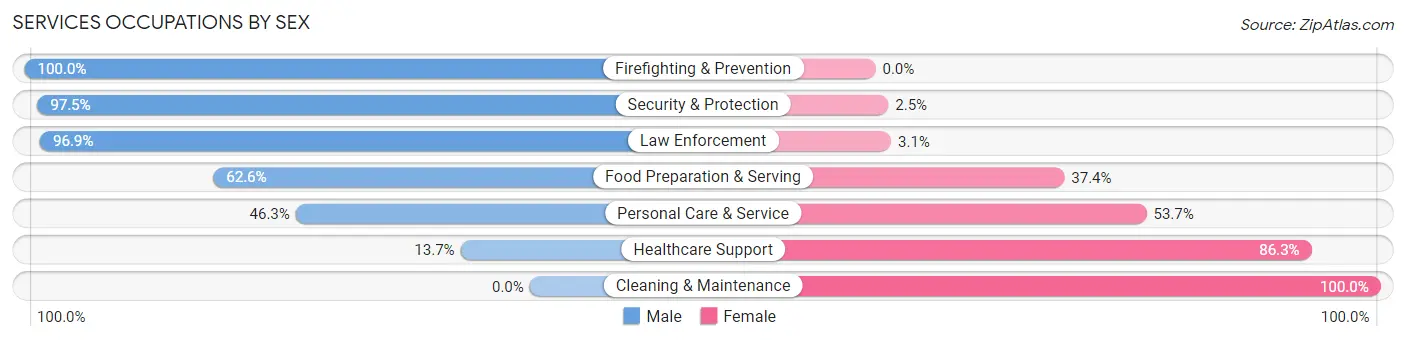
Services Occupations by Sex
Within the Services occupations in Forrest City, the most male-oriented occupations are Firefighting & Prevention (100.0%), Security & Protection (97.5%), and Law Enforcement (96.9%), while the most female-oriented occupations are Cleaning & Maintenance (100.0%), Healthcare Support (86.3%), and Personal Care & Service (53.7%).
| Occupation | Male | Female |
| Healthcare Support | 37 (13.7%) | 233 (86.3%) |
| Security & Protection | 308 (97.5%) | 8 (2.5%) |
| Firefighting & Prevention | 56 (100.0%) | 0 (0.0%) |
| Law Enforcement | 252 (96.9%) | 8 (3.1%) |
| Food Preparation & Serving | 72 (62.6%) | 43 (37.4%) |
| Cleaning & Maintenance | 0 (0.0%) | 57 (100.0%) |
| Personal Care & Service | 57 (46.3%) | 66 (53.7%) |
| Total (Category) | 474 (53.8%) | 407 (46.2%) |
| Total (Overall) | 1,782 (49.3%) | 1,835 (50.7%) |
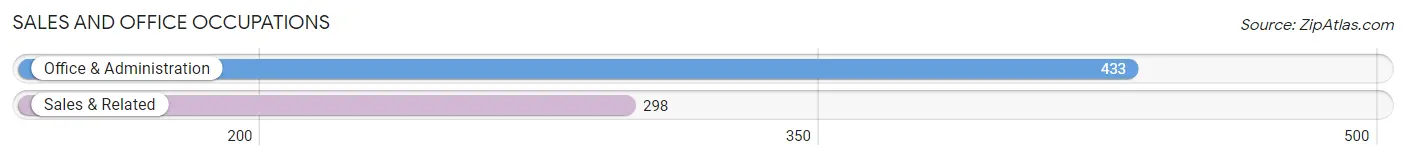
Sales and Office Occupations
The most common Sales and Office occupations in Forrest City are Office & Administration (433 | 12.0%), and Sales & Related (298 | 8.2%).
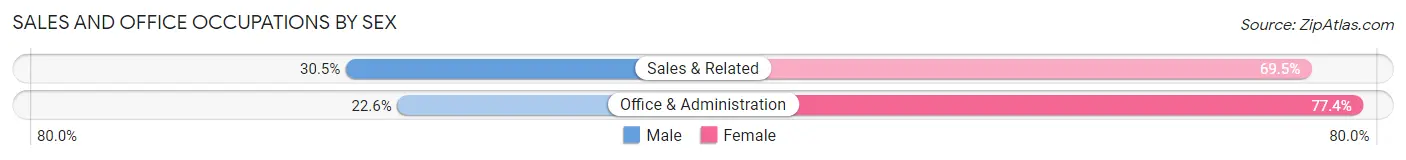
Sales and Office Occupations by Sex
| Occupation | Male | Female |
| Sales & Related | 91 (30.5%) | 207 (69.5%) |
| Office & Administration | 98 (22.6%) | 335 (77.4%) |
| Total (Category) | 189 (25.9%) | 542 (74.2%) |
| Total (Overall) | 1,782 (49.3%) | 1,835 (50.7%) |
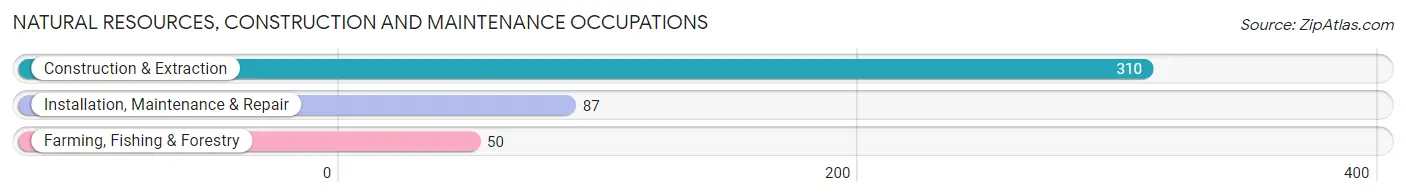
Natural Resources, Construction and Maintenance Occupations
The most common Natural Resources, Construction and Maintenance occupations in Forrest City are Construction & Extraction (310 | 8.6%), Installation, Maintenance & Repair (87 | 2.4%), and Farming, Fishing & Forestry (50 | 1.4%).
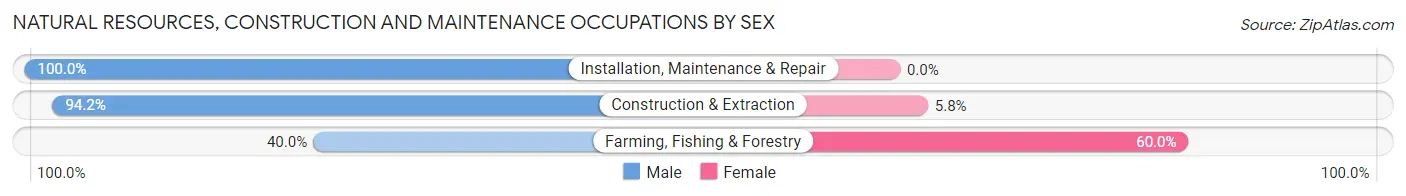
Natural Resources, Construction and Maintenance Occupations by Sex
| Occupation | Male | Female |
| Farming, Fishing & Forestry | 20 (40.0%) | 30 (60.0%) |
| Construction & Extraction | 292 (94.2%) | 18 (5.8%) |
| Installation, Maintenance & Repair | 87 (100.0%) | 0 (0.0%) |
| Total (Category) | 399 (89.3%) | 48 (10.7%) |
| Total (Overall) | 1,782 (49.3%) | 1,835 (50.7%) |
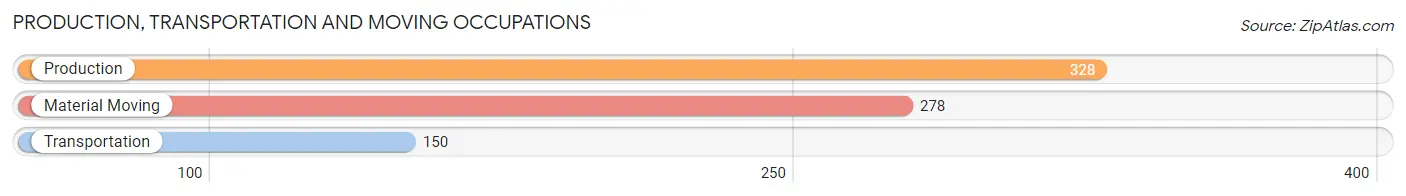
Production, Transportation and Moving Occupations
The most common Production, Transportation and Moving occupations in Forrest City are Production (328 | 9.1%), Material Moving (278 | 7.7%), and Transportation (150 | 4.2%).
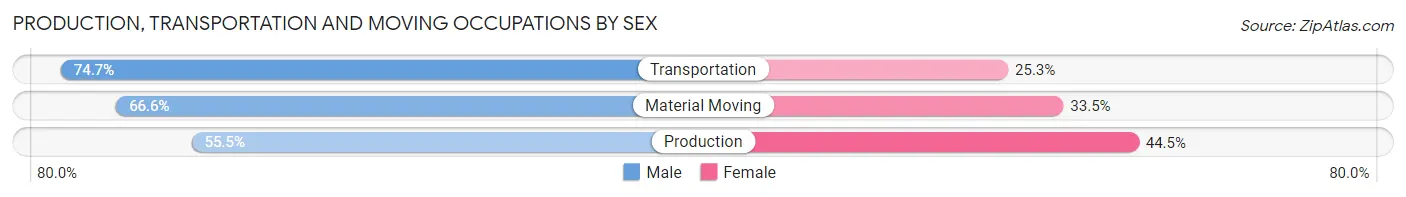
Production, Transportation and Moving Occupations by Sex
| Occupation | Male | Female |
| Production | 182 (55.5%) | 146 (44.5%) |
| Transportation | 112 (74.7%) | 38 (25.3%) |
| Material Moving | 185 (66.5%) | 93 (33.5%) |
| Total (Category) | 479 (63.4%) | 277 (36.6%) |
| Total (Overall) | 1,782 (49.3%) | 1,835 (50.7%) |
Employment Industries by Sex in Forrest City
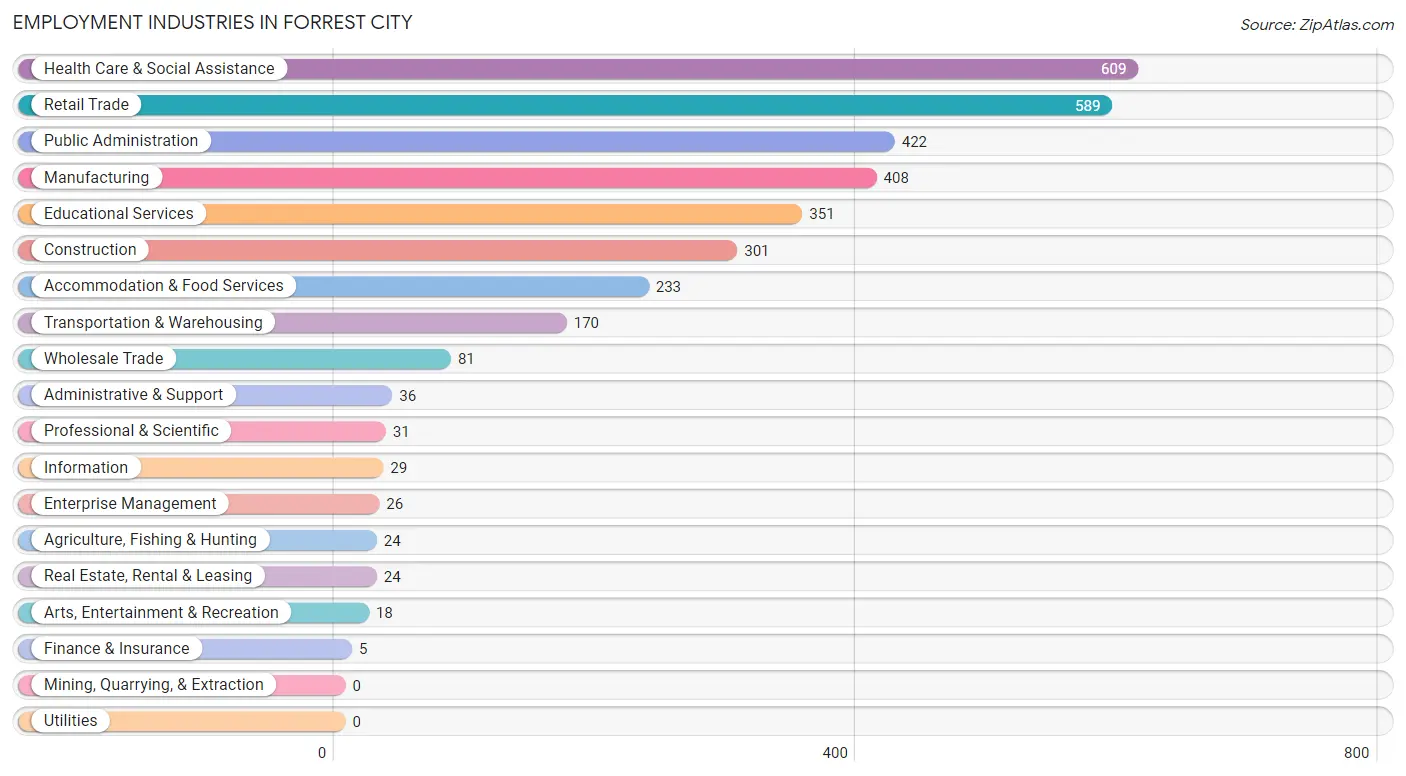
Employment Industries in Forrest City
The major employment industries in Forrest City include Health Care & Social Assistance (609 | 16.8%), Retail Trade (589 | 16.3%), Public Administration (422 | 11.7%), Manufacturing (408 | 11.3%), and Educational Services (351 | 9.7%).
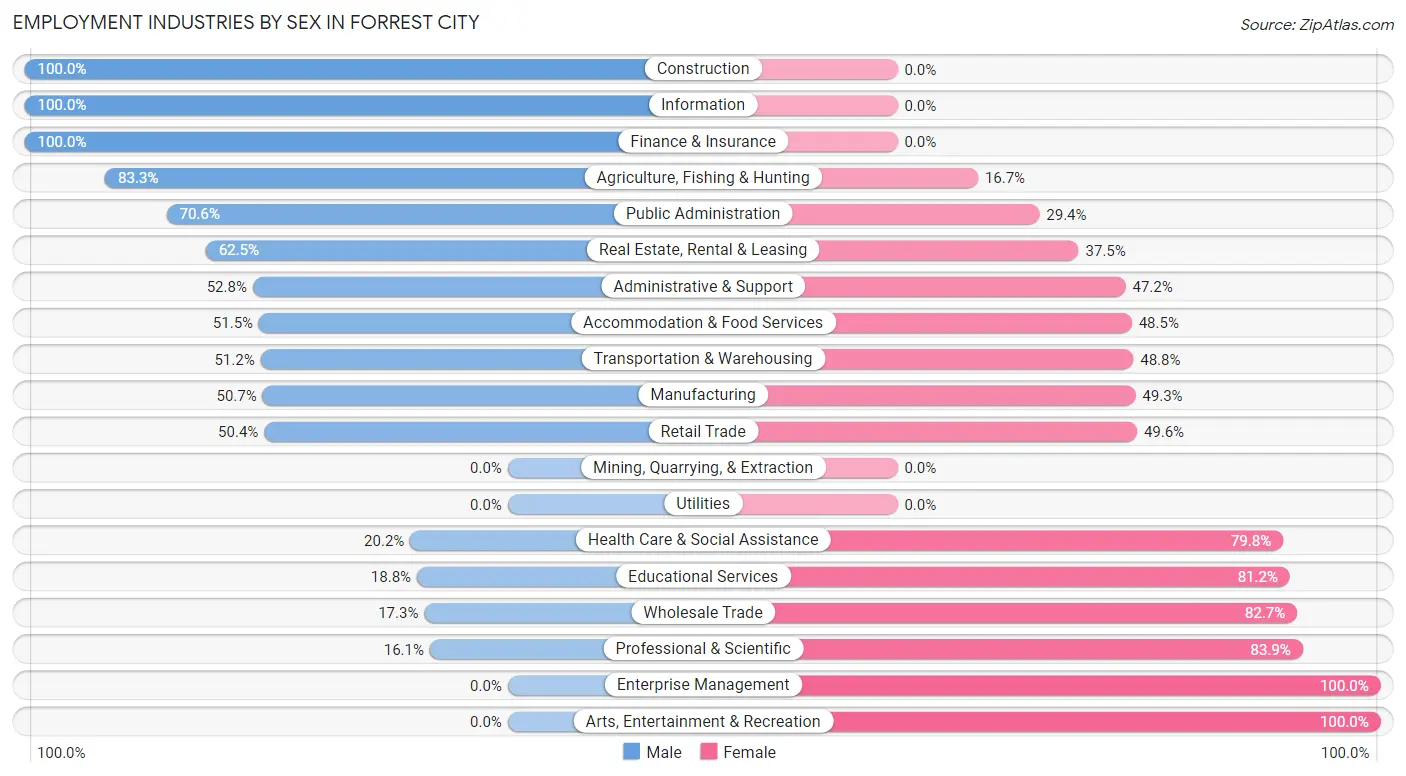
Employment Industries by Sex in Forrest City
The Forrest City industries that see more men than women are Construction (100.0%), Information (100.0%), and Finance & Insurance (100.0%), whereas the industries that tend to have a higher number of women are Enterprise Management (100.0%), Arts, Entertainment & Recreation (100.0%), and Professional & Scientific (83.9%).
| Industry | Male | Female |
| Agriculture, Fishing & Hunting | 20 (83.3%) | 4 (16.7%) |
| Mining, Quarrying, & Extraction | 0 (0.0%) | 0 (0.0%) |
| Construction | 301 (100.0%) | 0 (0.0%) |
| Manufacturing | 207 (50.7%) | 201 (49.3%) |
| Wholesale Trade | 14 (17.3%) | 67 (82.7%) |
| Retail Trade | 297 (50.4%) | 292 (49.6%) |
| Transportation & Warehousing | 87 (51.2%) | 83 (48.8%) |
| Utilities | 0 (0.0%) | 0 (0.0%) |
| Information | 29 (100.0%) | 0 (0.0%) |
| Finance & Insurance | 5 (100.0%) | 0 (0.0%) |
| Real Estate, Rental & Leasing | 15 (62.5%) | 9 (37.5%) |
| Professional & Scientific | 5 (16.1%) | 26 (83.9%) |
| Enterprise Management | 0 (0.0%) | 26 (100.0%) |
| Administrative & Support | 19 (52.8%) | 17 (47.2%) |
| Educational Services | 66 (18.8%) | 285 (81.2%) |
| Health Care & Social Assistance | 123 (20.2%) | 486 (79.8%) |
| Arts, Entertainment & Recreation | 0 (0.0%) | 18 (100.0%) |
| Accommodation & Food Services | 120 (51.5%) | 113 (48.5%) |
| Public Administration | 298 (70.6%) | 124 (29.4%) |
| Total | 1,782 (49.3%) | 1,835 (50.7%) |
Education in Forrest City
School Enrollment in Forrest City
The most common levels of schooling among the 2,869 students in Forrest City are high school (776 | 27.1%), elementary school (744 | 25.9%), and middle school (594 | 20.7%).
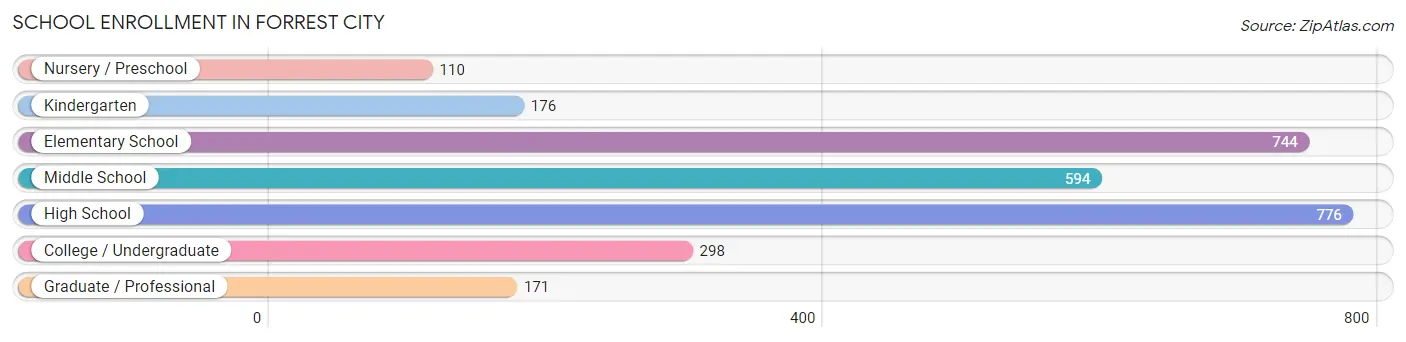
| School Level | # Students | % Students |
| Nursery / Preschool | 110 | 3.8% |
| Kindergarten | 176 | 6.1% |
| Elementary School | 744 | 25.9% |
| Middle School | 594 | 20.7% |
| High School | 776 | 27.1% |
| College / Undergraduate | 298 | 10.4% |
| Graduate / Professional | 171 | 6.0% |
| Total | 2,869 | 100.0% |
School Enrollment by Age by Funding Source in Forrest City
Out of a total of 2,869 students who are enrolled in schools in Forrest City, 252 (8.8%) attend a private institution, while the remaining 2,617 (91.2%) are enrolled in public schools. The age group of 3 to 4 year olds has the highest likelihood of being enrolled in private schools, with 51 (72.9% in the age bracket) enrolled. Conversely, the age group of 18 to 19 year olds has the lowest likelihood of being enrolled in a private school, with 222 (100.0% in the age bracket) attending a public institution.
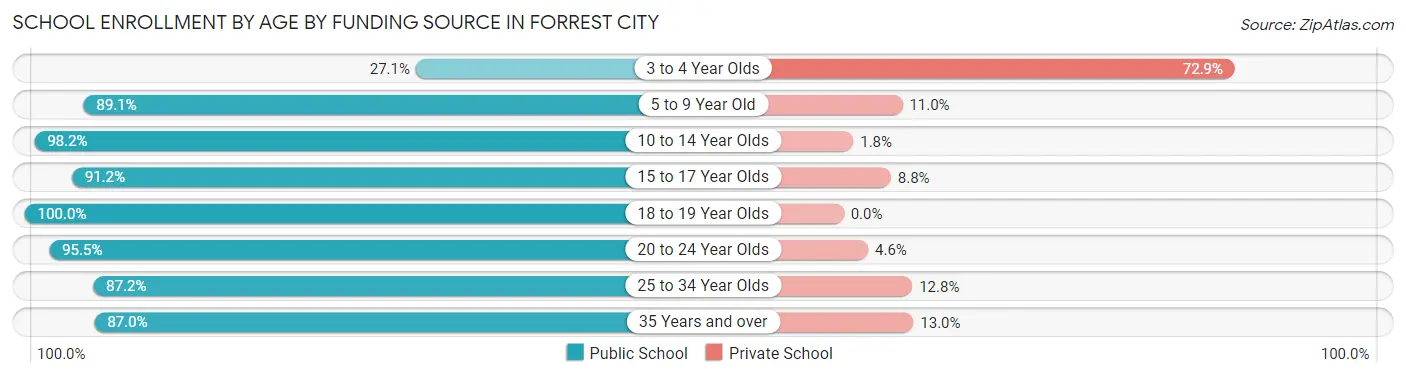
| Age Bracket | Public School | Private School |
| 3 to 4 Year Olds | 19 (27.1%) | 51 (72.9%) |
| 5 to 9 Year Old | 805 (89.0%) | 99 (11.0%) |
| 10 to 14 Year Olds | 715 (98.2%) | 13 (1.8%) |
| 15 to 17 Year Olds | 363 (91.2%) | 35 (8.8%) |
| 18 to 19 Year Olds | 222 (100.0%) | 0 (0.0%) |
| 20 to 24 Year Olds | 189 (95.5%) | 9 (4.5%) |
| 25 to 34 Year Olds | 123 (87.2%) | 18 (12.8%) |
| 35 Years and over | 181 (87.0%) | 27 (13.0%) |
| Total | 2,617 (91.2%) | 252 (8.8%) |
Educational Attainment by Field of Study in Forrest City
Education (255 | 20.6%), social sciences (205 | 16.6%), arts & humanities (178 | 14.4%), business (135 | 10.9%), and psychology (129 | 10.4%) are the most common fields of study among 1,235 individuals in Forrest City who have obtained a bachelor's degree or higher.
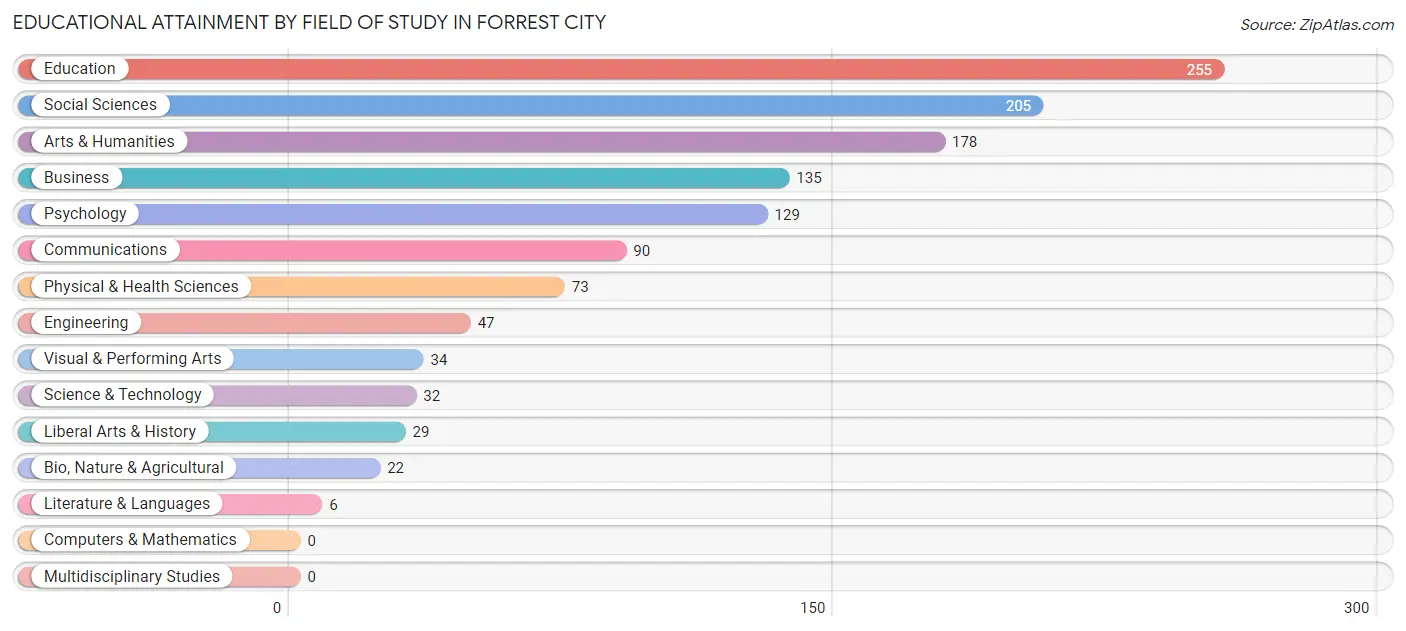
| Field of Study | # Graduates | % Graduates |
| Computers & Mathematics | 0 | 0.0% |
| Bio, Nature & Agricultural | 22 | 1.8% |
| Physical & Health Sciences | 73 | 5.9% |
| Psychology | 129 | 10.4% |
| Social Sciences | 205 | 16.6% |
| Engineering | 47 | 3.8% |
| Multidisciplinary Studies | 0 | 0.0% |
| Science & Technology | 32 | 2.6% |
| Business | 135 | 10.9% |
| Education | 255 | 20.6% |
| Literature & Languages | 6 | 0.5% |
| Liberal Arts & History | 29 | 2.4% |
| Visual & Performing Arts | 34 | 2.8% |
| Communications | 90 | 7.3% |
| Arts & Humanities | 178 | 14.4% |
| Total | 1,235 | 100.0% |
Transportation & Commute in Forrest City
Vehicle Availability by Sex in Forrest City
The most prevalent vehicle ownership categories in Forrest City are males with 2 vehicles (670, accounting for 37.1%) and females with 2 vehicles (487, making up 37.9%).
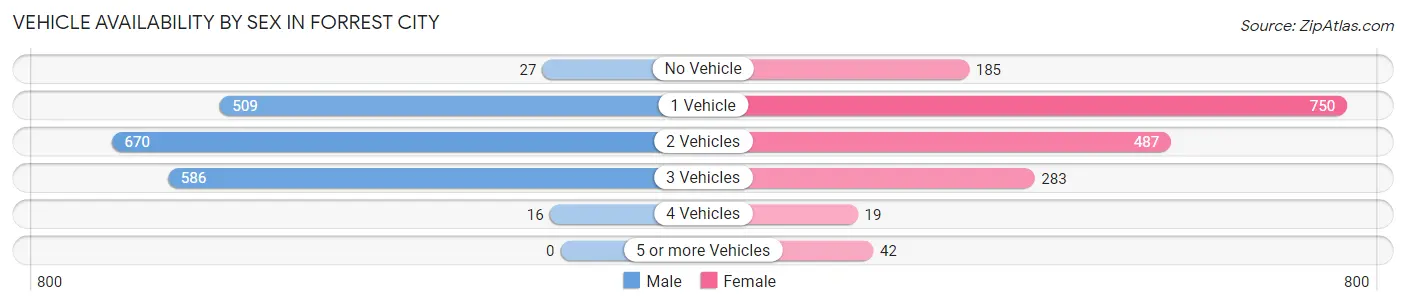
| Vehicles Available | Male | Female |
| No Vehicle | 27 (1.5%) | 185 (10.5%) |
| 1 Vehicle | 509 (28.1%) | 750 (42.5%) |
| 2 Vehicles | 670 (37.1%) | 487 (27.6%) |
| 3 Vehicles | 586 (32.4%) | 283 (16.0%) |
| 4 Vehicles | 16 (0.9%) | 19 (1.1%) |
| 5 or more Vehicles | 0 (0.0%) | 42 (2.4%) |
| Total | 1,808 (100.0%) | 1,766 (100.0%) |
Commute Time in Forrest City
The most frequently occuring commute durations in Forrest City are 5 to 9 minutes (963 commuters, 27.6%), 10 to 14 minutes (914 commuters, 26.2%), and 15 to 19 minutes (441 commuters, 12.7%).
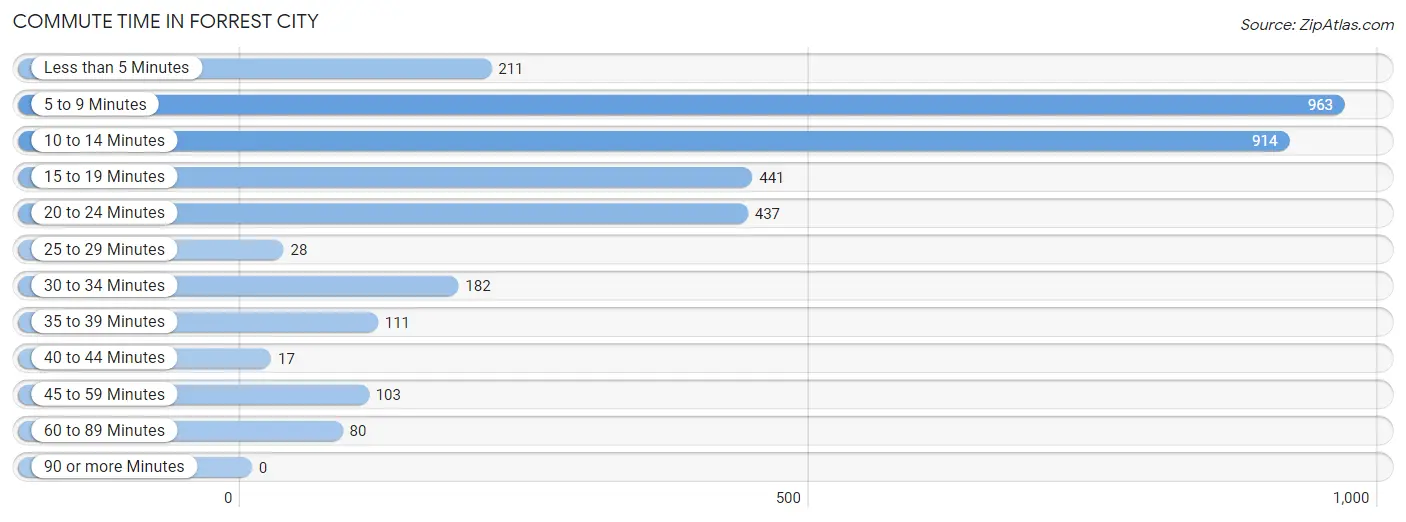
| Commute Time | # Commuters | % Commuters |
| Less than 5 Minutes | 211 | 6.0% |
| 5 to 9 Minutes | 963 | 27.6% |
| 10 to 14 Minutes | 914 | 26.2% |
| 15 to 19 Minutes | 441 | 12.7% |
| 20 to 24 Minutes | 437 | 12.5% |
| 25 to 29 Minutes | 28 | 0.8% |
| 30 to 34 Minutes | 182 | 5.2% |
| 35 to 39 Minutes | 111 | 3.2% |
| 40 to 44 Minutes | 17 | 0.5% |
| 45 to 59 Minutes | 103 | 2.9% |
| 60 to 89 Minutes | 80 | 2.3% |
| 90 or more Minutes | 0 | 0.0% |
Commute Time by Sex in Forrest City
The most common commute times in Forrest City are 5 to 9 minutes (535 commuters, 30.1%) for males and 10 to 14 minutes (495 commuters, 28.9%) for females.
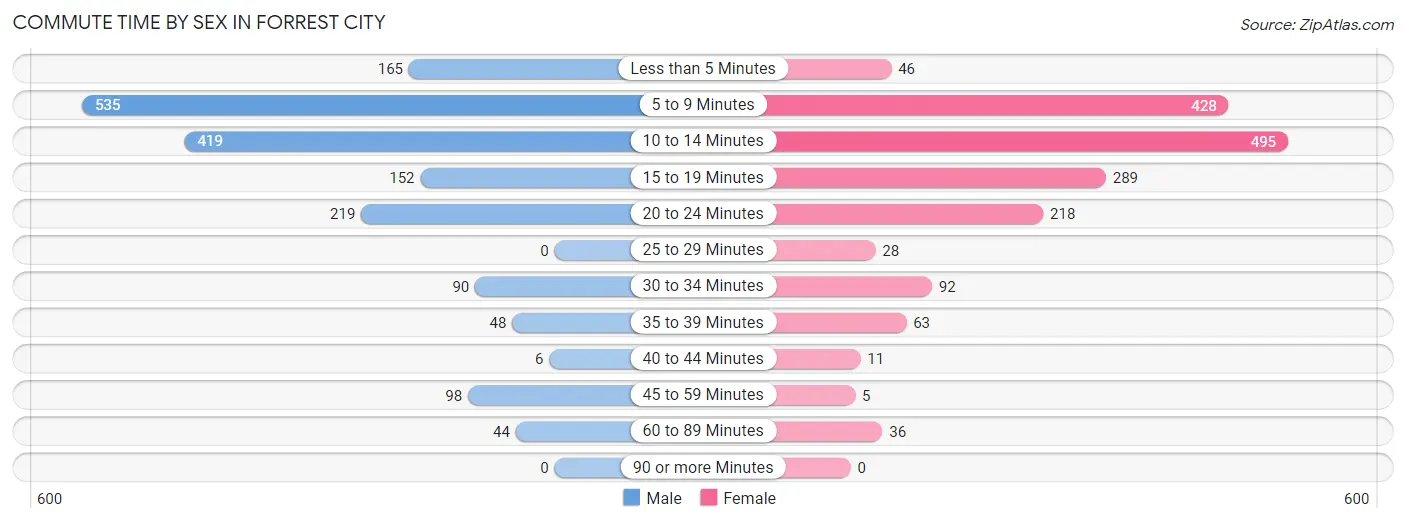
| Commute Time | Male | Female |
| Less than 5 Minutes | 165 (9.3%) | 46 (2.7%) |
| 5 to 9 Minutes | 535 (30.1%) | 428 (25.0%) |
| 10 to 14 Minutes | 419 (23.6%) | 495 (28.9%) |
| 15 to 19 Minutes | 152 (8.6%) | 289 (16.9%) |
| 20 to 24 Minutes | 219 (12.3%) | 218 (12.7%) |
| 25 to 29 Minutes | 0 (0.0%) | 28 (1.6%) |
| 30 to 34 Minutes | 90 (5.1%) | 92 (5.4%) |
| 35 to 39 Minutes | 48 (2.7%) | 63 (3.7%) |
| 40 to 44 Minutes | 6 (0.3%) | 11 (0.6%) |
| 45 to 59 Minutes | 98 (5.5%) | 5 (0.3%) |
| 60 to 89 Minutes | 44 (2.5%) | 36 (2.1%) |
| 90 or more Minutes | 0 (0.0%) | 0 (0.0%) |
Time of Departure to Work by Sex in Forrest City
The most frequent times of departure to work in Forrest City are 12:00 PM to 3:59 PM (342, 19.3%) for males and 7:30 AM to 7:59 AM (350, 20.5%) for females.
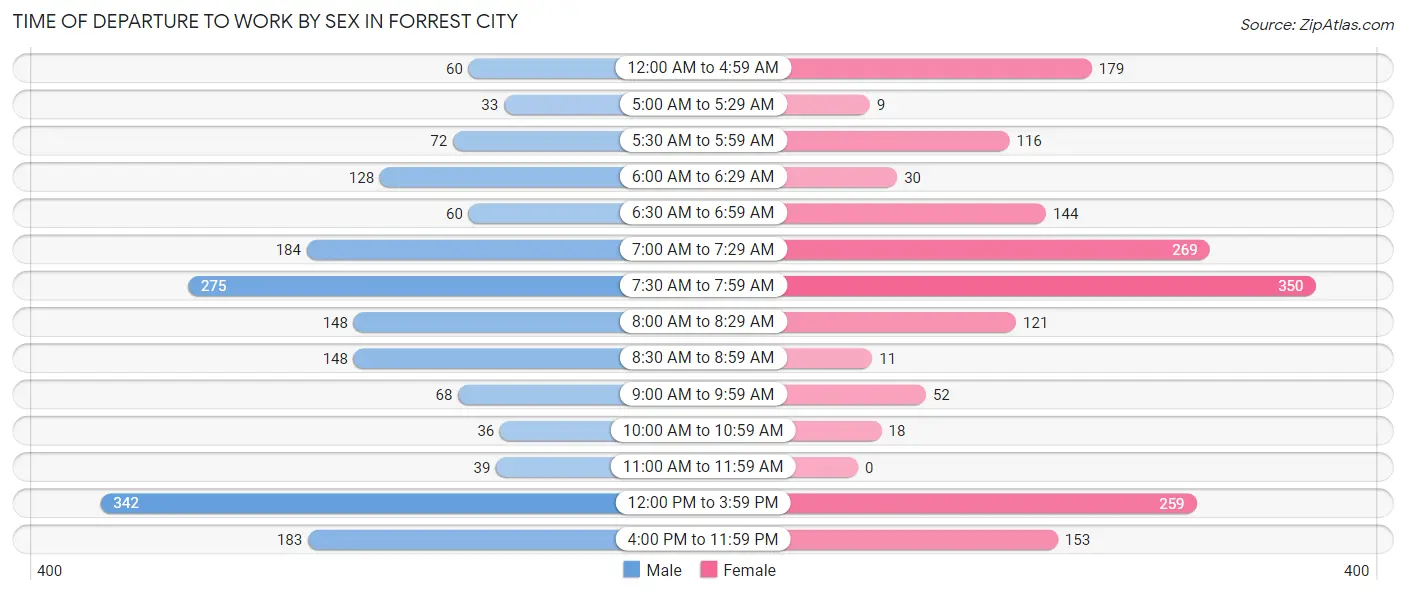
| Time of Departure | Male | Female |
| 12:00 AM to 4:59 AM | 60 (3.4%) | 179 (10.5%) |
| 5:00 AM to 5:29 AM | 33 (1.9%) | 9 (0.5%) |
| 5:30 AM to 5:59 AM | 72 (4.1%) | 116 (6.8%) |
| 6:00 AM to 6:29 AM | 128 (7.2%) | 30 (1.8%) |
| 6:30 AM to 6:59 AM | 60 (3.4%) | 144 (8.4%) |
| 7:00 AM to 7:29 AM | 184 (10.4%) | 269 (15.7%) |
| 7:30 AM to 7:59 AM | 275 (15.5%) | 350 (20.5%) |
| 8:00 AM to 8:29 AM | 148 (8.3%) | 121 (7.1%) |
| 8:30 AM to 8:59 AM | 148 (8.3%) | 11 (0.6%) |
| 9:00 AM to 9:59 AM | 68 (3.8%) | 52 (3.0%) |
| 10:00 AM to 10:59 AM | 36 (2.0%) | 18 (1.1%) |
| 11:00 AM to 11:59 AM | 39 (2.2%) | 0 (0.0%) |
| 12:00 PM to 3:59 PM | 342 (19.3%) | 259 (15.1%) |
| 4:00 PM to 11:59 PM | 183 (10.3%) | 153 (8.9%) |
| Total | 1,776 (100.0%) | 1,711 (100.0%) |
Housing Occupancy in Forrest City
Occupancy by Ownership in Forrest City
Of the total 3,976 dwellings in Forrest City, owner-occupied units account for 1,425 (35.8%), while renter-occupied units make up 2,551 (64.2%).
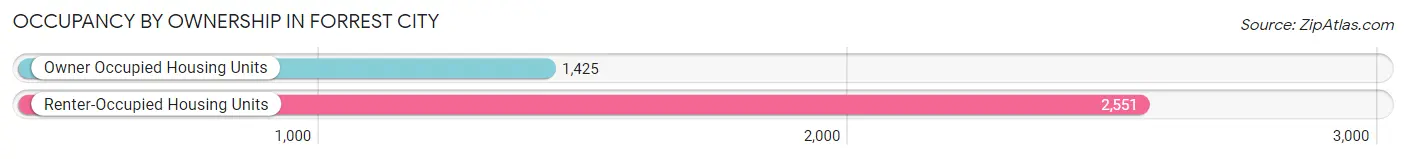
| Occupancy | # Housing Units | % Housing Units |
| Owner Occupied Housing Units | 1,425 | 35.8% |
| Renter-Occupied Housing Units | 2,551 | 64.2% |
| Total Occupied Housing Units | 3,976 | 100.0% |
Occupancy by Household Size in Forrest City
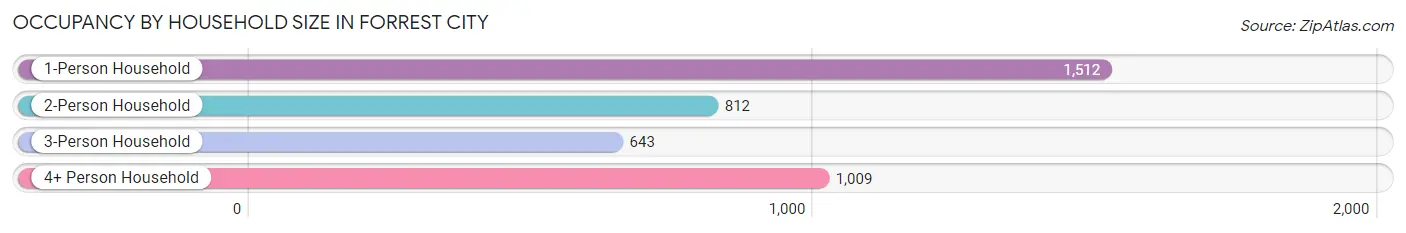
| Household Size | # Housing Units | % Housing Units |
| 1-Person Household | 1,512 | 38.0% |
| 2-Person Household | 812 | 20.4% |
| 3-Person Household | 643 | 16.2% |
| 4+ Person Household | 1,009 | 25.4% |
| Total Housing Units | 3,976 | 100.0% |
Occupancy by Ownership by Household Size in Forrest City
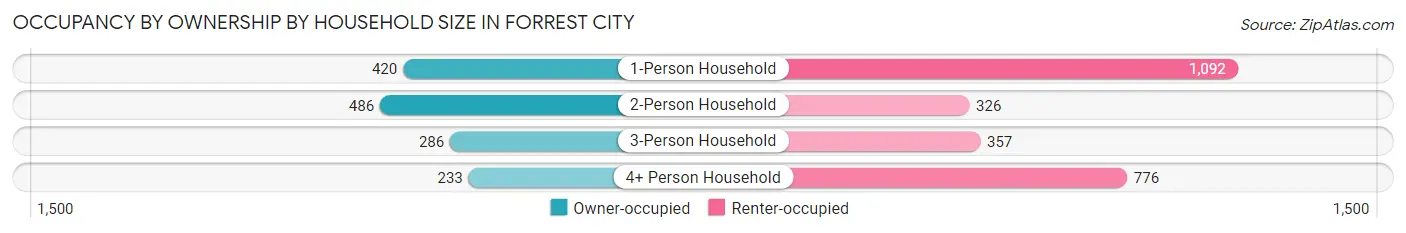
| Household Size | Owner-occupied | Renter-occupied |
| 1-Person Household | 420 (27.8%) | 1,092 (72.2%) |
| 2-Person Household | 486 (59.9%) | 326 (40.2%) |
| 3-Person Household | 286 (44.5%) | 357 (55.5%) |
| 4+ Person Household | 233 (23.1%) | 776 (76.9%) |
| Total Housing Units | 1,425 (35.8%) | 2,551 (64.2%) |
Occupancy by Educational Attainment in Forrest City
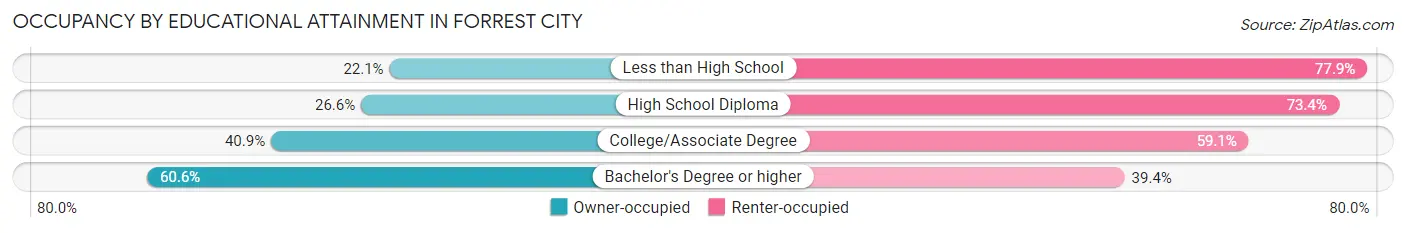
| Household Size | Owner-occupied | Renter-occupied |
| Less than High School | 179 (22.1%) | 630 (77.9%) |
| High School Diploma | 341 (26.6%) | 939 (73.4%) |
| College/Associate Degree | 496 (40.9%) | 716 (59.1%) |
| Bachelor's Degree or higher | 409 (60.6%) | 266 (39.4%) |
Occupancy by Age of Householder in Forrest City
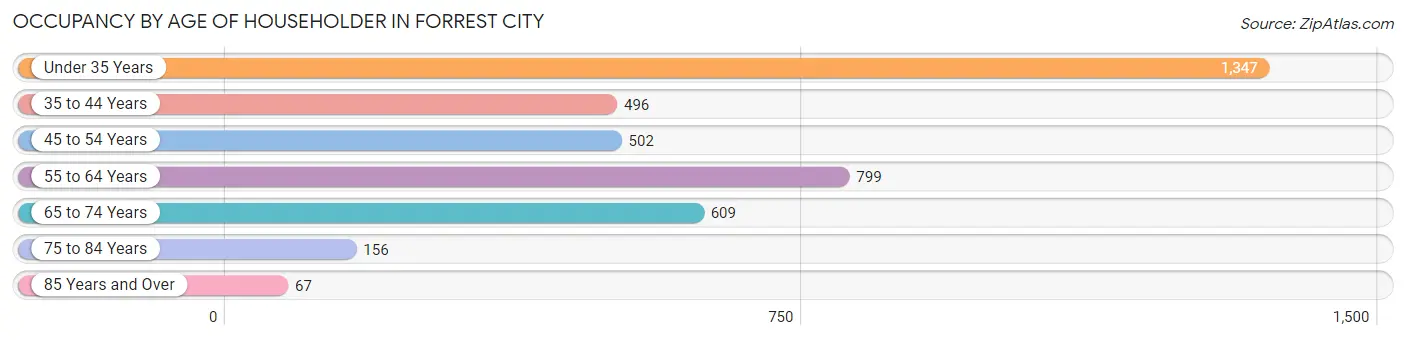
| Age Bracket | # Households | % Households |
| Under 35 Years | 1,347 | 33.9% |
| 35 to 44 Years | 496 | 12.5% |
| 45 to 54 Years | 502 | 12.6% |
| 55 to 64 Years | 799 | 20.1% |
| 65 to 74 Years | 609 | 15.3% |
| 75 to 84 Years | 156 | 3.9% |
| 85 Years and Over | 67 | 1.7% |
| Total | 3,976 | 100.0% |
Housing Finances in Forrest City
Median Income by Occupancy in Forrest City
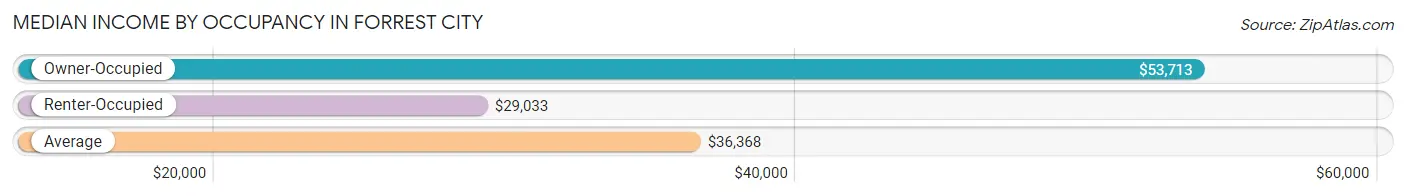
| Occupancy Type | # Households | Median Income |
| Owner-Occupied | 1,425 (35.8%) | $53,713 |
| Renter-Occupied | 2,551 (64.2%) | $29,033 |
| Average | 3,976 (100.0%) | $36,368 |
Occupancy by Householder Income Bracket in Forrest City
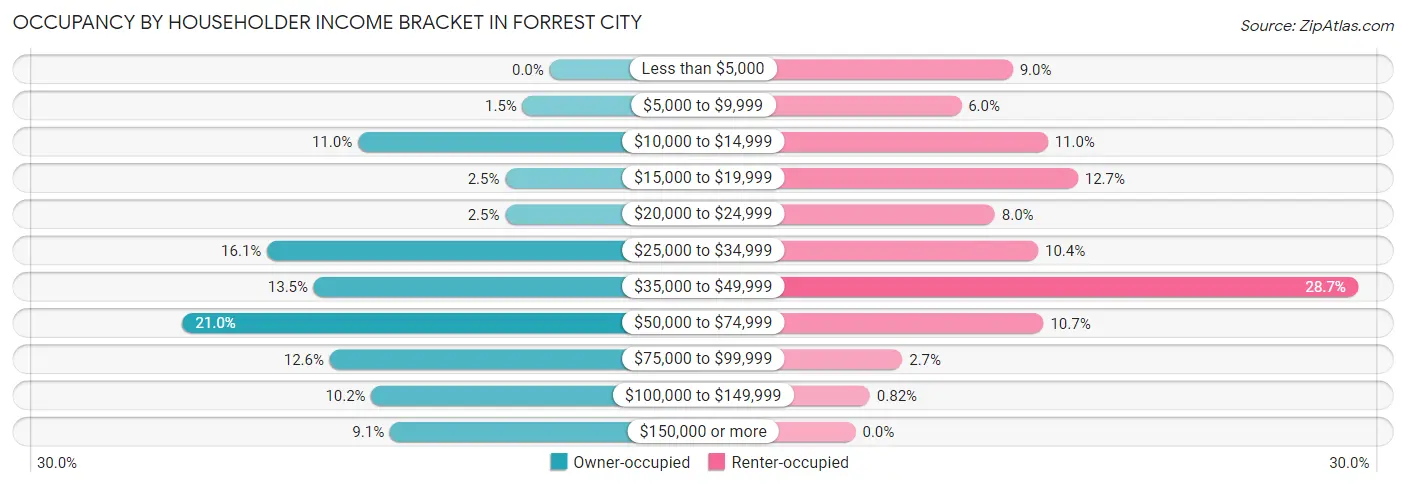
| Income Bracket | Owner-occupied | Renter-occupied |
| Less than $5,000 | 0 (0.0%) | 229 (9.0%) |
| $5,000 to $9,999 | 22 (1.5%) | 154 (6.0%) |
| $10,000 to $14,999 | 156 (11.0%) | 280 (11.0%) |
| $15,000 to $19,999 | 36 (2.5%) | 324 (12.7%) |
| $20,000 to $24,999 | 36 (2.5%) | 203 (8.0%) |
| $25,000 to $34,999 | 230 (16.1%) | 266 (10.4%) |
| $35,000 to $49,999 | 192 (13.5%) | 732 (28.7%) |
| $50,000 to $74,999 | 299 (21.0%) | 274 (10.7%) |
| $75,000 to $99,999 | 179 (12.6%) | 68 (2.7%) |
| $100,000 to $149,999 | 145 (10.2%) | 21 (0.8%) |
| $150,000 or more | 130 (9.1%) | 0 (0.0%) |
| Total | 1,425 (100.0%) | 2,551 (100.0%) |
Monthly Housing Cost Tiers in Forrest City
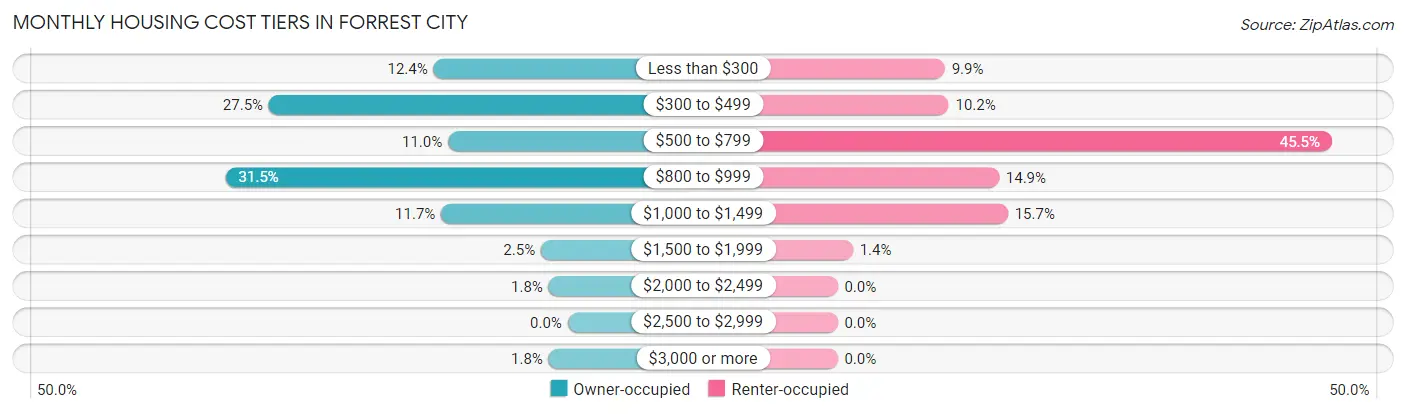
| Monthly Cost | Owner-occupied | Renter-occupied |
| Less than $300 | 176 (12.3%) | 252 (9.9%) |
| $300 to $499 | 392 (27.5%) | 261 (10.2%) |
| $500 to $799 | 157 (11.0%) | 1,161 (45.5%) |
| $800 to $999 | 449 (31.5%) | 379 (14.9%) |
| $1,000 to $1,499 | 166 (11.7%) | 400 (15.7%) |
| $1,500 to $1,999 | 35 (2.5%) | 36 (1.4%) |
| $2,000 to $2,499 | 25 (1.8%) | 0 (0.0%) |
| $2,500 to $2,999 | 0 (0.0%) | 0 (0.0%) |
| $3,000 or more | 25 (1.8%) | 0 (0.0%) |
| Total | 1,425 (100.0%) | 2,551 (100.0%) |
Physical Housing Characteristics in Forrest City
Housing Structures in Forrest City
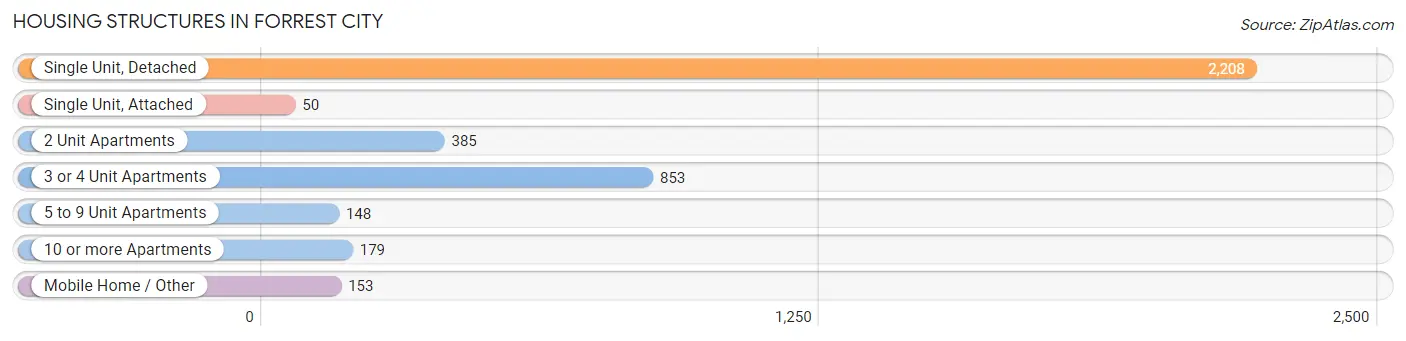
| Structure Type | # Housing Units | % Housing Units |
| Single Unit, Detached | 2,208 | 55.5% |
| Single Unit, Attached | 50 | 1.3% |
| 2 Unit Apartments | 385 | 9.7% |
| 3 or 4 Unit Apartments | 853 | 21.4% |
| 5 to 9 Unit Apartments | 148 | 3.7% |
| 10 or more Apartments | 179 | 4.5% |
| Mobile Home / Other | 153 | 3.8% |
| Total | 3,976 | 100.0% |
Housing Structures by Occupancy in Forrest City
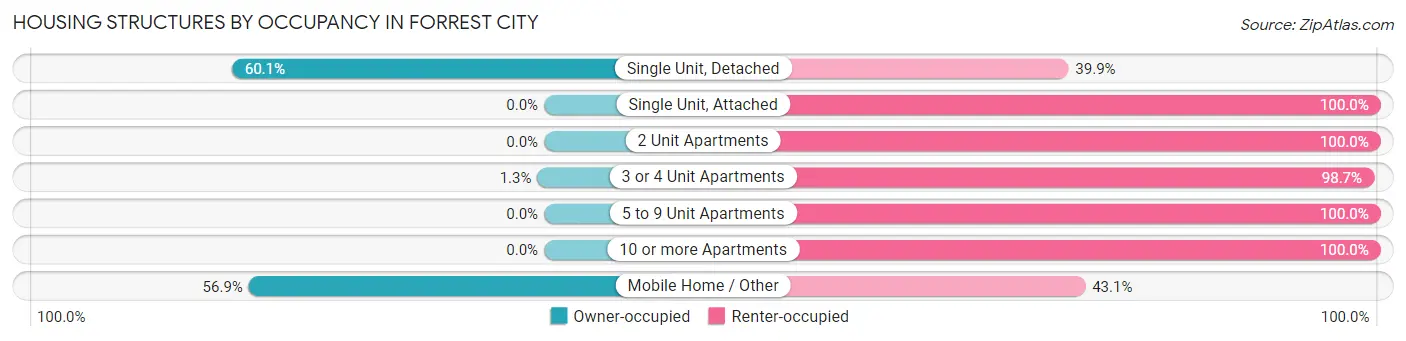
| Structure Type | Owner-occupied | Renter-occupied |
| Single Unit, Detached | 1,327 (60.1%) | 881 (39.9%) |
| Single Unit, Attached | 0 (0.0%) | 50 (100.0%) |
| 2 Unit Apartments | 0 (0.0%) | 385 (100.0%) |
| 3 or 4 Unit Apartments | 11 (1.3%) | 842 (98.7%) |
| 5 to 9 Unit Apartments | 0 (0.0%) | 148 (100.0%) |
| 10 or more Apartments | 0 (0.0%) | 179 (100.0%) |
| Mobile Home / Other | 87 (56.9%) | 66 (43.1%) |
| Total | 1,425 (35.8%) | 2,551 (64.2%) |
Housing Structures by Number of Rooms in Forrest City
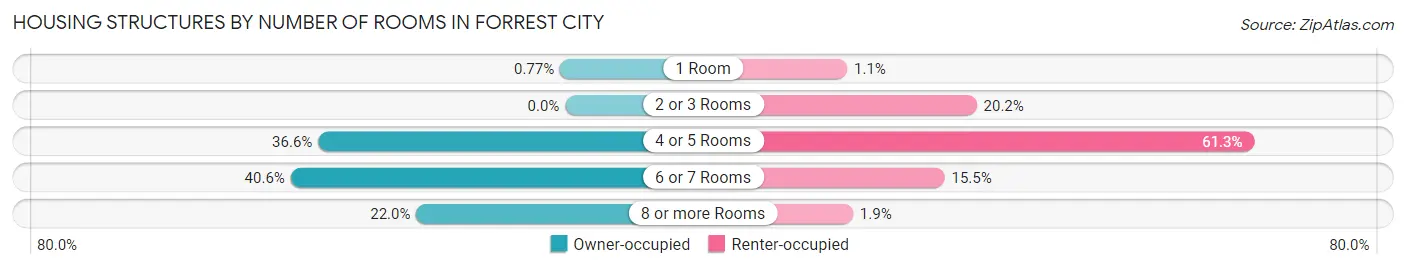
| Number of Rooms | Owner-occupied | Renter-occupied |
| 1 Room | 11 (0.8%) | 27 (1.1%) |
| 2 or 3 Rooms | 0 (0.0%) | 516 (20.2%) |
| 4 or 5 Rooms | 521 (36.6%) | 1,564 (61.3%) |
| 6 or 7 Rooms | 579 (40.6%) | 395 (15.5%) |
| 8 or more Rooms | 314 (22.0%) | 49 (1.9%) |
| Total | 1,425 (100.0%) | 2,551 (100.0%) |
Housing Structure by Heating Type in Forrest City

| Heating Type | Owner-occupied | Renter-occupied |
| Utility Gas | 765 (53.7%) | 913 (35.8%) |
| Bottled, Tank, or LP Gas | 66 (4.6%) | 80 (3.1%) |
| Electricity | 561 (39.4%) | 1,536 (60.2%) |
| Fuel Oil or Kerosene | 0 (0.0%) | 0 (0.0%) |
| Coal or Coke | 0 (0.0%) | 0 (0.0%) |
| All other Fuels | 33 (2.3%) | 20 (0.8%) |
| No Fuel Used | 0 (0.0%) | 2 (0.1%) |
| Total | 1,425 (100.0%) | 2,551 (100.0%) |
Household Vehicle Usage in Forrest City
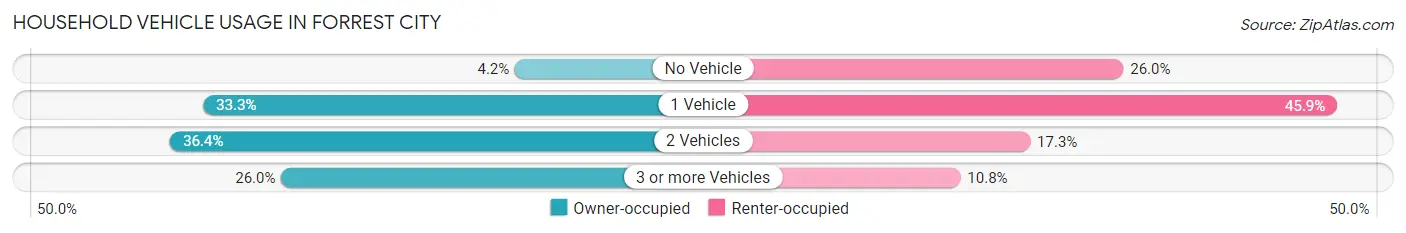
| Vehicles per Household | Owner-occupied | Renter-occupied |
| No Vehicle | 60 (4.2%) | 663 (26.0%) |
| 1 Vehicle | 475 (33.3%) | 1,172 (45.9%) |
| 2 Vehicles | 519 (36.4%) | 441 (17.3%) |
| 3 or more Vehicles | 371 (26.0%) | 275 (10.8%) |
| Total | 1,425 (100.0%) | 2,551 (100.0%) |
Real Estate & Mortgages in Forrest City
Real Estate and Mortgage Overview in Forrest City
| Characteristic | Without Mortgage | With Mortgage |
| Housing Units | 644 | 781 |
| Median Property Value | $68,400 | $85,600 |
| Median Household Income | $37,692 | $106 |
| Monthly Housing Costs | $385 | $25 |
| Real Estate Taxes | $446 | $159 |
Property Value by Mortgage Status in Forrest City
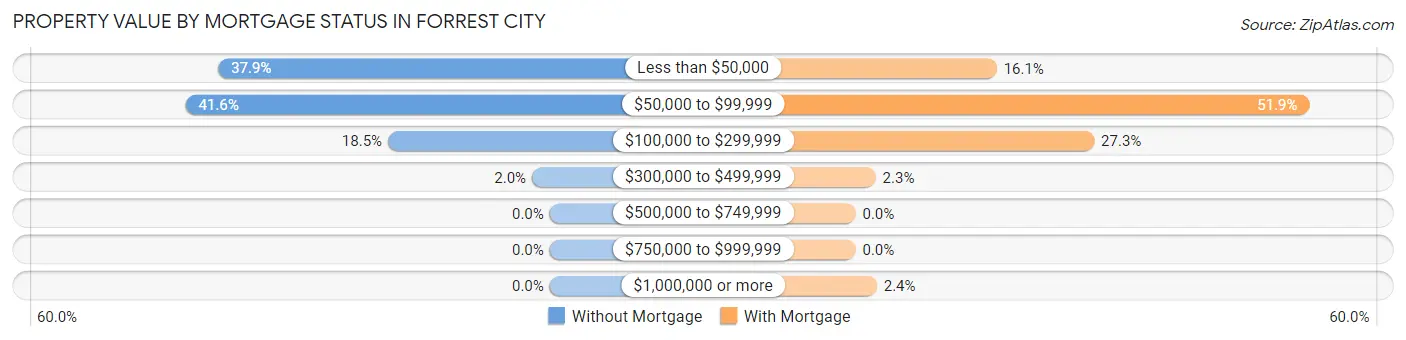
| Property Value | Without Mortgage | With Mortgage |
| Less than $50,000 | 244 (37.9%) | 126 (16.1%) |
| $50,000 to $99,999 | 268 (41.6%) | 405 (51.9%) |
| $100,000 to $299,999 | 119 (18.5%) | 213 (27.3%) |
| $300,000 to $499,999 | 13 (2.0%) | 18 (2.3%) |
| $500,000 to $749,999 | 0 (0.0%) | 0 (0.0%) |
| $750,000 to $999,999 | 0 (0.0%) | 0 (0.0%) |
| $1,000,000 or more | 0 (0.0%) | 19 (2.4%) |
| Total | 644 (100.0%) | 781 (100.0%) |
Household Income by Mortgage Status in Forrest City
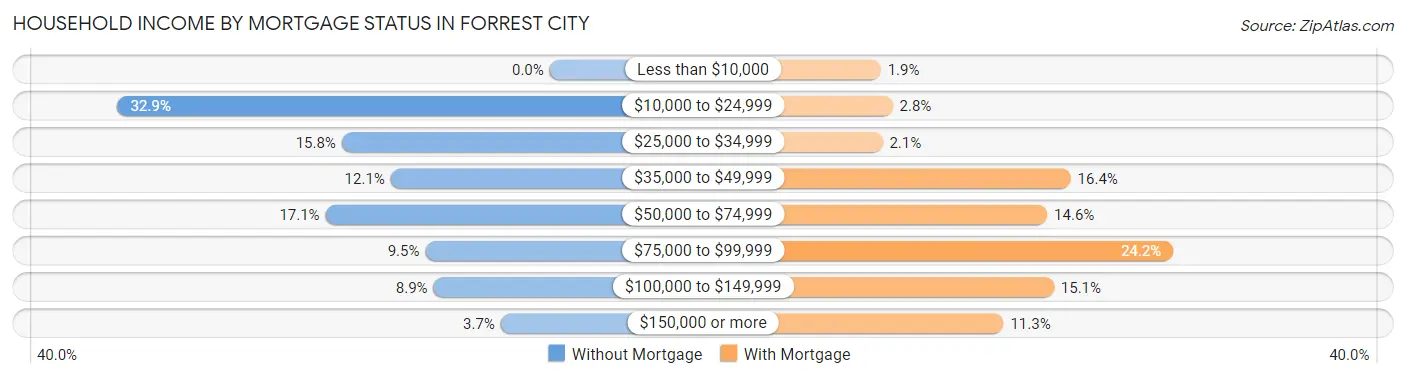
| Household Income | Without Mortgage | With Mortgage |
| Less than $10,000 | 0 (0.0%) | 15 (1.9%) |
| $10,000 to $24,999 | 212 (32.9%) | 22 (2.8%) |
| $25,000 to $34,999 | 102 (15.8%) | 16 (2.1%) |
| $35,000 to $49,999 | 78 (12.1%) | 128 (16.4%) |
| $50,000 to $74,999 | 110 (17.1%) | 114 (14.6%) |
| $75,000 to $99,999 | 61 (9.5%) | 189 (24.2%) |
| $100,000 to $149,999 | 57 (8.8%) | 118 (15.1%) |
| $150,000 or more | 24 (3.7%) | 88 (11.3%) |
| Total | 644 (100.0%) | 781 (100.0%) |
Property Value to Household Income Ratio in Forrest City
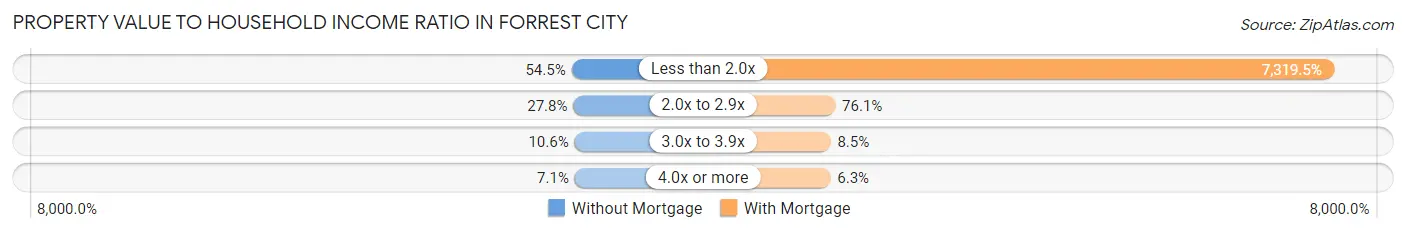
| Value-to-Income Ratio | Without Mortgage | With Mortgage |
| Less than 2.0x | 351 (54.5%) | 57,165 (7,319.5%) |
| 2.0x to 2.9x | 179 (27.8%) | 594 (76.1%) |
| 3.0x to 3.9x | 68 (10.6%) | 66 (8.5%) |
| 4.0x or more | 46 (7.1%) | 49 (6.3%) |
| Total | 644 (100.0%) | 781 (100.0%) |
Real Estate Taxes by Mortgage Status in Forrest City
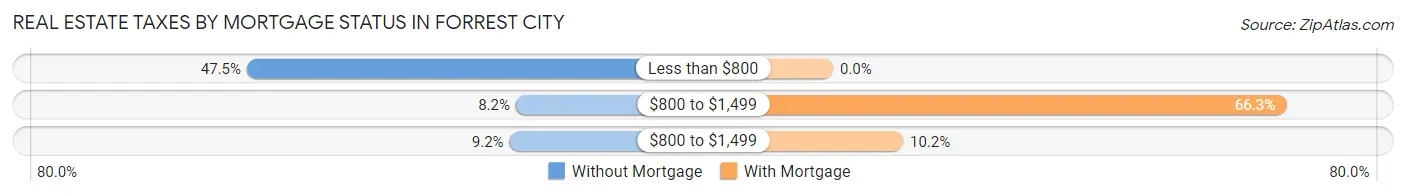
| Property Taxes | Without Mortgage | With Mortgage |
| Less than $800 | 306 (47.5%) | 0 (0.0%) |
| $800 to $1,499 | 53 (8.2%) | 518 (66.3%) |
| $800 to $1,499 | 59 (9.2%) | 80 (10.2%) |
| Total | 644 (100.0%) | 781 (100.0%) |
Health & Disability in Forrest City
Health Insurance Coverage by Age in Forrest City
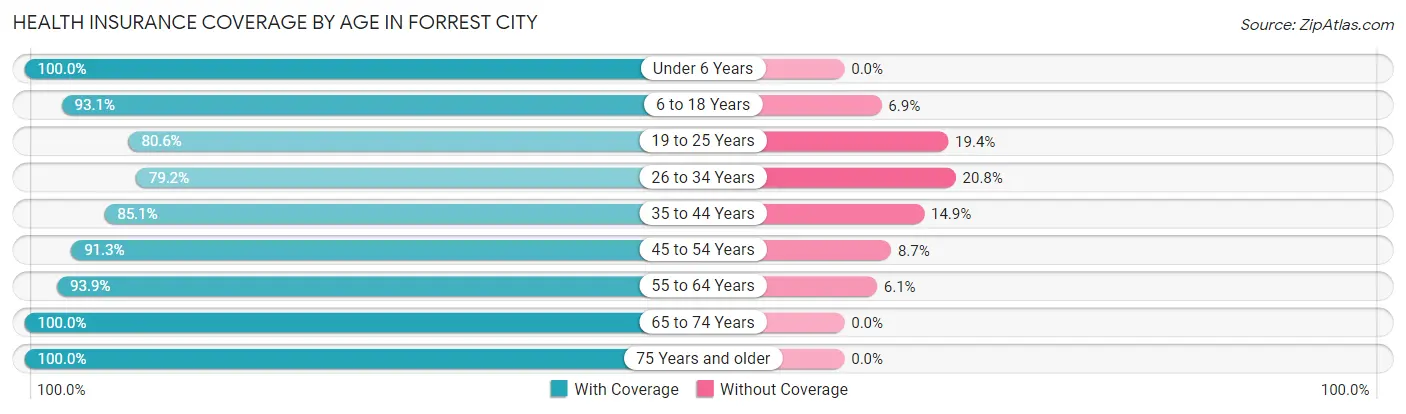
| Age Bracket | With Coverage | Without Coverage |
| Under 6 Years | 1,013 (100.0%) | 0 (0.0%) |
| 6 to 18 Years | 1,978 (93.1%) | 147 (6.9%) |
| 19 to 25 Years | 791 (80.6%) | 190 (19.4%) |
| 26 to 34 Years | 1,275 (79.2%) | 334 (20.8%) |
| 35 to 44 Years | 950 (85.1%) | 166 (14.9%) |
| 45 to 54 Years | 661 (91.3%) | 63 (8.7%) |
| 55 to 64 Years | 1,145 (93.9%) | 74 (6.1%) |
| 65 to 74 Years | 870 (100.0%) | 0 (0.0%) |
| 75 Years and older | 433 (100.0%) | 0 (0.0%) |
| Total | 9,116 (90.3%) | 974 (9.7%) |
Health Insurance Coverage by Citizenship Status in Forrest City
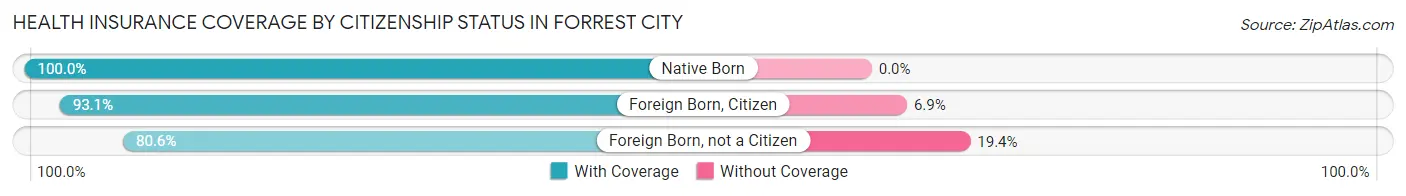
| Citizenship Status | With Coverage | Without Coverage |
| Native Born | 1,013 (100.0%) | 0 (0.0%) |
| Foreign Born, Citizen | 1,978 (93.1%) | 147 (6.9%) |
| Foreign Born, not a Citizen | 791 (80.6%) | 190 (19.4%) |
Health Insurance Coverage by Household Income in Forrest City
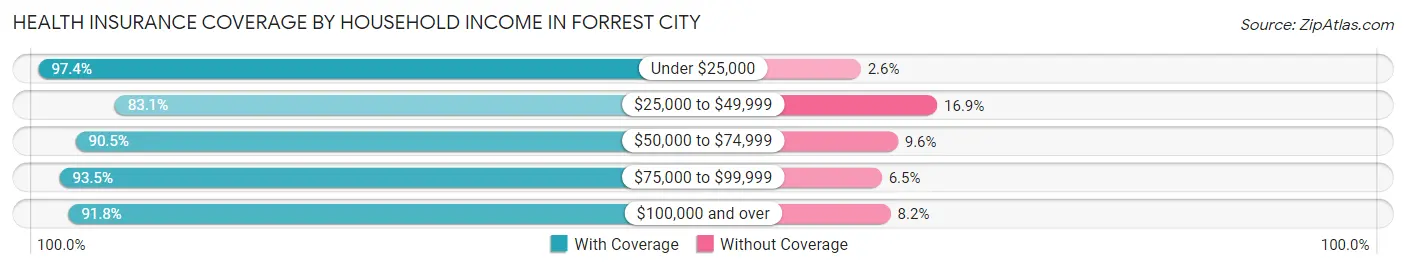
| Household Income | With Coverage | Without Coverage |
| Under $25,000 | 2,872 (97.4%) | 77 (2.6%) |
| $25,000 to $49,999 | 2,731 (83.1%) | 556 (16.9%) |
| $50,000 to $74,999 | 1,780 (90.4%) | 188 (9.6%) |
| $75,000 to $99,999 | 772 (93.5%) | 54 (6.5%) |
| $100,000 and over | 893 (91.8%) | 80 (8.2%) |
Public vs Private Health Insurance Coverage by Age in Forrest City
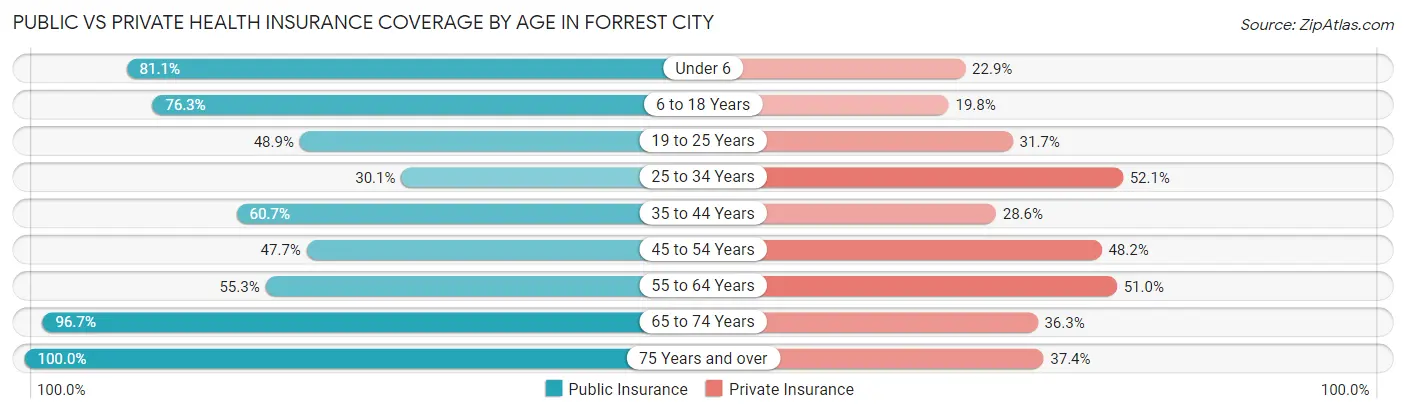
| Age Bracket | Public Insurance | Private Insurance |
| Under 6 | 821 (81.0%) | 232 (22.9%) |
| 6 to 18 Years | 1,621 (76.3%) | 421 (19.8%) |
| 19 to 25 Years | 480 (48.9%) | 311 (31.7%) |
| 25 to 34 Years | 484 (30.1%) | 839 (52.1%) |
| 35 to 44 Years | 677 (60.7%) | 319 (28.6%) |
| 45 to 54 Years | 345 (47.6%) | 349 (48.2%) |
| 55 to 64 Years | 674 (55.3%) | 622 (51.0%) |
| 65 to 74 Years | 841 (96.7%) | 316 (36.3%) |
| 75 Years and over | 433 (100.0%) | 162 (37.4%) |
| Total | 6,376 (63.2%) | 3,571 (35.4%) |
Disability Status by Sex by Age in Forrest City
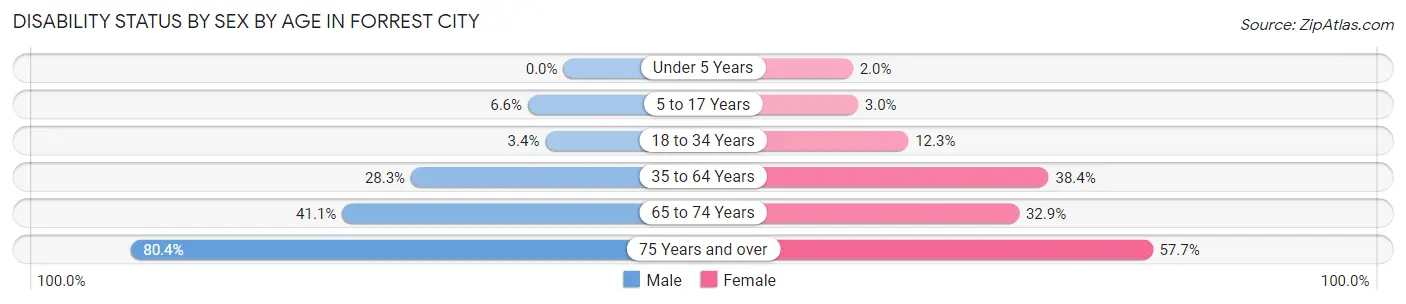
| Age Bracket | Male | Female |
| Under 5 Years | 0 (0.0%) | 8 (2.0%) |
| 5 to 17 Years | 70 (6.6%) | 29 (3.0%) |
| 18 to 34 Years | 50 (3.4%) | 169 (12.3%) |
| 35 to 64 Years | 348 (28.3%) | 702 (38.4%) |
| 65 to 74 Years | 140 (41.1%) | 174 (32.9%) |
| 75 Years and over | 86 (80.4%) | 188 (57.7%) |
Disability Class by Sex by Age in Forrest City
Disability Class: Hearing Difficulty
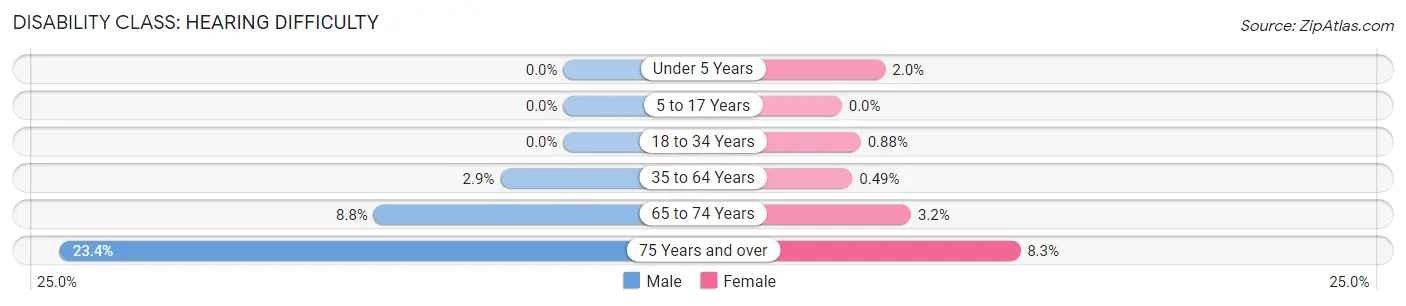
| Age Bracket | Male | Female |
| Under 5 Years | 0 (0.0%) | 8 (2.0%) |
| 5 to 17 Years | 0 (0.0%) | 0 (0.0%) |
| 18 to 34 Years | 0 (0.0%) | 12 (0.9%) |
| 35 to 64 Years | 36 (2.9%) | 9 (0.5%) |
| 65 to 74 Years | 30 (8.8%) | 17 (3.2%) |
| 75 Years and over | 25 (23.4%) | 27 (8.3%) |
Disability Class: Vision Difficulty
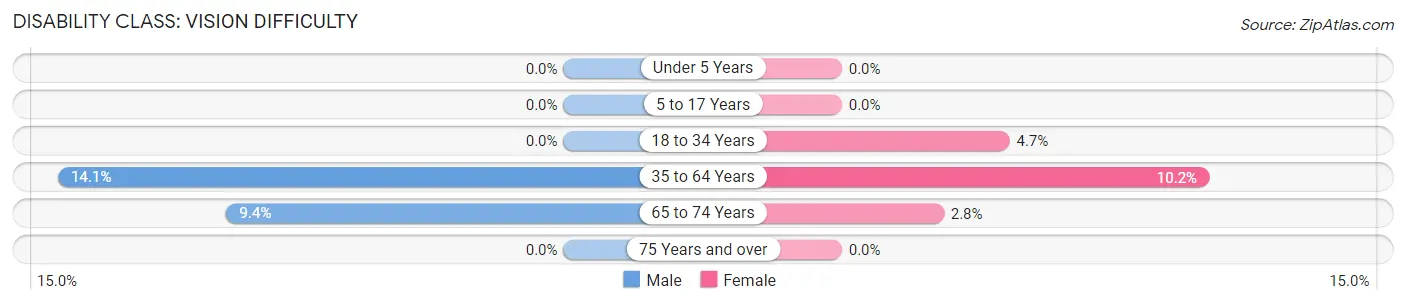
| Age Bracket | Male | Female |
| Under 5 Years | 0 (0.0%) | 0 (0.0%) |
| 5 to 17 Years | 0 (0.0%) | 0 (0.0%) |
| 18 to 34 Years | 0 (0.0%) | 64 (4.7%) |
| 35 to 64 Years | 173 (14.1%) | 187 (10.2%) |
| 65 to 74 Years | 32 (9.4%) | 15 (2.8%) |
| 75 Years and over | 0 (0.0%) | 0 (0.0%) |
Disability Class: Cognitive Difficulty
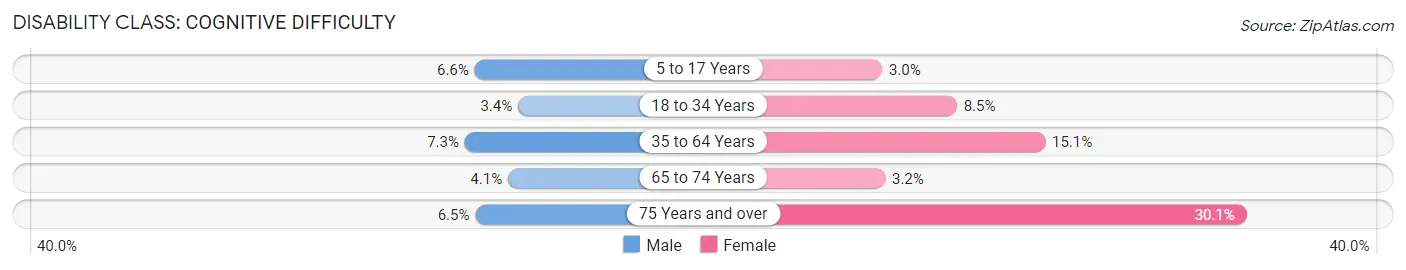
| Age Bracket | Male | Female |
| 5 to 17 Years | 70 (6.6%) | 29 (3.0%) |
| 18 to 34 Years | 50 (3.4%) | 117 (8.5%) |
| 35 to 64 Years | 90 (7.3%) | 276 (15.1%) |
| 65 to 74 Years | 14 (4.1%) | 17 (3.2%) |
| 75 Years and over | 7 (6.5%) | 98 (30.1%) |
Disability Class: Ambulatory Difficulty
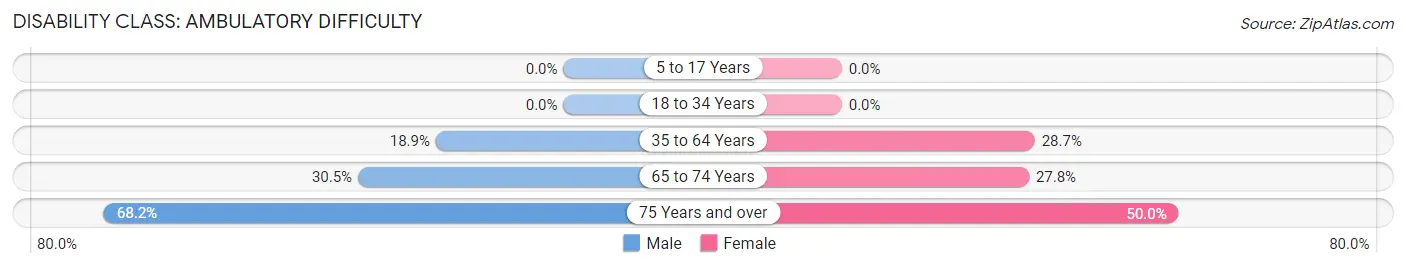
| Age Bracket | Male | Female |
| 5 to 17 Years | 0 (0.0%) | 0 (0.0%) |
| 18 to 34 Years | 0 (0.0%) | 0 (0.0%) |
| 35 to 64 Years | 233 (18.9%) | 524 (28.6%) |
| 65 to 74 Years | 104 (30.5%) | 147 (27.8%) |
| 75 Years and over | 73 (68.2%) | 163 (50.0%) |
Disability Class: Self-Care Difficulty
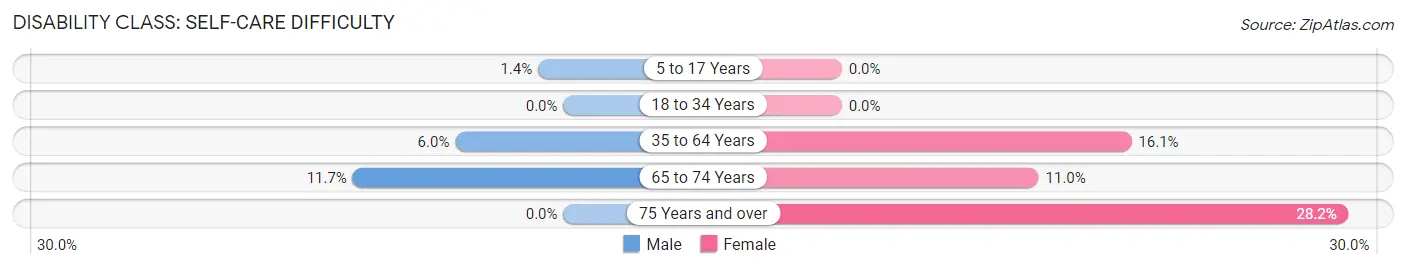
| Age Bracket | Male | Female |
| 5 to 17 Years | 15 (1.4%) | 0 (0.0%) |
| 18 to 34 Years | 0 (0.0%) | 0 (0.0%) |
| 35 to 64 Years | 74 (6.0%) | 295 (16.1%) |
| 65 to 74 Years | 40 (11.7%) | 58 (11.0%) |
| 75 Years and over | 0 (0.0%) | 92 (28.2%) |
Technology Access in Forrest City
Computing Device Access in Forrest City
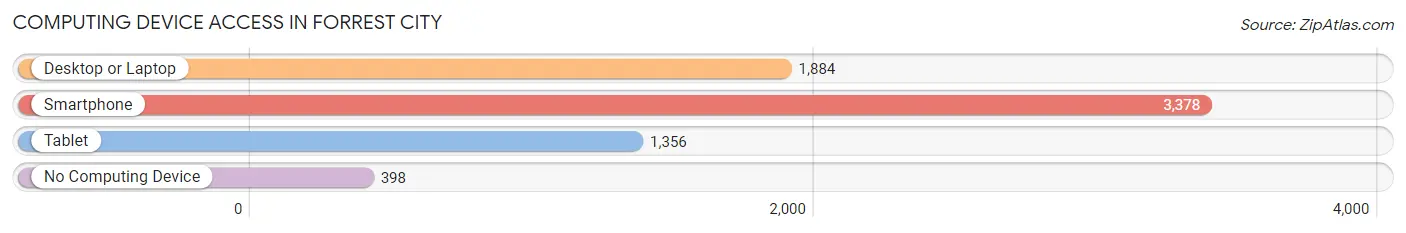
| Device Type | # Households | % Households |
| Desktop or Laptop | 1,884 | 47.4% |
| Smartphone | 3,378 | 85.0% |
| Tablet | 1,356 | 34.1% |
| No Computing Device | 398 | 10.0% |
| Total | 3,976 | 100.0% |
Internet Access in Forrest City
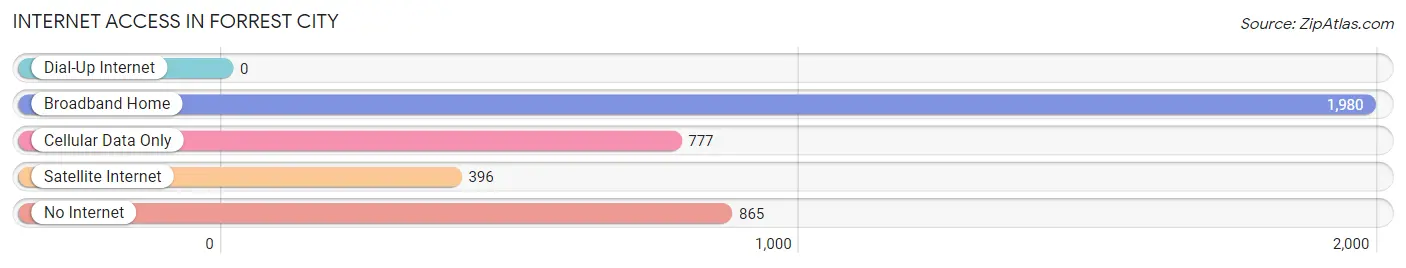
| Internet Type | # Households | % Households |
| Dial-Up Internet | 0 | 0.0% |
| Broadband Home | 1,980 | 49.8% |
| Cellular Data Only | 777 | 19.5% |
| Satellite Internet | 396 | 10.0% |
| No Internet | 865 | 21.8% |
| Total | 3,976 | 100.0% |
Forrest City Summary
Forrest City is a city located in St. Francis County, Arkansas, United States. It is situated in the Arkansas Delta region, and is the county seat of St. Francis County. The city is located approximately 70 miles east of Little Rock, the state capital. As of the 2010 census, the population of Forrest City was 15,371, making it the largest city in St. Francis County.
History
Forrest City was founded in 1870 by Captain John W. Forrest, a Confederate veteran of the Civil War. The city was named after him, and was incorporated in 1874. The city was originally a small trading post, but grew rapidly after the arrival of the St. Louis, Iron Mountain and Southern Railway in 1881. The city was a major center for cotton production and processing, and was home to several cotton mills.
Geography
Forrest City is located at 35°1'25" North, 90°47'25" West (35.023607, -90.790278). According to the United States Census Bureau, the city has a total area of 11.2 square miles (29.0 km2), of which 11.1 square miles (28.7 km2) is land and 0.1 square miles (0.3 km2) is water.
Economy
Forrest City is a major center for agriculture and manufacturing. The city is home to several large poultry processing plants, as well as a number of other manufacturing and industrial businesses. The city is also home to a large retail sector, with several large shopping centers and stores.
Demographics
As of the 2010 census, there were 15,371 people, 5,845 households, and 3,845 families residing in the city. The population density was 1,384.2 people per square mile (534.3/km2). There were 6,541 housing units at an average density of 586.2 per square mile (226.7/km2). The racial makeup of the city was 57.2% White, 39.7% African American, 0.3% Native American, 0.5% Asian, 0.1% Pacific Islander, 0.7% from other races, and 1.5% from two or more races. Hispanic or Latino of any race were 2.2% of the population.
There were 5,845 households, out of which 33.2% had children under the age of 18 living with them, 37.2% were married couples living together, 24.2% had a female householder with no husband present, and 33.7% were non-families. 29.2% of all households were made up of individuals, and 12.3% had someone living alone who was 65 years of age or older. The average household size was 2.50 and the average family size was 3.09.
In the city, the population was spread out, with 28.2% under the age of 18, 9.7% from 18 to 24, 25.7% from 25 to 44, 22.2% from 45 to 64, and 14.2% who were 65 years of age or older. The median age was 35 years. For every 100 females, there were 87.2 males. For every 100 females age 18 and over, there were 81.3 males.
The median income for a household in the city was $26,945, and the median income for a family was $32,917. Males had a median income of $30,917 versus $21,917 for females. The per capita income for the city was $14,845. About 20.2% of families and 24.2% of the population were below the poverty line, including 33.7% of those under age 18 and 17.2% of those age 65 or over.
Common Questions
What is Per Capita Income in Forrest City?
Per Capita income in Forrest City is $16,551.
What is the Median Family Income in Forrest City?
Median Family Income in Forrest City is $39,342.
What is the Median Household income in Forrest City?
Median Household Income in Forrest City is $36,368.
What is Income or Wage Gap in Forrest City?
Income or Wage Gap in Forrest City is 11.0%.
Women in Forrest City earn 89.0 cents for every dollar earned by a man.
What is Inequality or Gini Index in Forrest City?
Inequality or Gini Index in Forrest City is 0.49.
What is the Total Population of Forrest City?
Total Population of Forrest City is 13,010.
What is the Total Male Population of Forrest City?
Total Male Population of Forrest City is 7,537.
What is the Total Female Population of Forrest City?
Total Female Population of Forrest City is 5,473.
What is the Ratio of Males per 100 Females in Forrest City?
There are 137.71 Males per 100 Females in Forrest City.
What is the Ratio of Females per 100 Males in Forrest City?
There are 72.62 Females per 100 Males in Forrest City.
What is the Median Population Age in Forrest City?
Median Population Age in Forrest City is 35.2 Years.
What is the Average Family Size in Forrest City
Average Family Size in Forrest City is 3.3 People.
What is the Average Household Size in Forrest City
Average Household Size in Forrest City is 2.5 People.
How Large is the Labor Force in Forrest City?
There are 4,026 People in the Labor Forcein in Forrest City.
What is the Percentage of People in the Labor Force in Forrest City?
39.0% of People are in the Labor Force in Forrest City.
What is the Unemployment Rate in Forrest City?
Unemployment Rate in Forrest City is 9.3%.