Denali Park, AK Map & Demographics
Denali Park Map
Denali Park Overview
$122,651
PER CAPITA INCOME
$166,406
AVG FAMILY INCOME
$86,250
AVG HOUSEHOLD INCOME
0.23
INEQUALITY / GINI INDEX
817
TOTAL POPULATION
670
MALE POPULATION
147
FEMALE POPULATION
455.78
MALES / 100 FEMALES
21.94
FEMALES / 100 MALES
44.5
MEDIAN AGE
2.4
AVG FAMILY SIZE
2.0
AVG HOUSEHOLD SIZE
780
LABOR FORCE [ PEOPLE ]
97.1%
PERCENT IN LABOR FORCE
Denali Park Area Codes
Income in Denali Park
Income Overview in Denali Park
Per Capita Income in Denali Park is $122,651, while median incomes of families and households are $166,406 and $86,250 respectively.
| Characteristic | Number | Measure |
| Per Capita Income | 817 | $122,651 |
| Median Family Income | 25 | $166,406 |
| Mean Family Income | 25 | $146,800 |
| Median Household Income | 45 | $86,250 |
| Mean Household Income | 45 | $114,358 |
| Income Deficit | 25 | $0 |
| Wage / Income Gap (%) | 817 | 0.00% |
| Wage / Income Gap ($) | 817 | 100.00¢ per $1 |
| Gini / Inequality Index | 817 | 0.23 |
Earnings by Sex in Denali Park
| Sex | Number | Average Earnings |
| Male | 656 (81.7%) | $0 |
| Female | 147 (18.3%) | $0 |
| Total | 803 (100.0%) | $0 |
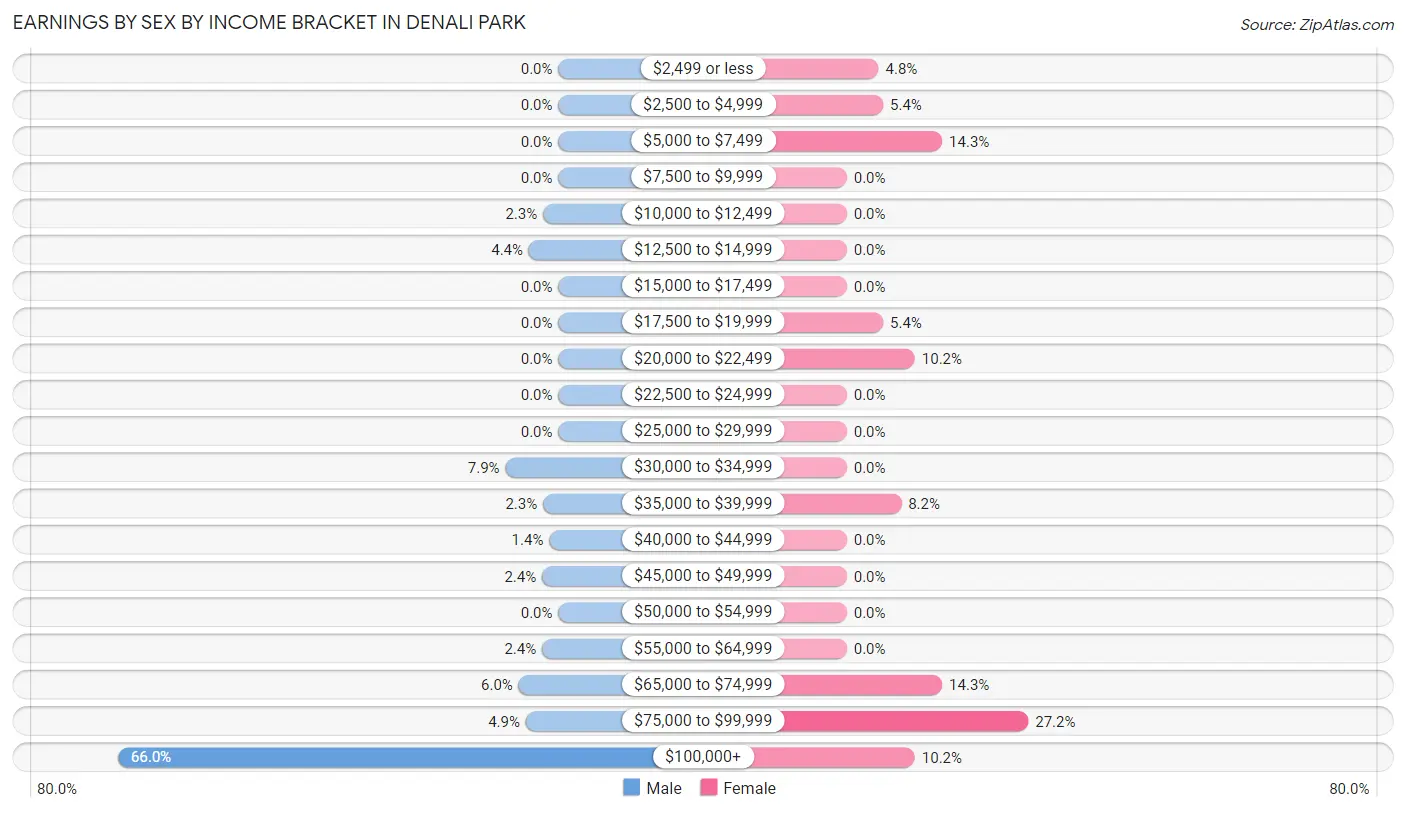
Earnings by Sex by Income Bracket in Denali Park
The most common earnings brackets in Denali Park are $100,000+ for men (433 | 66.0%) and $75,000 to $99,999 for women (40 | 27.2%).
| Income | Male | Female |
| $2,499 or less | 0 (0.0%) | 7 (4.8%) |
| $2,500 to $4,999 | 0 (0.0%) | 8 (5.4%) |
| $5,000 to $7,499 | 0 (0.0%) | 21 (14.3%) |
| $7,500 to $9,999 | 0 (0.0%) | 0 (0.0%) |
| $10,000 to $12,499 | 15 (2.3%) | 0 (0.0%) |
| $12,500 to $14,999 | 29 (4.4%) | 0 (0.0%) |
| $15,000 to $17,499 | 0 (0.0%) | 0 (0.0%) |
| $17,500 to $19,999 | 0 (0.0%) | 8 (5.4%) |
| $20,000 to $22,499 | 0 (0.0%) | 15 (10.2%) |
| $22,500 to $24,999 | 0 (0.0%) | 0 (0.0%) |
| $25,000 to $29,999 | 0 (0.0%) | 0 (0.0%) |
| $30,000 to $34,999 | 52 (7.9%) | 0 (0.0%) |
| $35,000 to $39,999 | 15 (2.3%) | 12 (8.2%) |
| $40,000 to $44,999 | 9 (1.4%) | 0 (0.0%) |
| $45,000 to $49,999 | 16 (2.4%) | 0 (0.0%) |
| $50,000 to $54,999 | 0 (0.0%) | 0 (0.0%) |
| $55,000 to $64,999 | 16 (2.4%) | 0 (0.0%) |
| $65,000 to $74,999 | 39 (5.9%) | 21 (14.3%) |
| $75,000 to $99,999 | 32 (4.9%) | 40 (27.2%) |
| $100,000+ | 433 (66.0%) | 15 (10.2%) |
| Total | 656 (100.0%) | 147 (100.0%) |
Earnings by Sex by Educational Attainment in Denali Park
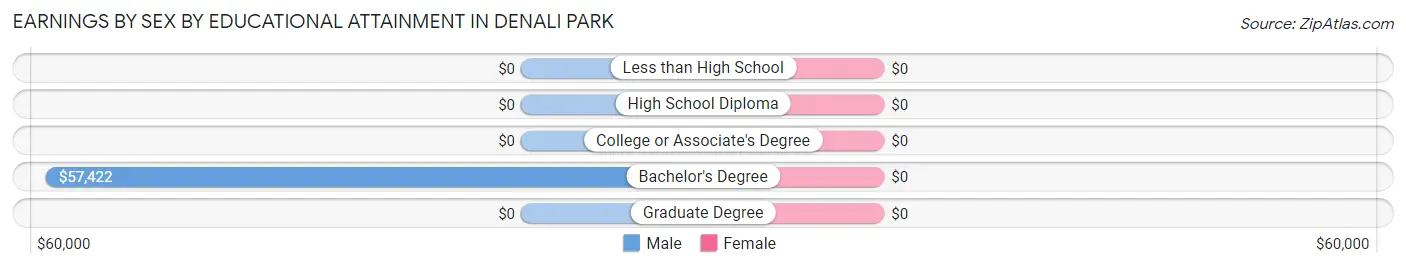
| Educational Attainment | Male Income | Female Income |
| Less than High School | - | - |
| High School Diploma | - | - |
| College or Associate's Degree | - | - |
| Bachelor's Degree | $57,422 | $0 |
| Graduate Degree | - | - |
| Total | - | - |
Family Income in Denali Park
Family Income Brackets in Denali Park
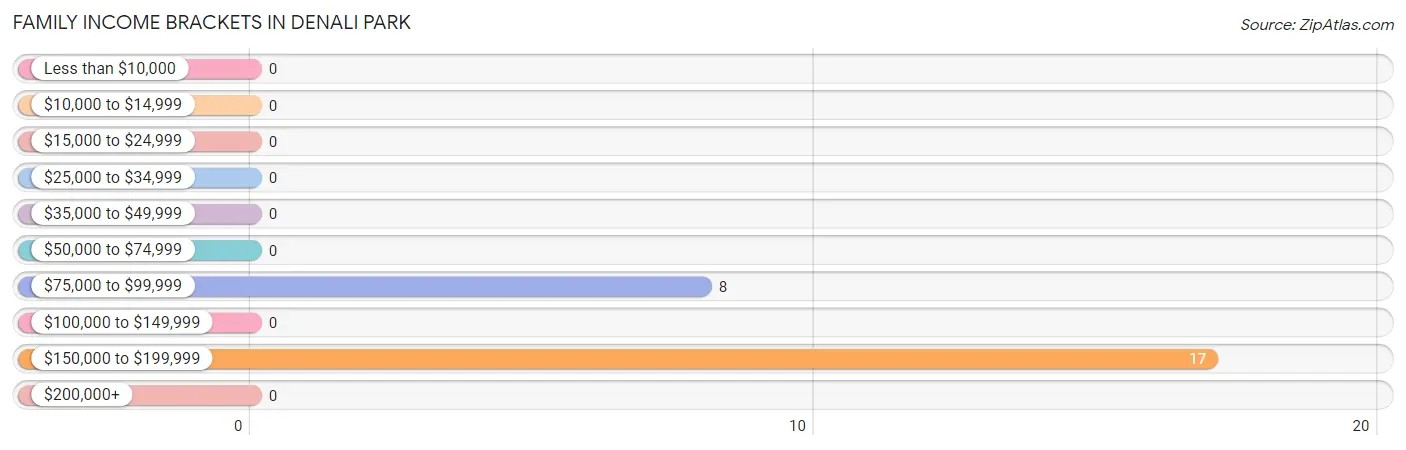
According to the Denali Park family income data, there are 17 families falling into the $150,000 to $199,999 income range, which is the most common income bracket and makes up 68.0% of all families.
| Income Bracket | # Families | % Families |
| Less than $10,000 | 0 | 0.0% |
| $10,000 to $14,999 | 0 | 0.0% |
| $15,000 to $24,999 | 0 | 0.0% |
| $25,000 to $34,999 | 0 | 0.0% |
| $35,000 to $49,999 | 0 | 0.0% |
| $50,000 to $74,999 | 0 | 0.0% |
| $75,000 to $99,999 | 8 | 32.0% |
| $100,000 to $149,999 | 0 | 0.0% |
| $150,000 to $199,999 | 17 | 68.0% |
| $200,000+ | 0 | 0.0% |
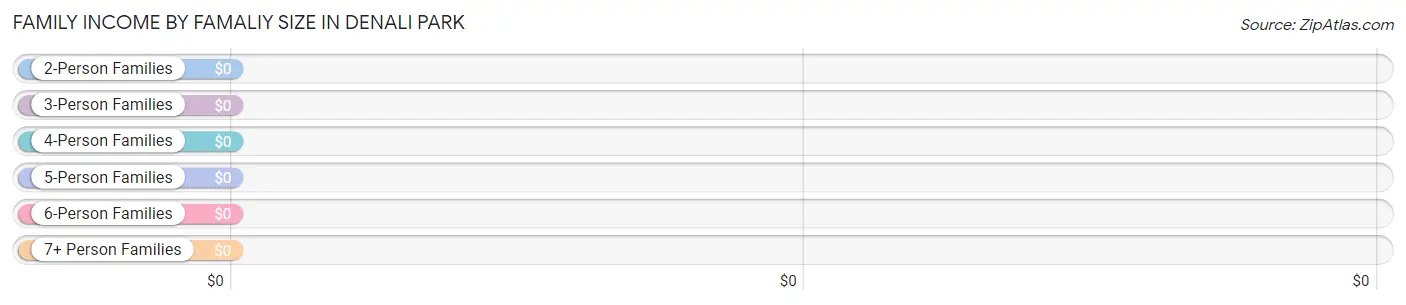
Family Income by Famaliy Size in Denali Park
| Income Bracket | # Families | Median Income |
| 2-Person Families | 16 (64.0%) | $0 |
| 3-Person Families | 0 (0.0%) | $0 |
| 4-Person Families | 9 (36.0%) | $0 |
| 5-Person Families | 0 (0.0%) | $0 |
| 6-Person Families | 0 (0.0%) | $0 |
| 7+ Person Families | 0 (0.0%) | $0 |
| Total | 25 (100.0%) | $166,406 |
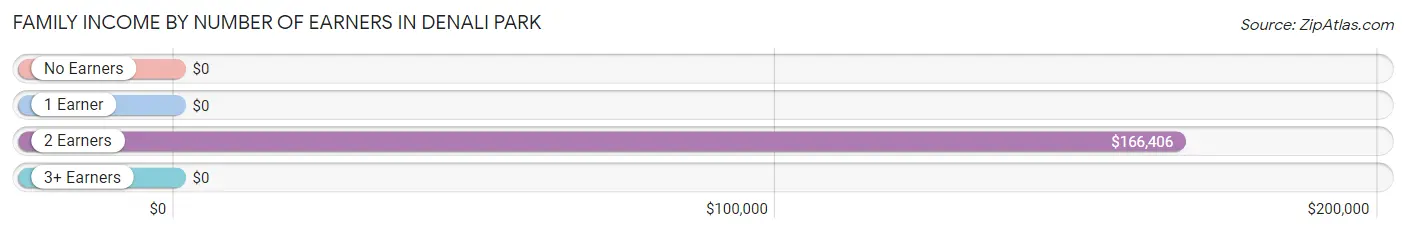
Family Income by Number of Earners in Denali Park
| Number of Earners | # Families | Median Income |
| No Earners | 0 (0.0%) | $0 |
| 1 Earner | 0 (0.0%) | $0 |
| 2 Earners | 25 (100.0%) | $166,406 |
| 3+ Earners | 0 (0.0%) | $0 |
| Total | 25 (100.0%) | $166,406 |
Household Income in Denali Park
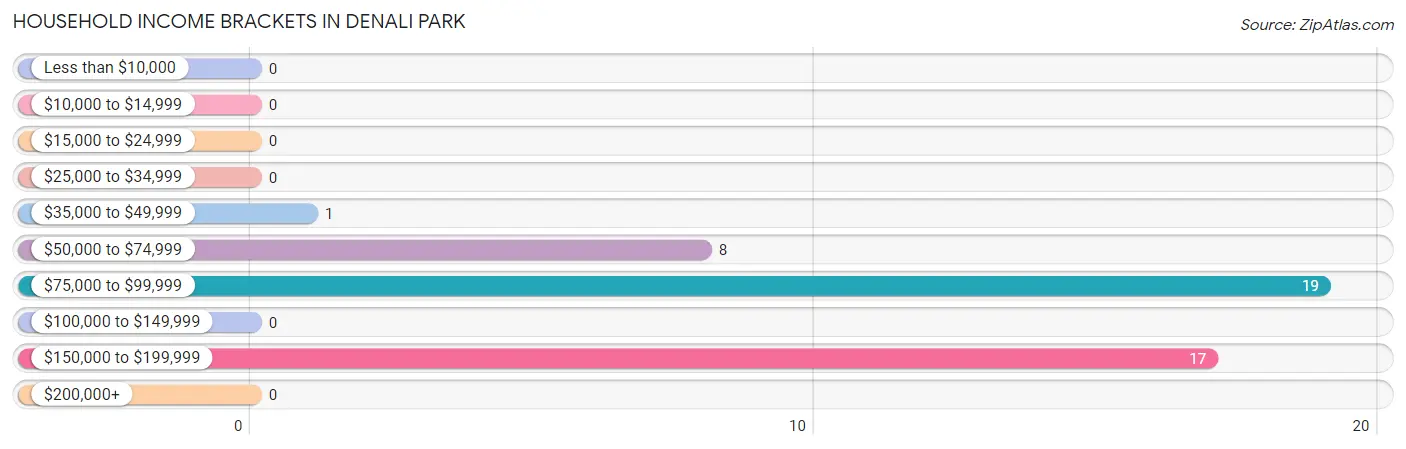
Household Income Brackets in Denali Park
With 19 households falling in the category, the $75,000 to $99,999 income range is the most frequent in Denali Park, accounting for 42.2% of all households.
| Income Bracket | # Households | % Households |
| Less than $10,000 | 0 | 0.0% |
| $10,000 to $14,999 | 0 | 0.0% |
| $15,000 to $24,999 | 0 | 0.0% |
| $25,000 to $34,999 | 0 | 0.0% |
| $35,000 to $49,999 | 1 | 2.2% |
| $50,000 to $74,999 | 8 | 17.8% |
| $75,000 to $99,999 | 19 | 42.2% |
| $100,000 to $149,999 | 0 | 0.0% |
| $150,000 to $199,999 | 17 | 37.8% |
| $200,000+ | 0 | 0.0% |
Household Income by Householder Age in Denali Park
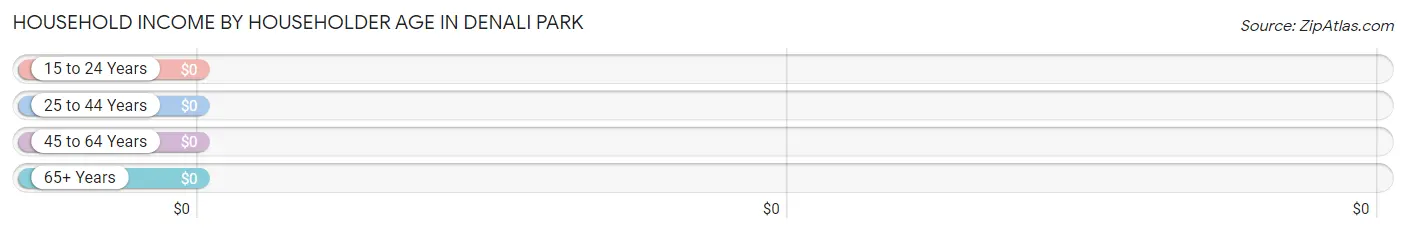
| Income Bracket | # Households | Median Income |
| 15 to 24 Years | 0 (0.0%) | $0 |
| 25 to 44 Years | 21 (46.7%) | $0 |
| 45 to 64 Years | 8 (17.8%) | $0 |
| 65+ Years | 16 (35.6%) | $0 |
| Total | 45 (100.0%) | $86,250 |
Poverty in Denali Park
Income Below Poverty by Sex and Age in Denali Park
With 5.4% poverty level for males and 14.3% for females among the residents of Denali Park, 25 to 34 year old males and 35 to 44 year old females are the most vulnerable to poverty, with 21 males (39.6%) and 21 females (51.2%) in their respective age groups living below the poverty level.
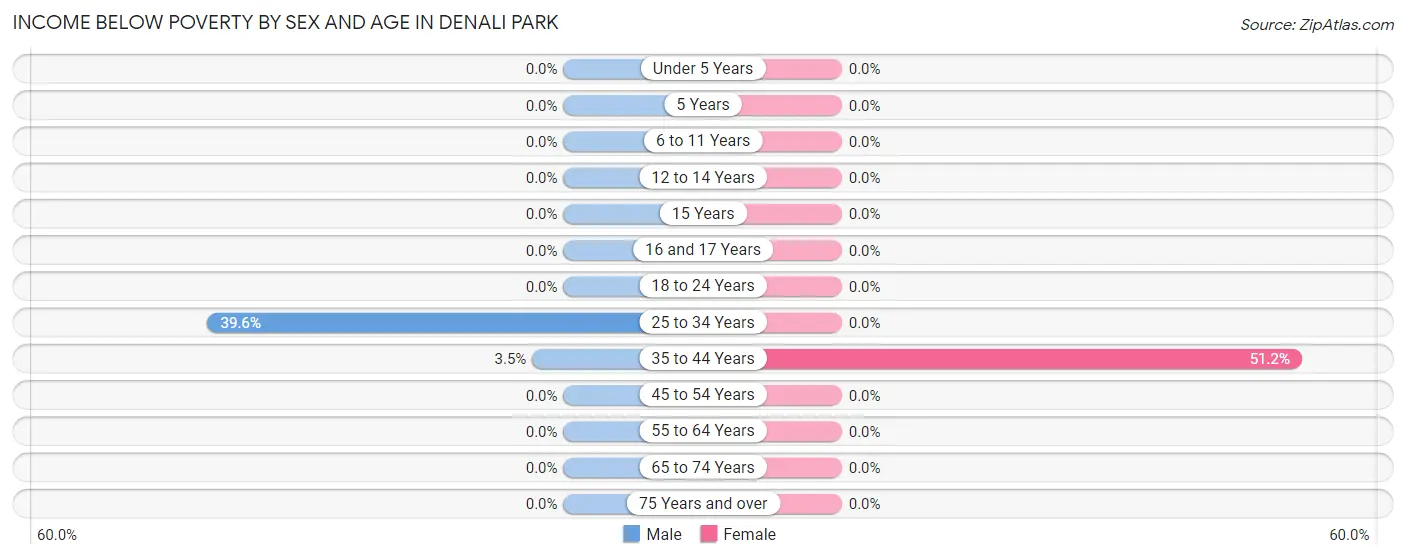
| Age Bracket | Male | Female |
| Under 5 Years | 0 (0.0%) | 0 (0.0%) |
| 5 Years | 0 (0.0%) | 0 (0.0%) |
| 6 to 11 Years | 0 (0.0%) | 0 (0.0%) |
| 12 to 14 Years | 0 (0.0%) | 0 (0.0%) |
| 15 Years | 0 (0.0%) | 0 (0.0%) |
| 16 and 17 Years | 0 (0.0%) | 0 (0.0%) |
| 18 to 24 Years | 0 (0.0%) | 0 (0.0%) |
| 25 to 34 Years | 21 (39.6%) | 0 (0.0%) |
| 35 to 44 Years | 15 (3.5%) | 21 (51.2%) |
| 45 to 54 Years | 0 (0.0%) | 0 (0.0%) |
| 55 to 64 Years | 0 (0.0%) | 0 (0.0%) |
| 65 to 74 Years | 0 (0.0%) | 0 (0.0%) |
| 75 Years and over | 0 (0.0%) | 0 (0.0%) |
| Total | 36 (5.4%) | 21 (14.3%) |
Income Above Poverty by Sex and Age in Denali Park
According to the poverty statistics in Denali Park, males aged 5 years and females aged 18 to 24 years are the age groups that are most secure financially, with 100.0% of males and 100.0% of females in these age groups living above the poverty line.
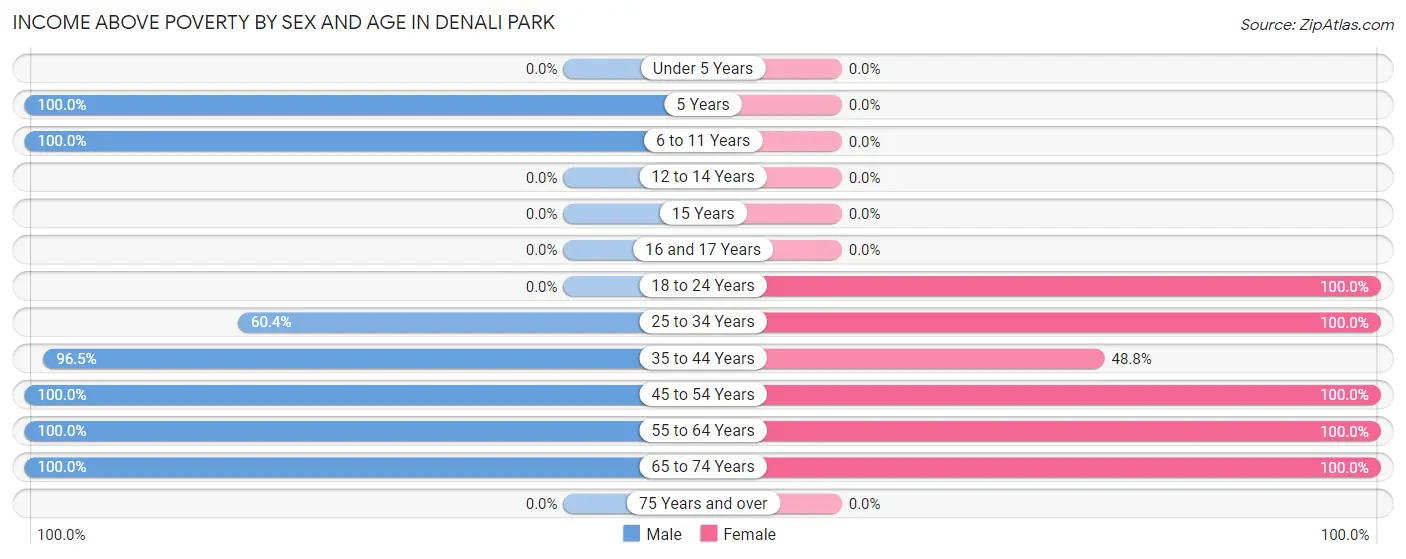
| Age Bracket | Male | Female |
| Under 5 Years | 0 (0.0%) | 0 (0.0%) |
| 5 Years | 7 (100.0%) | 0 (0.0%) |
| 6 to 11 Years | 7 (100.0%) | 0 (0.0%) |
| 12 to 14 Years | 0 (0.0%) | 0 (0.0%) |
| 15 Years | 0 (0.0%) | 0 (0.0%) |
| 16 and 17 Years | 0 (0.0%) | 0 (0.0%) |
| 18 to 24 Years | 0 (0.0%) | 21 (100.0%) |
| 25 to 34 Years | 32 (60.4%) | 32 (100.0%) |
| 35 to 44 Years | 417 (96.5%) | 20 (48.8%) |
| 45 to 54 Years | 66 (100.0%) | 30 (100.0%) |
| 55 to 64 Years | 97 (100.0%) | 8 (100.0%) |
| 65 to 74 Years | 8 (100.0%) | 15 (100.0%) |
| 75 Years and over | 0 (0.0%) | 0 (0.0%) |
| Total | 634 (94.6%) | 126 (85.7%) |
Income Below Poverty Among Married-Couple Families in Denali Park
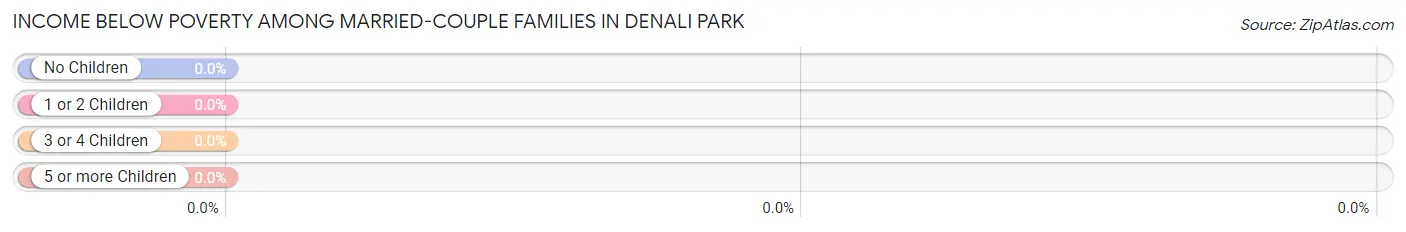
| Children | Above Poverty | Below Poverty |
| No Children | 16 (100.0%) | 0 (0.0%) |
| 1 or 2 Children | 9 (100.0%) | 0 (0.0%) |
| 3 or 4 Children | 0 (0.0%) | 0 (0.0%) |
| 5 or more Children | 0 (0.0%) | 0 (0.0%) |
| Total | 25 (100.0%) | 0 (0.0%) |
Income Below Poverty Among Single-Parent Households in Denali Park
| Children | Single Father | Single Mother |
| No Children | 0 (0.0%) | 0 (0.0%) |
| 1 or 2 Children | 0 (0.0%) | 0 (0.0%) |
| 3 or 4 Children | 0 (0.0%) | 0 (0.0%) |
| 5 or more Children | 0 (0.0%) | 0 (0.0%) |
| Total | 0 (0.0%) | 0 (0.0%) |
Income Below Poverty Among Married-Couple vs Single-Parent Households in Denali Park
| Children | Married-Couple Families | Single-Parent Households |
| No Children | 0 (0.0%) | 0 (0.0%) |
| 1 or 2 Children | 0 (0.0%) | 0 (0.0%) |
| 3 or 4 Children | 0 (0.0%) | 0 (0.0%) |
| 5 or more Children | 0 (0.0%) | 0 (0.0%) |
| Total | 0 (0.0%) | 0 (0.0%) |
Race in Denali Park
The most populous races in Denali Park are White / Caucasian (680 | 83.2%), Asian (52 | 6.4%), and Black / African American (30 | 3.7%).
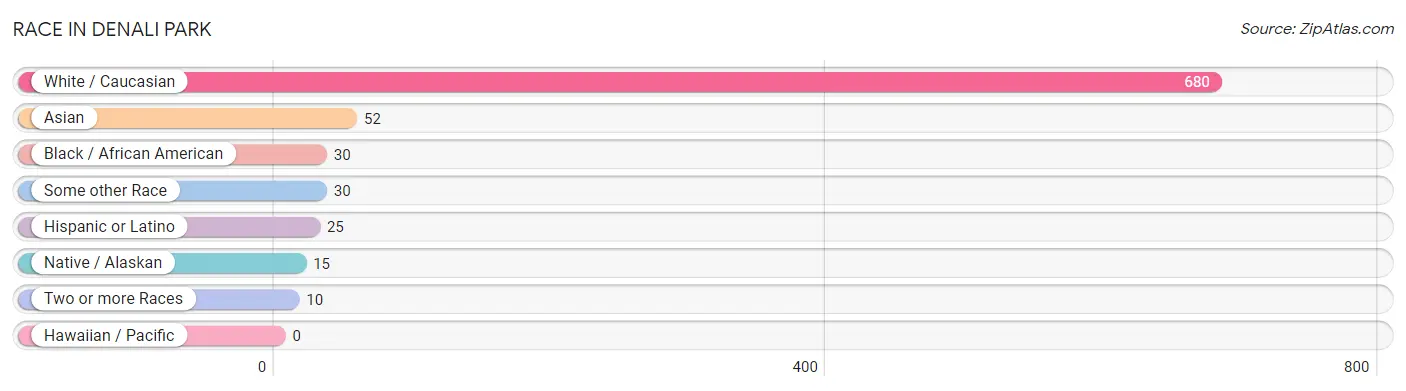
| Race | # Population | % Population |
| Asian | 52 | 6.4% |
| Black / African American | 30 | 3.7% |
| Hawaiian / Pacific | 0 | 0.0% |
| Hispanic or Latino | 25 | 3.1% |
| Native / Alaskan | 15 | 1.8% |
| White / Caucasian | 680 | 83.2% |
| Two or more Races | 10 | 1.2% |
| Some other Race | 30 | 3.7% |
| Total | 817 | 100.0% |
Ancestry in Denali Park
The most populous ancestries reported in Denali Park are German (78 | 9.6%), Korean (62 | 7.6%), European (36 | 4.4%), Canadian (21 | 2.6%), and Jamaican (21 | 2.6%), together accounting for 26.7% of all Denali Park residents.
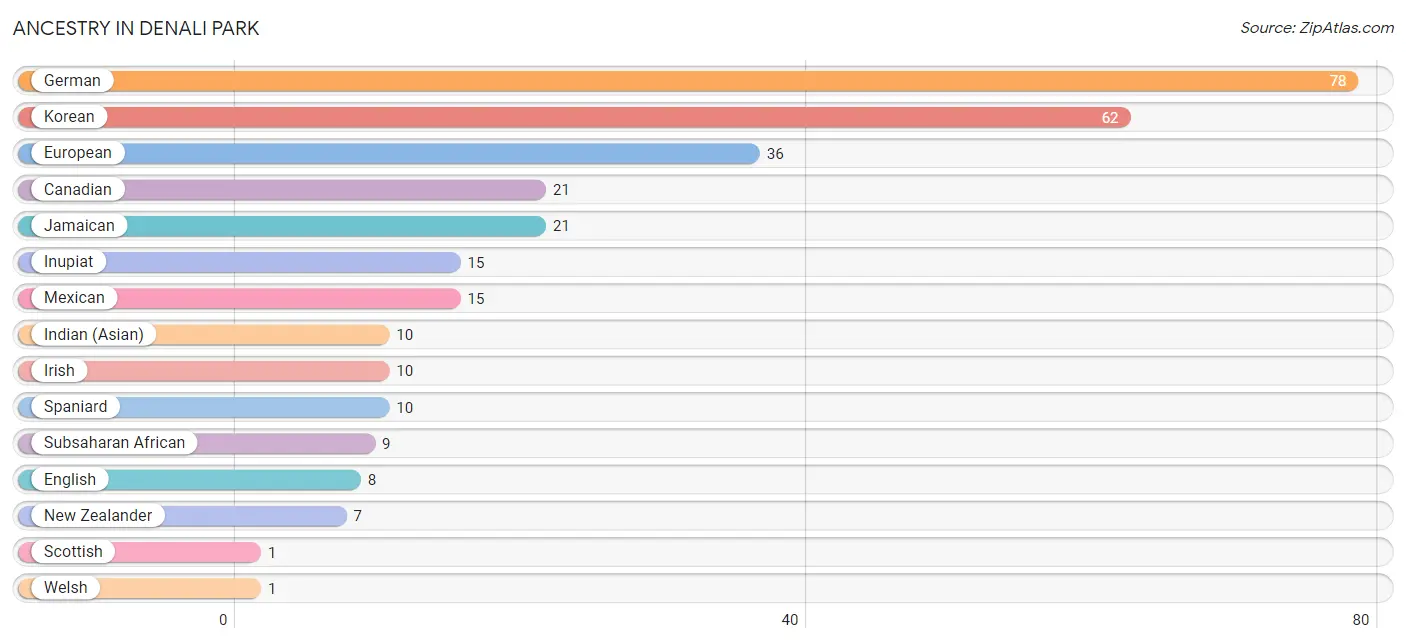
| Ancestry | # Population | % Population |
| Canadian | 21 | 2.6% |
| English | 8 | 1.0% |
| European | 36 | 4.4% |
| German | 78 | 9.6% |
| Indian (Asian) | 10 | 1.2% |
| Inupiat | 15 | 1.8% |
| Irish | 10 | 1.2% |
| Jamaican | 21 | 2.6% |
| Korean | 62 | 7.6% |
| Mexican | 15 | 1.8% |
| New Zealander | 7 | 0.9% |
| Scottish | 1 | 0.1% |
| Spaniard | 10 | 1.2% |
| Subsaharan African | 9 | 1.1% |
| Welsh | 1 | 0.1% | View All 15 Rows |
Immigrants in Denali Park
The most numerous immigrant groups reported in Denali Park came from Asia (52 | 6.4%), Philippines (52 | 6.4%), South Eastern Asia (52 | 6.4%), Latin America (44 | 5.4%), and Central America (23 | 2.8%), together accounting for 27.3% of all Denali Park residents.
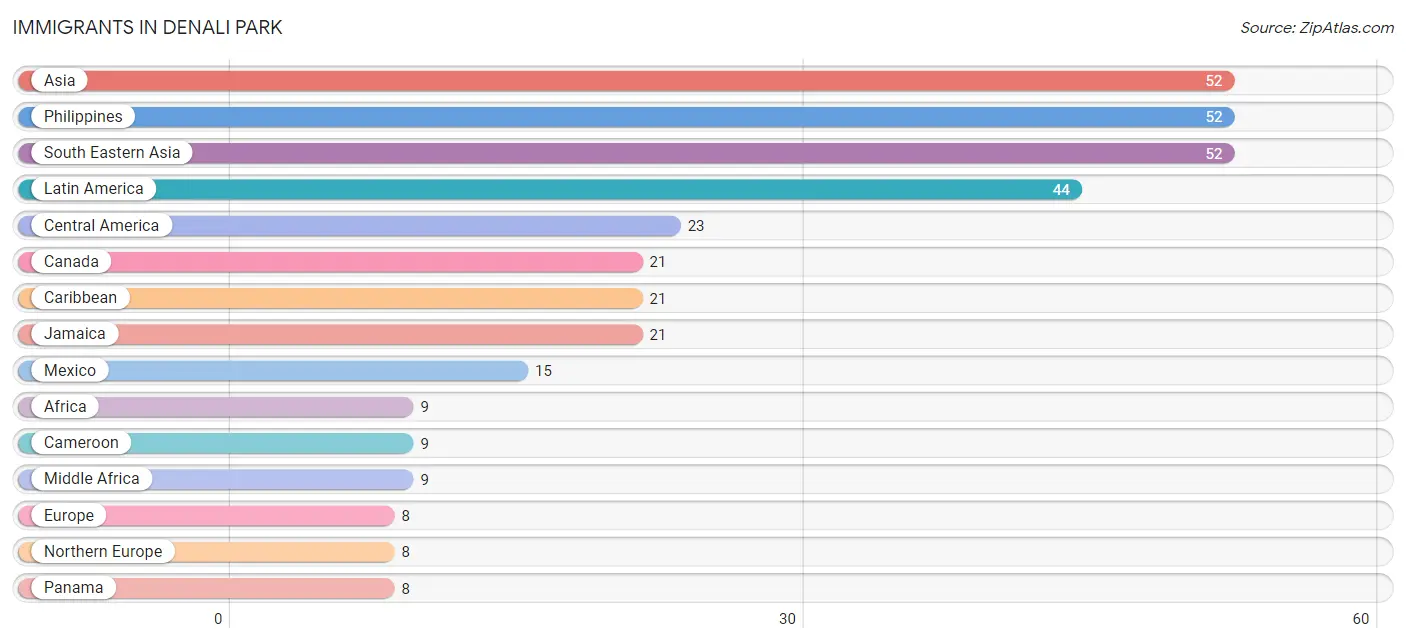
| Immigration Origin | # Population | % Population |
| Africa | 9 | 1.1% |
| Asia | 52 | 6.4% |
| Cameroon | 9 | 1.1% |
| Canada | 21 | 2.6% |
| Caribbean | 21 | 2.6% |
| Central America | 23 | 2.8% |
| Europe | 8 | 1.0% |
| Jamaica | 21 | 2.6% |
| Latin America | 44 | 5.4% |
| Mexico | 15 | 1.8% |
| Middle Africa | 9 | 1.1% |
| Northern Europe | 8 | 1.0% |
| Oceania | 7 | 0.9% |
| Panama | 8 | 1.0% |
| Philippines | 52 | 6.4% |
| South Eastern Asia | 52 | 6.4% | View All 16 Rows |
Sex and Age in Denali Park
Sex and Age in Denali Park
The most populous age groups in Denali Park are 40 to 44 Years (382 | 57.0%) for men and 25 to 29 Years (32 | 21.8%) for women.
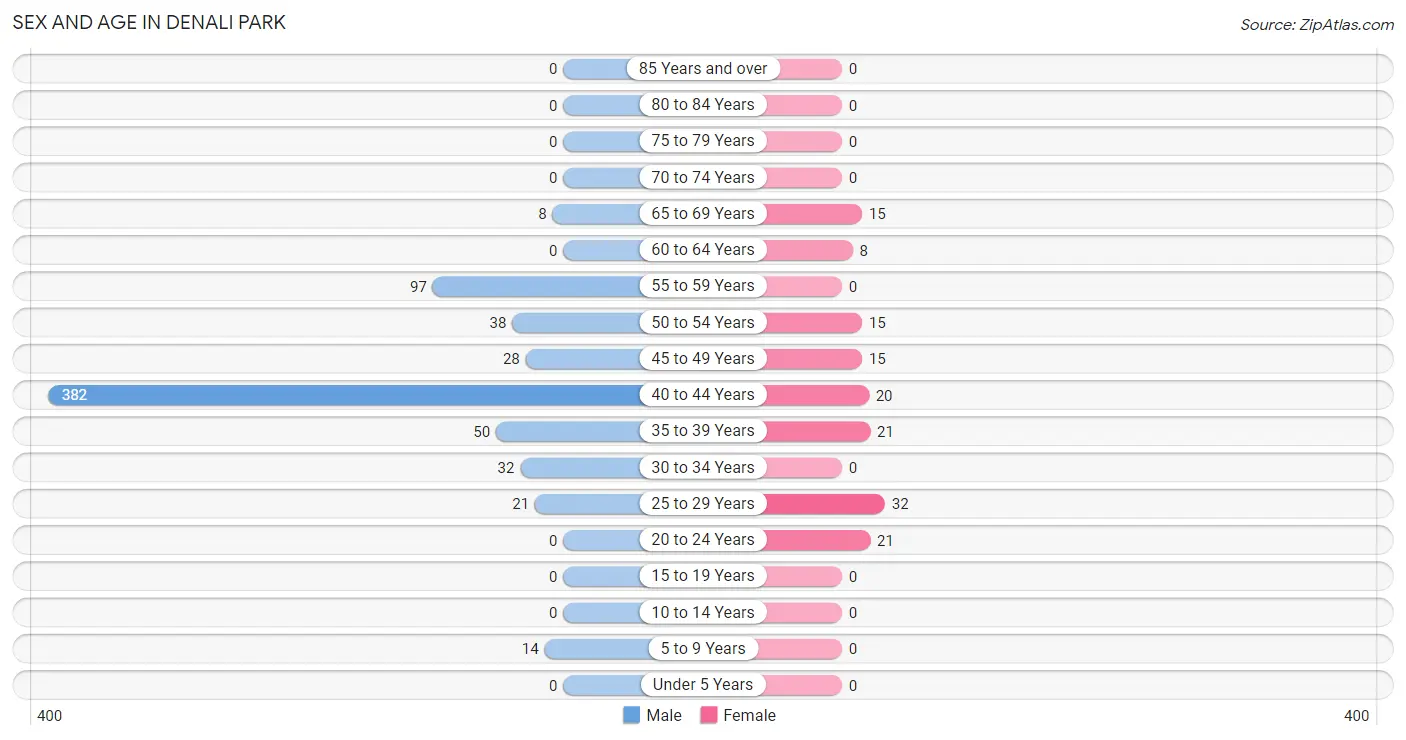
| Age Bracket | Male | Female |
| Under 5 Years | 0 (0.0%) | 0 (0.0%) |
| 5 to 9 Years | 14 (2.1%) | 0 (0.0%) |
| 10 to 14 Years | 0 (0.0%) | 0 (0.0%) |
| 15 to 19 Years | 0 (0.0%) | 0 (0.0%) |
| 20 to 24 Years | 0 (0.0%) | 21 (14.3%) |
| 25 to 29 Years | 21 (3.1%) | 32 (21.8%) |
| 30 to 34 Years | 32 (4.8%) | 0 (0.0%) |
| 35 to 39 Years | 50 (7.5%) | 21 (14.3%) |
| 40 to 44 Years | 382 (57.0%) | 20 (13.6%) |
| 45 to 49 Years | 28 (4.2%) | 15 (10.2%) |
| 50 to 54 Years | 38 (5.7%) | 15 (10.2%) |
| 55 to 59 Years | 97 (14.5%) | 0 (0.0%) |
| 60 to 64 Years | 0 (0.0%) | 8 (5.4%) |
| 65 to 69 Years | 8 (1.2%) | 15 (10.2%) |
| 70 to 74 Years | 0 (0.0%) | 0 (0.0%) |
| 75 to 79 Years | 0 (0.0%) | 0 (0.0%) |
| 80 to 84 Years | 0 (0.0%) | 0 (0.0%) |
| 85 Years and over | 0 (0.0%) | 0 (0.0%) |
| Total | 670 (100.0%) | 147 (100.0%) |
Families and Households in Denali Park
Median Family Size in Denali Park
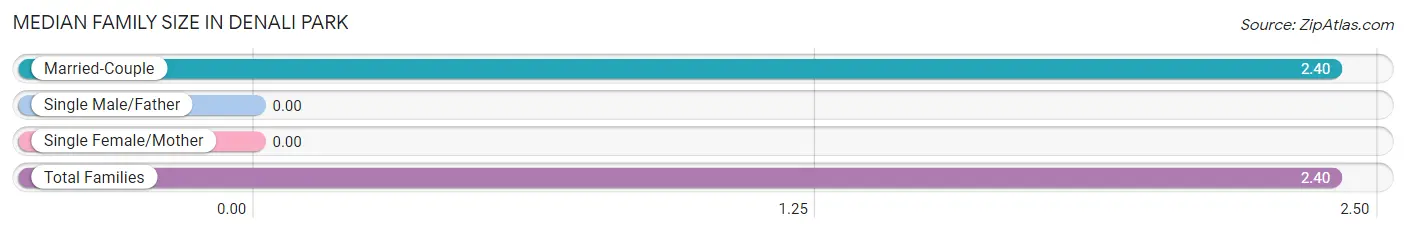
| Family Type | # Families | Family Size |
| Married-Couple | 25 (100.0%) | 2.40 |
| Single Male/Father | 0 (0.0%) | - |
| Single Female/Mother | 0 (0.0%) | - |
| Total Families | 25 (100.0%) | 2.40 |
Median Household Size in Denali Park
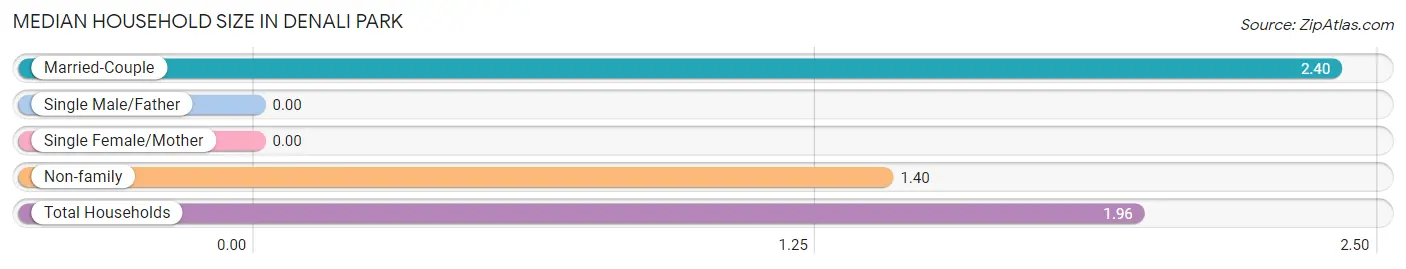
| Household Type | # Households | Household Size |
| Married-Couple | 25 (55.6%) | 2.40 |
| Single Male/Father | 0 (0.0%) | - |
| Single Female/Mother | 0 (0.0%) | - |
| Non-family | 20 (44.4%) | 1.40 |
| Total Households | 45 (100.0%) | 1.96 |
Household Size by Marriage Status in Denali Park
Out of a total of 45 households in Denali Park, 25 (55.6%) are family households, while 20 (44.4%) are nonfamily households. The most numerous type of family households are 2-person households, comprising 16, and the most common type of nonfamily households are 1-person households, comprising 12.
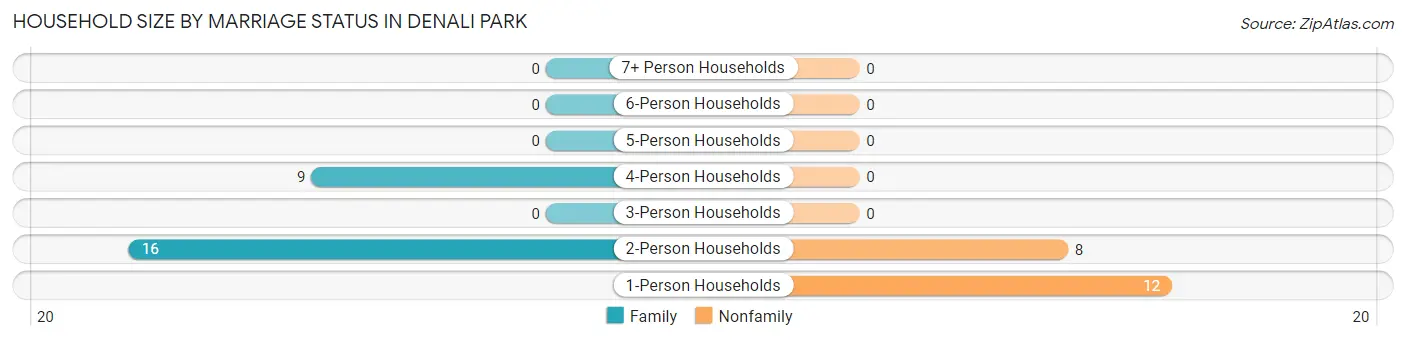
| Household Size | Family Households | Nonfamily Households |
| 1-Person Households | - | 12 (26.7%) |
| 2-Person Households | 16 (35.6%) | 8 (17.8%) |
| 3-Person Households | 0 (0.0%) | 0 (0.0%) |
| 4-Person Households | 9 (20.0%) | 0 (0.0%) |
| 5-Person Households | 0 (0.0%) | 0 (0.0%) |
| 6-Person Households | 0 (0.0%) | 0 (0.0%) |
| 7+ Person Households | 0 (0.0%) | 0 (0.0%) |
| Total | 25 (55.6%) | 20 (44.4%) |
Female Fertility in Denali Park
Fertility by Age in Denali Park
Average fertility rate in Denali Park is 121.0 births per 1,000 women. Women in the age bracket of 20 to 34 years have the highest fertility rate with 283.0 births per 1,000 women. Women in the age bracket of 20 to 34 years acount for 100.0% of all women with births.
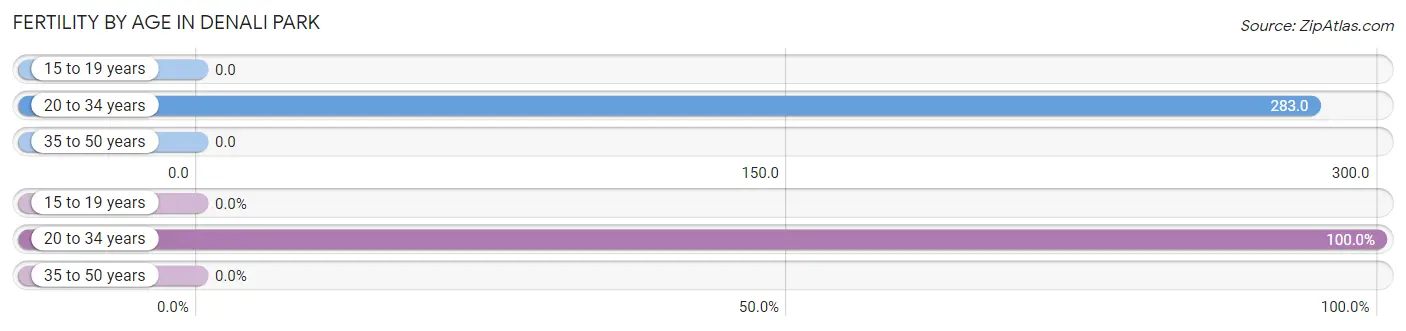
| Age Bracket | Women with Births | Births / 1,000 Women |
| 15 to 19 years | 0 (0.0%) | 0.0 |
| 20 to 34 years | 15 (100.0%) | 283.0 |
| 35 to 50 years | 0 (0.0%) | 0.0 |
| Total | 15 (100.0%) | 121.0 |
Fertility by Age by Marriage Status in Denali Park
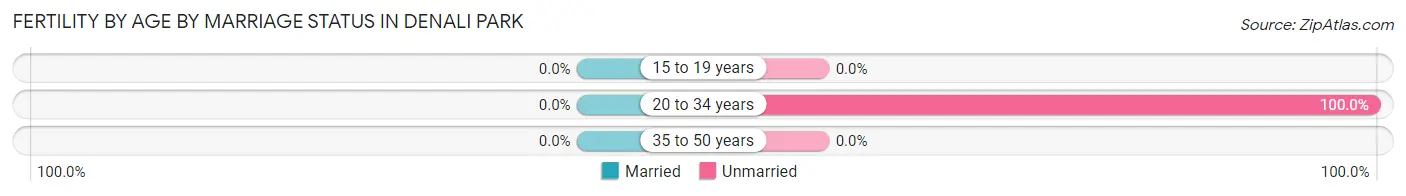
| Age Bracket | Married | Unmarried |
| 15 to 19 years | 0 (0.0%) | 0 (0.0%) |
| 20 to 34 years | 0 (0.0%) | 15 (100.0%) |
| 35 to 50 years | 0 (0.0%) | 0 (0.0%) |
| Total | 0 (0.0%) | 15 (100.0%) |
Fertility by Education in Denali Park
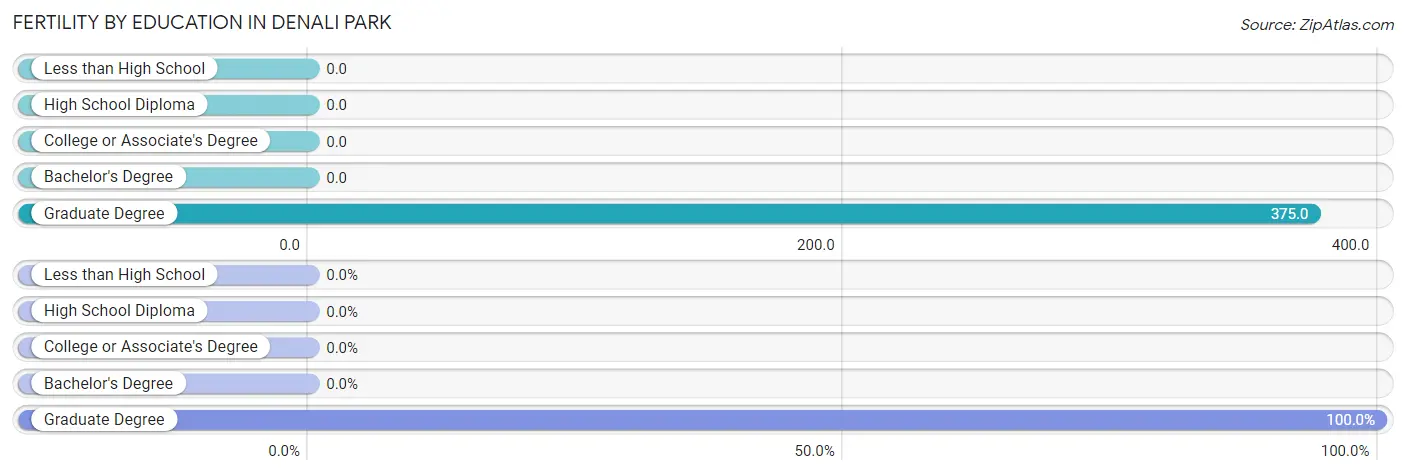
| Educational Attainment | Women with Births | Births / 1,000 Women |
| Less than High School | 0 (0.0%) | 0.0 |
| High School Diploma | 0 (0.0%) | 0.0 |
| College or Associate's Degree | 0 (0.0%) | 0.0 |
| Bachelor's Degree | 0 (0.0%) | 0.0 |
| Graduate Degree | 15 (100.0%) | 375.0 |
| Total | 15 (100.0%) | 121.0 |
Fertility by Education by Marriage Status in Denali Park
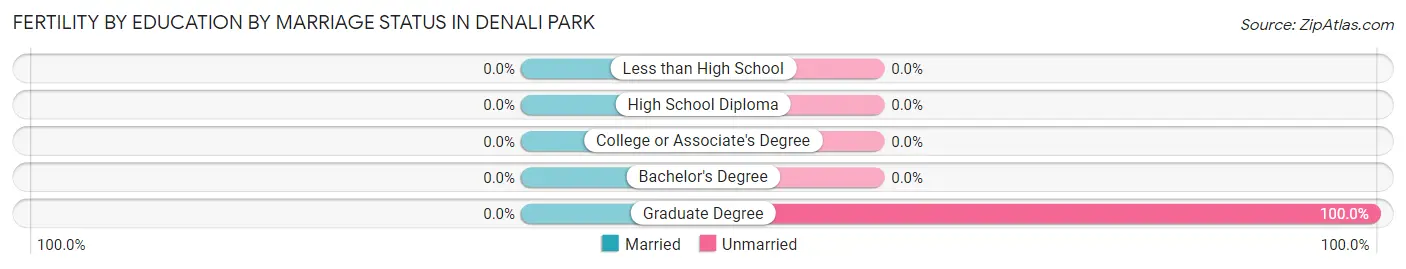
| Educational Attainment | Married | Unmarried |
| Less than High School | 0 (0.0%) | 0 (0.0%) |
| High School Diploma | 0 (0.0%) | 0 (0.0%) |
| College or Associate's Degree | 0 (0.0%) | 0 (0.0%) |
| Bachelor's Degree | 0 (0.0%) | 0 (0.0%) |
| Graduate Degree | 0 (0.0%) | 15 (100.0%) |
| Total | 0 (0.0%) | 15 (100.0%) |
Employment Characteristics in Denali Park
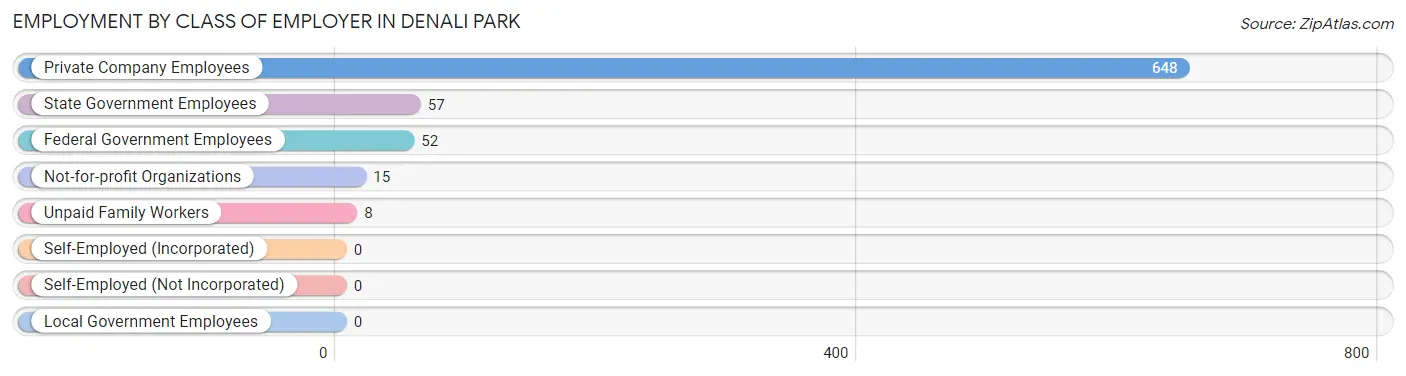
Employment by Class of Employer in Denali Park
Among the 780 employed individuals in Denali Park, private company employees (648 | 83.1%), state government employees (57 | 7.3%), and federal government employees (52 | 6.7%) make up the most common classes of employment.
| Employer Class | # Employees | % Employees |
| Private Company Employees | 648 | 83.1% |
| Self-Employed (Incorporated) | 0 | 0.0% |
| Self-Employed (Not Incorporated) | 0 | 0.0% |
| Not-for-profit Organizations | 15 | 1.9% |
| Local Government Employees | 0 | 0.0% |
| State Government Employees | 57 | 7.3% |
| Federal Government Employees | 52 | 6.7% |
| Unpaid Family Workers | 8 | 1.0% |
| Total | 780 | 100.0% |
Employment Status by Age in Denali Park
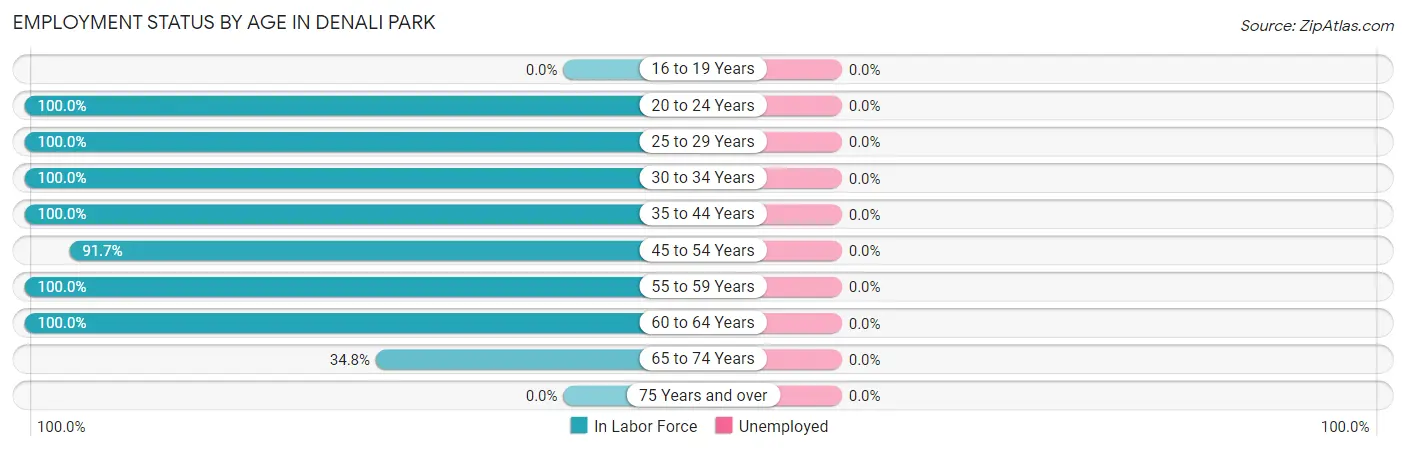
| Age Bracket | In Labor Force | Unemployed |
| 16 to 19 Years | 0 (0.0%) | 0 (0.0%) |
| 20 to 24 Years | 21 (100.0%) | 0 (0.0%) |
| 25 to 29 Years | 53 (100.0%) | 0 (0.0%) |
| 30 to 34 Years | 32 (100.0%) | 0 (0.0%) |
| 35 to 44 Years | 473 (100.0%) | 0 (0.0%) |
| 45 to 54 Years | 88 (91.7%) | 0 (0.0%) |
| 55 to 59 Years | 97 (100.0%) | 0 (0.0%) |
| 60 to 64 Years | 8 (100.0%) | 0 (0.0%) |
| 65 to 74 Years | 8 (34.8%) | 0 (0.0%) |
| 75 Years and over | 0 (0.0%) | 0 (0.0%) |
| Total | 780 (97.1%) | 0 (0.0%) |
Employment Status by Educational Attainment in Denali Park
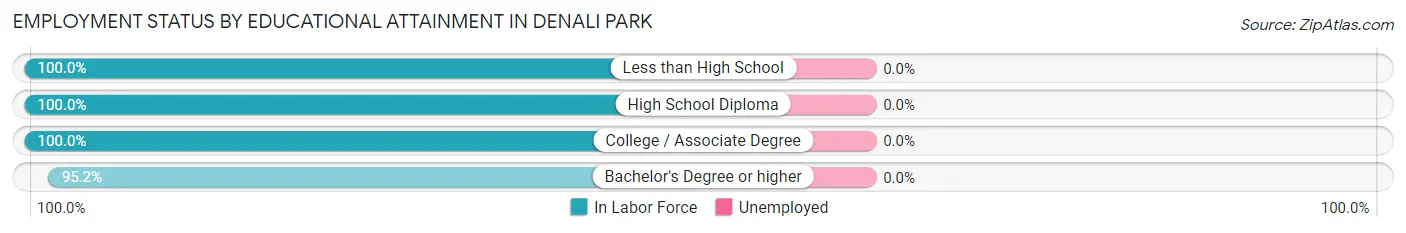
| Educational Attainment | In Labor Force | Unemployed |
| Less than High School | 15 (100.0%) | 0 (0.0%) |
| High School Diploma | 491 (100.0%) | 0 (0.0%) |
| College / Associate Degree | 87 (100.0%) | 0 (0.0%) |
| Bachelor's Degree or higher | 158 (95.2%) | 0 (0.0%) |
| Total | 751 (98.9%) | 0 (0.0%) |
Employment Occupations by Sex in Denali Park
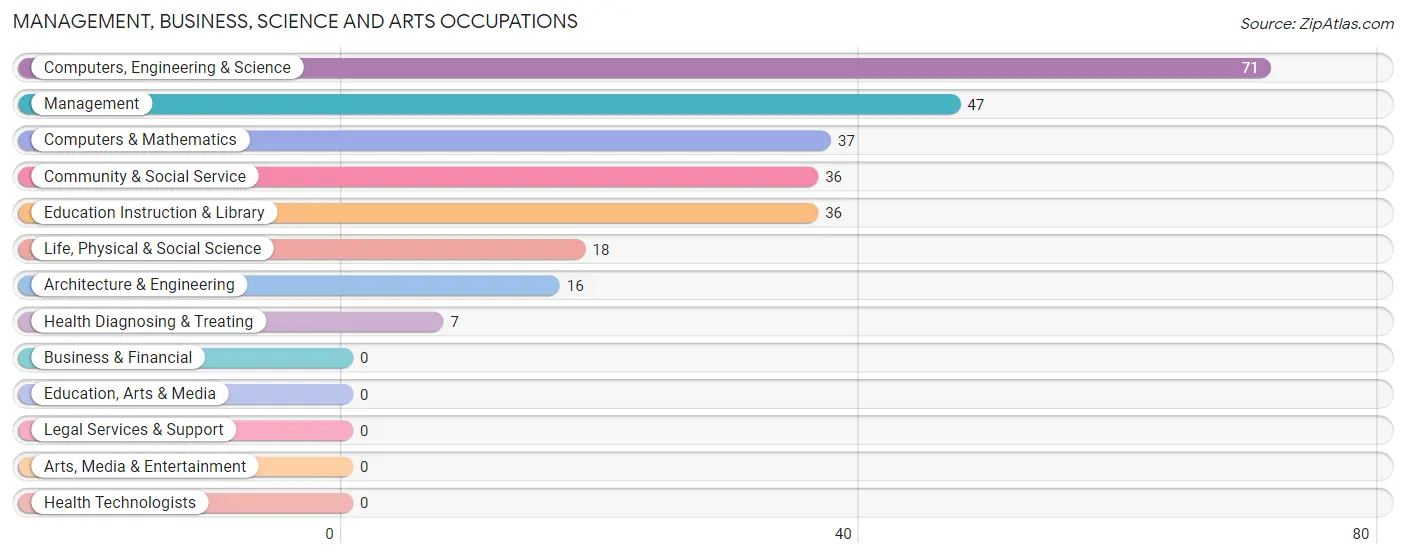
Management, Business, Science and Arts Occupations
The most common Management, Business, Science and Arts occupations in Denali Park are Computers, Engineering & Science (71 | 9.1%), Management (47 | 6.0%), Computers & Mathematics (37 | 4.7%), Community & Social Service (36 | 4.6%), and Education Instruction & Library (36 | 4.6%).
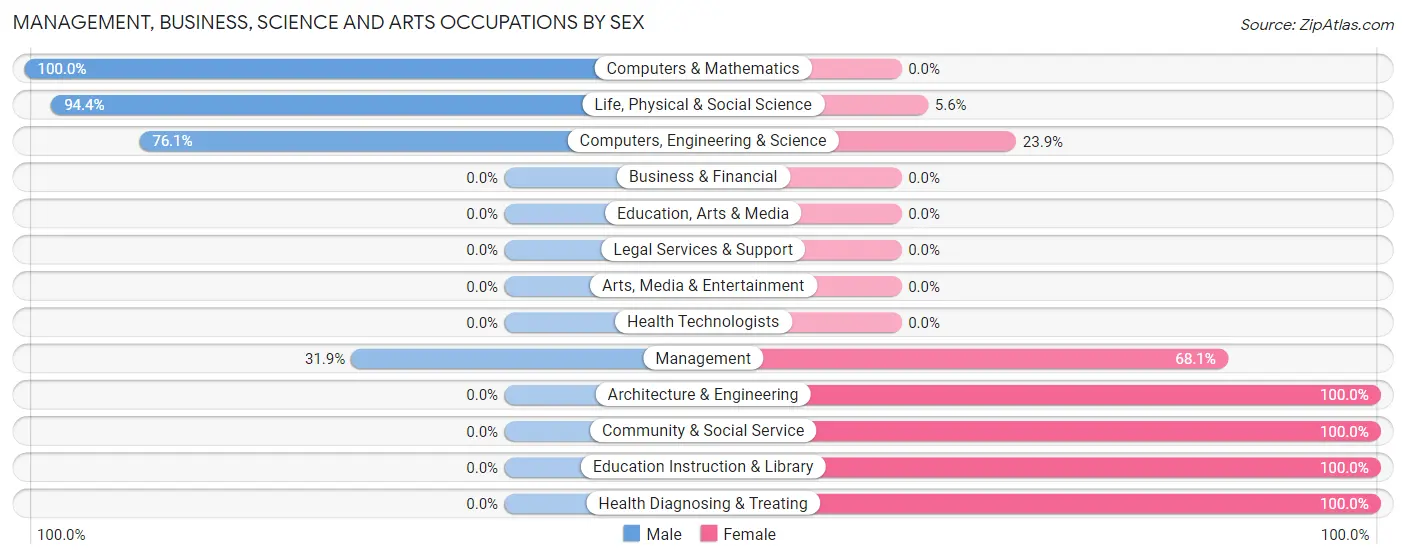
Management, Business, Science and Arts Occupations by Sex
Within the Management, Business, Science and Arts occupations in Denali Park, the most male-oriented occupations are Computers & Mathematics (100.0%), Life, Physical & Social Science (94.4%), and Computers, Engineering & Science (76.1%), while the most female-oriented occupations are Architecture & Engineering (100.0%), Community & Social Service (100.0%), and Education Instruction & Library (100.0%).
| Occupation | Male | Female |
| Management | 15 (31.9%) | 32 (68.1%) |
| Business & Financial | 0 (0.0%) | 0 (0.0%) |
| Computers, Engineering & Science | 54 (76.1%) | 17 (23.9%) |
| Computers & Mathematics | 37 (100.0%) | 0 (0.0%) |
| Architecture & Engineering | 0 (0.0%) | 16 (100.0%) |
| Life, Physical & Social Science | 17 (94.4%) | 1 (5.6%) |
| Community & Social Service | 0 (0.0%) | 36 (100.0%) |
| Education, Arts & Media | 0 (0.0%) | 0 (0.0%) |
| Legal Services & Support | 0 (0.0%) | 0 (0.0%) |
| Education Instruction & Library | 0 (0.0%) | 36 (100.0%) |
| Arts, Media & Entertainment | 0 (0.0%) | 0 (0.0%) |
| Health Diagnosing & Treating | 0 (0.0%) | 7 (100.0%) |
| Health Technologists | 0 (0.0%) | 0 (0.0%) |
| Total (Category) | 69 (42.9%) | 92 (57.1%) |
| Total (Overall) | 648 (83.1%) | 132 (16.9%) |
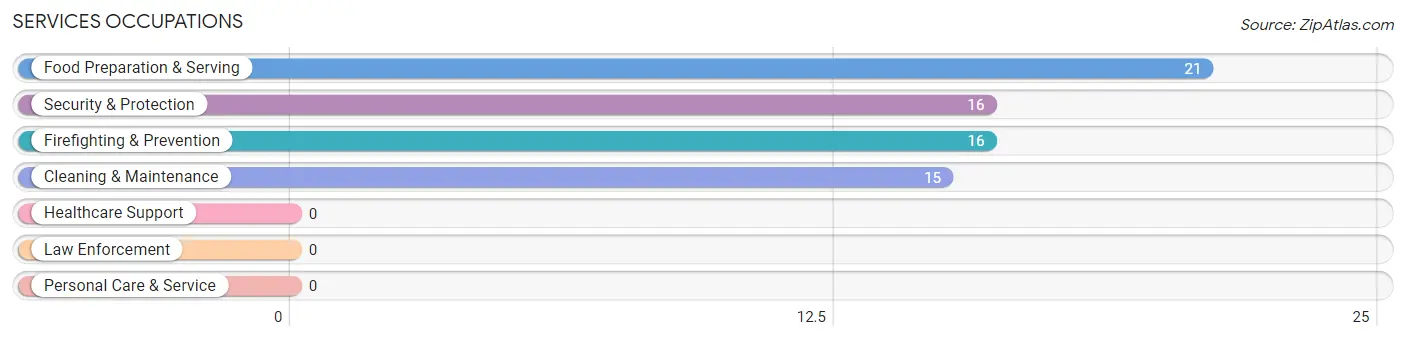
Services Occupations
The most common Services occupations in Denali Park are Food Preparation & Serving (21 | 2.7%), Security & Protection (16 | 2.1%), Firefighting & Prevention (16 | 2.1%), and Cleaning & Maintenance (15 | 1.9%).
Services Occupations by Sex
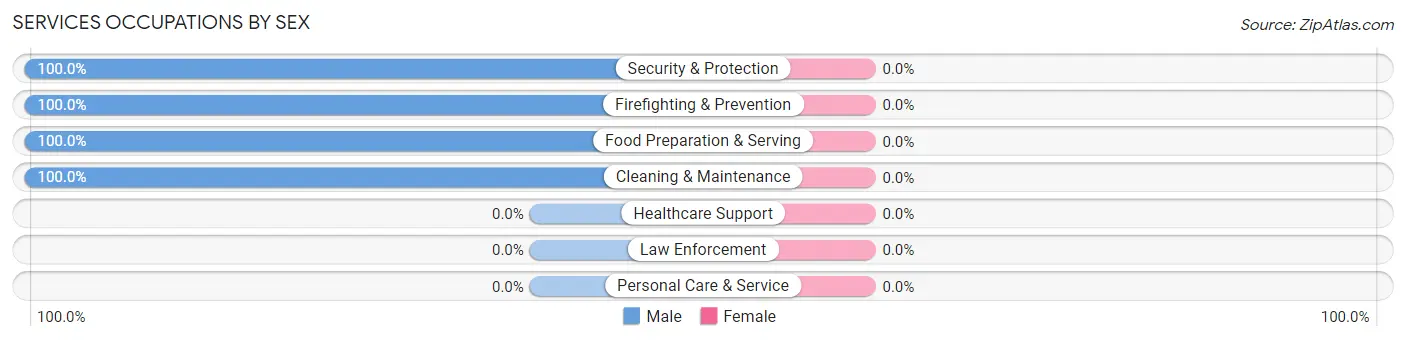
| Occupation | Male | Female |
| Healthcare Support | 0 (0.0%) | 0 (0.0%) |
| Security & Protection | 16 (100.0%) | 0 (0.0%) |
| Firefighting & Prevention | 16 (100.0%) | 0 (0.0%) |
| Law Enforcement | 0 (0.0%) | 0 (0.0%) |
| Food Preparation & Serving | 21 (100.0%) | 0 (0.0%) |
| Cleaning & Maintenance | 15 (100.0%) | 0 (0.0%) |
| Personal Care & Service | 0 (0.0%) | 0 (0.0%) |
| Total (Category) | 52 (100.0%) | 0 (0.0%) |
| Total (Overall) | 648 (83.1%) | 132 (16.9%) |
Sales and Office Occupations
The most common Sales and Office occupations in Denali Park are Office & Administration (11 | 1.4%), and Sales & Related (8 | 1.0%).
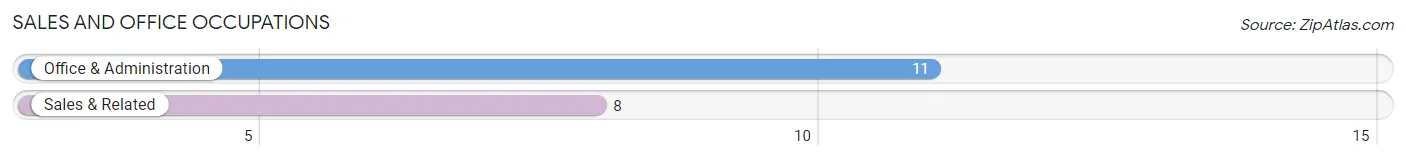
Sales and Office Occupations by Sex
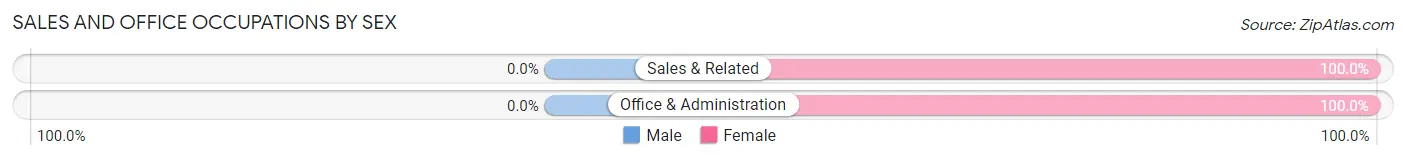
| Occupation | Male | Female |
| Sales & Related | 0 (0.0%) | 8 (100.0%) |
| Office & Administration | 0 (0.0%) | 11 (100.0%) |
| Total (Category) | 0 (0.0%) | 19 (100.0%) |
| Total (Overall) | 648 (83.1%) | 132 (16.9%) |
Natural Resources, Construction and Maintenance Occupations
The most common Natural Resources, Construction and Maintenance occupations in Denali Park are Construction & Extraction (439 | 56.3%), and Installation, Maintenance & Repair (23 | 2.9%).
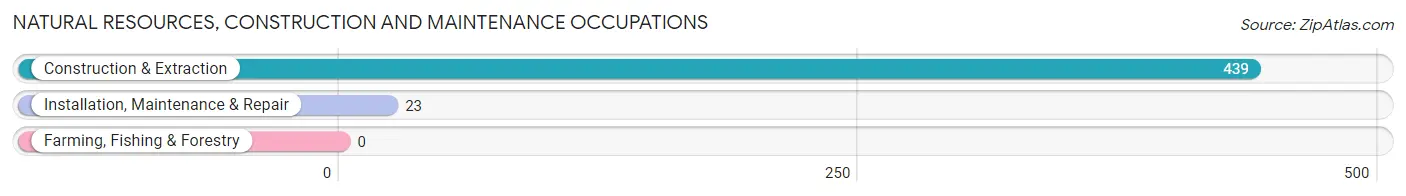
Natural Resources, Construction and Maintenance Occupations by Sex
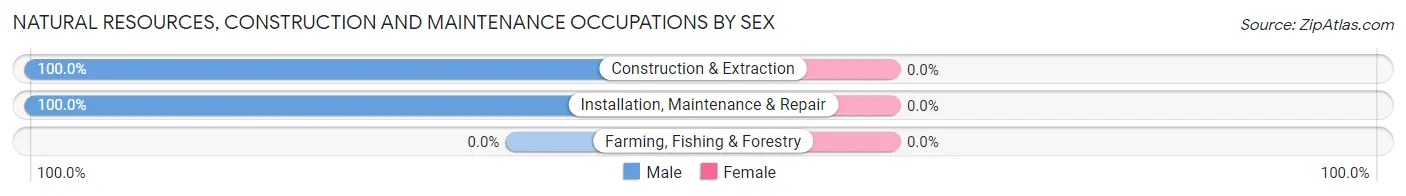
| Occupation | Male | Female |
| Farming, Fishing & Forestry | 0 (0.0%) | 0 (0.0%) |
| Construction & Extraction | 439 (100.0%) | 0 (0.0%) |
| Installation, Maintenance & Repair | 23 (100.0%) | 0 (0.0%) |
| Total (Category) | 462 (100.0%) | 0 (0.0%) |
| Total (Overall) | 648 (83.1%) | 132 (16.9%) |
Production, Transportation and Moving Occupations
The most common Production, Transportation and Moving occupations in Denali Park are , and Production (86 | 11.0%).
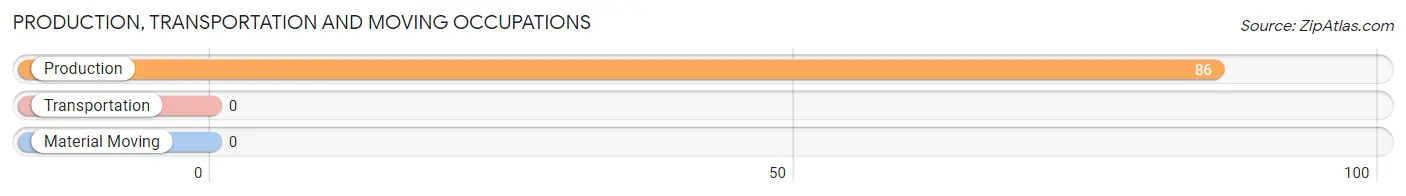
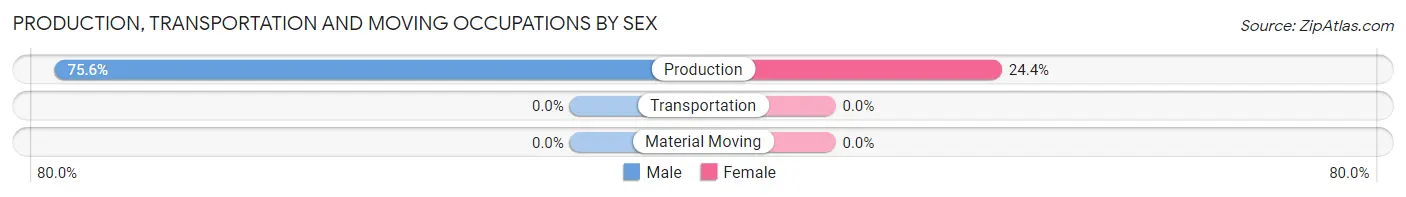
Production, Transportation and Moving Occupations by Sex
| Occupation | Male | Female |
| Production | 65 (75.6%) | 21 (24.4%) |
| Transportation | 0 (0.0%) | 0 (0.0%) |
| Material Moving | 0 (0.0%) | 0 (0.0%) |
| Total (Category) | 65 (75.6%) | 21 (24.4%) |
| Total (Overall) | 648 (83.1%) | 132 (16.9%) |
Employment Industries by Sex in Denali Park
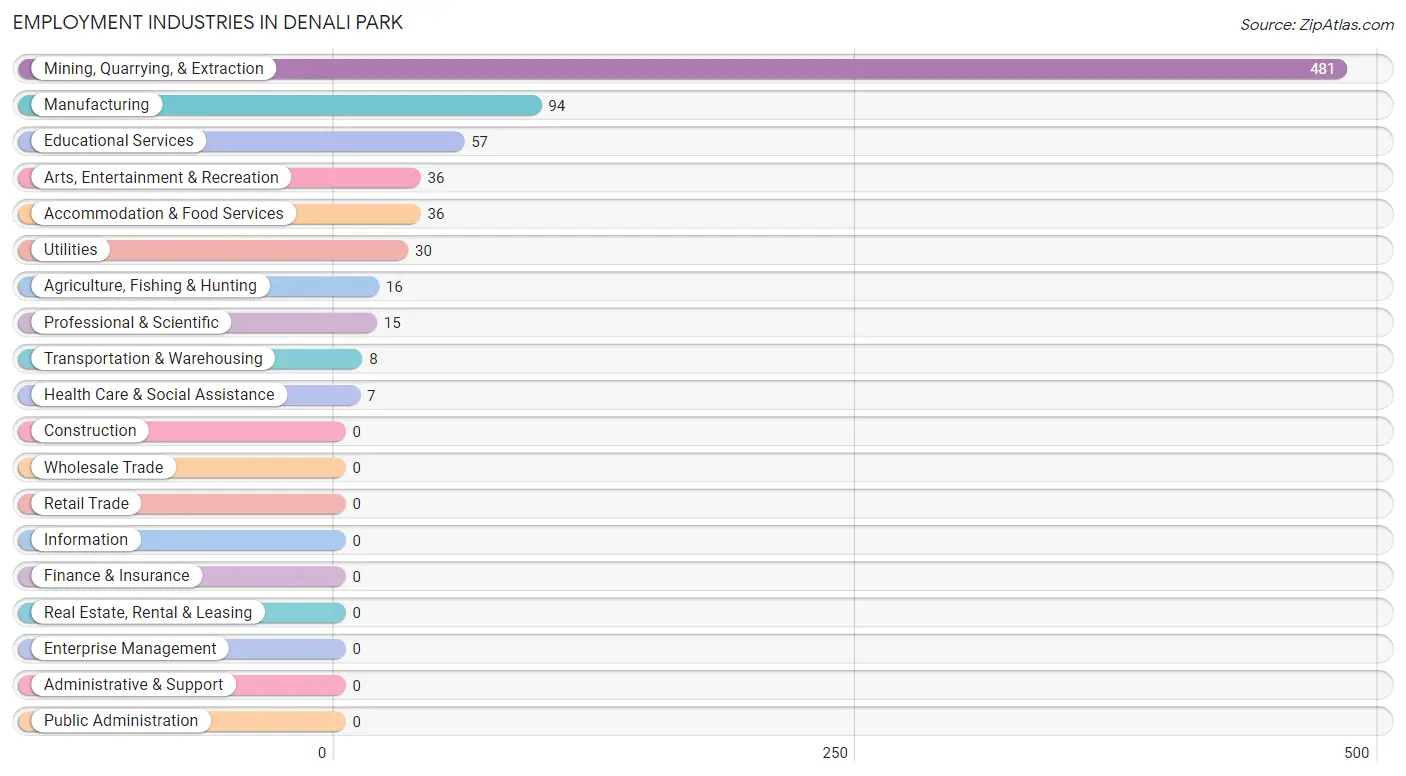
Employment Industries in Denali Park
The major employment industries in Denali Park include Mining, Quarrying, & Extraction (481 | 61.7%), Manufacturing (94 | 12.0%), Educational Services (57 | 7.3%), Arts, Entertainment & Recreation (36 | 4.6%), and Accommodation & Food Services (36 | 4.6%).
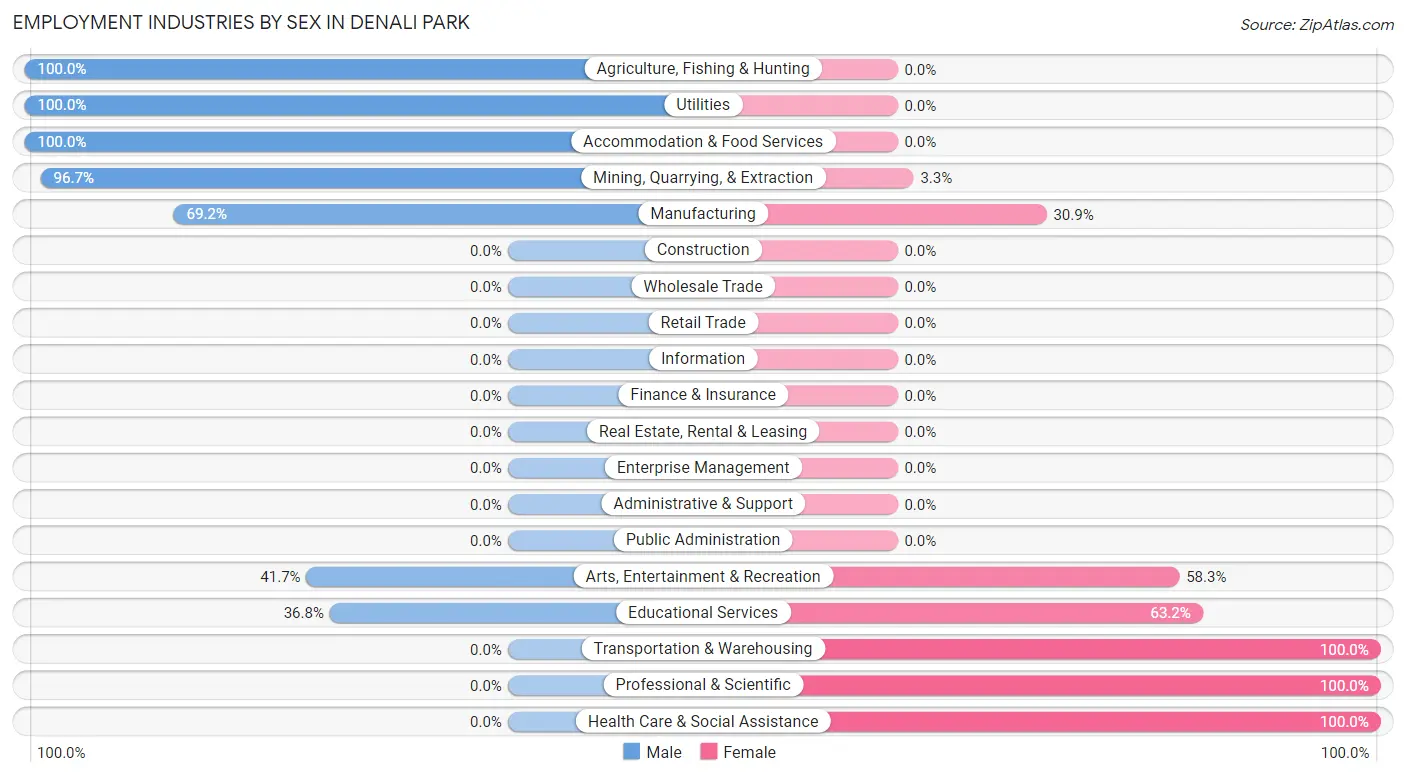
Employment Industries by Sex in Denali Park
The Denali Park industries that see more men than women are Agriculture, Fishing & Hunting (100.0%), Utilities (100.0%), and Accommodation & Food Services (100.0%), whereas the industries that tend to have a higher number of women are Transportation & Warehousing (100.0%), Professional & Scientific (100.0%), and Health Care & Social Assistance (100.0%).
| Industry | Male | Female |
| Agriculture, Fishing & Hunting | 16 (100.0%) | 0 (0.0%) |
| Mining, Quarrying, & Extraction | 465 (96.7%) | 16 (3.3%) |
| Construction | 0 (0.0%) | 0 (0.0%) |
| Manufacturing | 65 (69.2%) | 29 (30.8%) |
| Wholesale Trade | 0 (0.0%) | 0 (0.0%) |
| Retail Trade | 0 (0.0%) | 0 (0.0%) |
| Transportation & Warehousing | 0 (0.0%) | 8 (100.0%) |
| Utilities | 30 (100.0%) | 0 (0.0%) |
| Information | 0 (0.0%) | 0 (0.0%) |
| Finance & Insurance | 0 (0.0%) | 0 (0.0%) |
| Real Estate, Rental & Leasing | 0 (0.0%) | 0 (0.0%) |
| Professional & Scientific | 0 (0.0%) | 15 (100.0%) |
| Enterprise Management | 0 (0.0%) | 0 (0.0%) |
| Administrative & Support | 0 (0.0%) | 0 (0.0%) |
| Educational Services | 21 (36.8%) | 36 (63.2%) |
| Health Care & Social Assistance | 0 (0.0%) | 7 (100.0%) |
| Arts, Entertainment & Recreation | 15 (41.7%) | 21 (58.3%) |
| Accommodation & Food Services | 36 (100.0%) | 0 (0.0%) |
| Public Administration | 0 (0.0%) | 0 (0.0%) |
| Total | 648 (83.1%) | 132 (16.9%) |
Education in Denali Park
School Enrollment in Denali Park
The most common levels of schooling among the 56 students in Denali Park are college / undergraduate (42 | 75.0%), kindergarten (7 | 12.5%), and elementary school (7 | 12.5%).
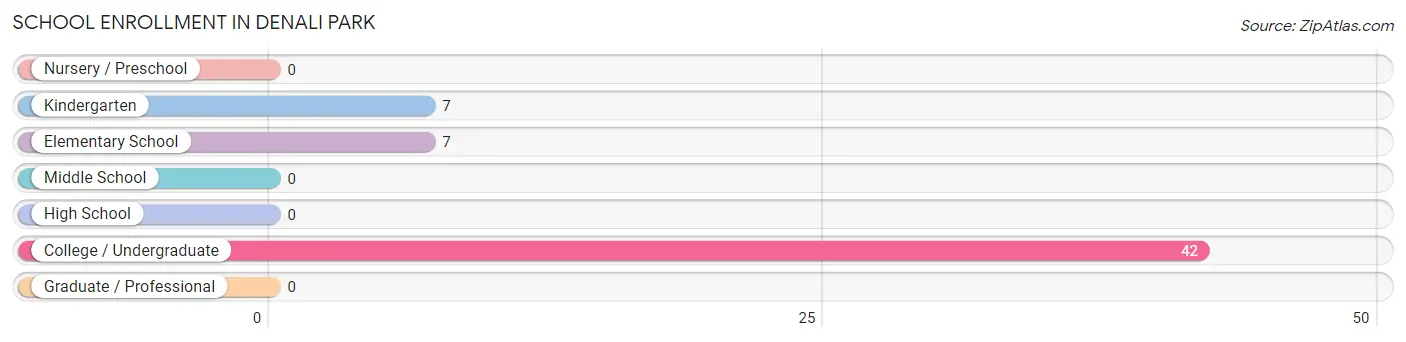
| School Level | # Students | % Students |
| Nursery / Preschool | 0 | 0.0% |
| Kindergarten | 7 | 12.5% |
| Elementary School | 7 | 12.5% |
| Middle School | 0 | 0.0% |
| High School | 0 | 0.0% |
| College / Undergraduate | 42 | 75.0% |
| Graduate / Professional | 0 | 0.0% |
| Total | 56 | 100.0% |
School Enrollment by Age by Funding Source in Denali Park
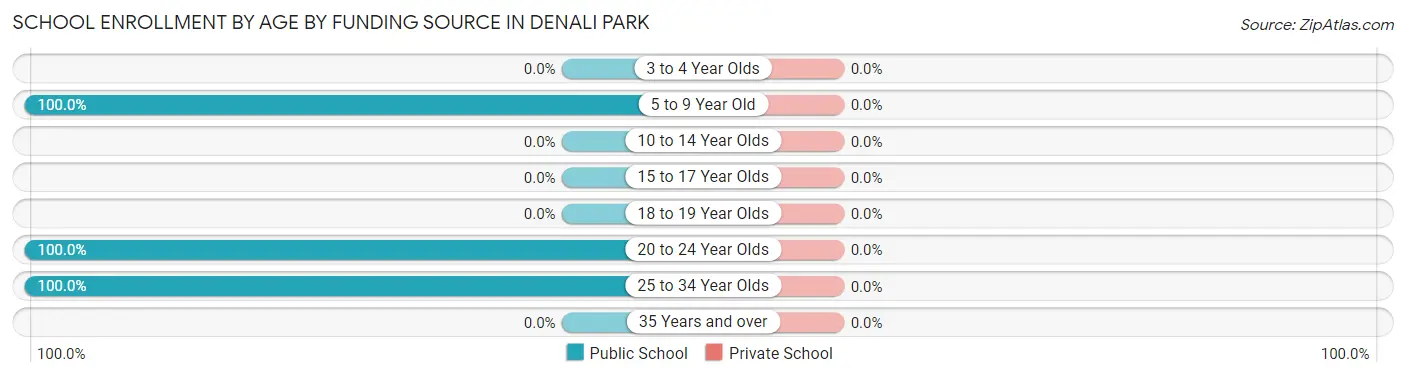
| Age Bracket | Public School | Private School |
| 3 to 4 Year Olds | 0 (0.0%) | 0 (0.0%) |
| 5 to 9 Year Old | 14 (100.0%) | 0 (0.0%) |
| 10 to 14 Year Olds | 0 (0.0%) | 0 (0.0%) |
| 15 to 17 Year Olds | 0 (0.0%) | 0 (0.0%) |
| 18 to 19 Year Olds | 0 (0.0%) | 0 (0.0%) |
| 20 to 24 Year Olds | 21 (100.0%) | 0 (0.0%) |
| 25 to 34 Year Olds | 21 (100.0%) | 0 (0.0%) |
| 35 Years and over | 0 (0.0%) | 0 (0.0%) |
| Total | 56 (100.0%) | 0 (0.0%) |
Educational Attainment by Field of Study in Denali Park
Education (50 | 25.4%), bio, nature & agricultural (32 | 16.2%), engineering (24 | 12.2%), literature & languages (23 | 11.7%), and physical & health sciences (22 | 11.2%) are the most common fields of study among 197 individuals in Denali Park who have obtained a bachelor's degree or higher.
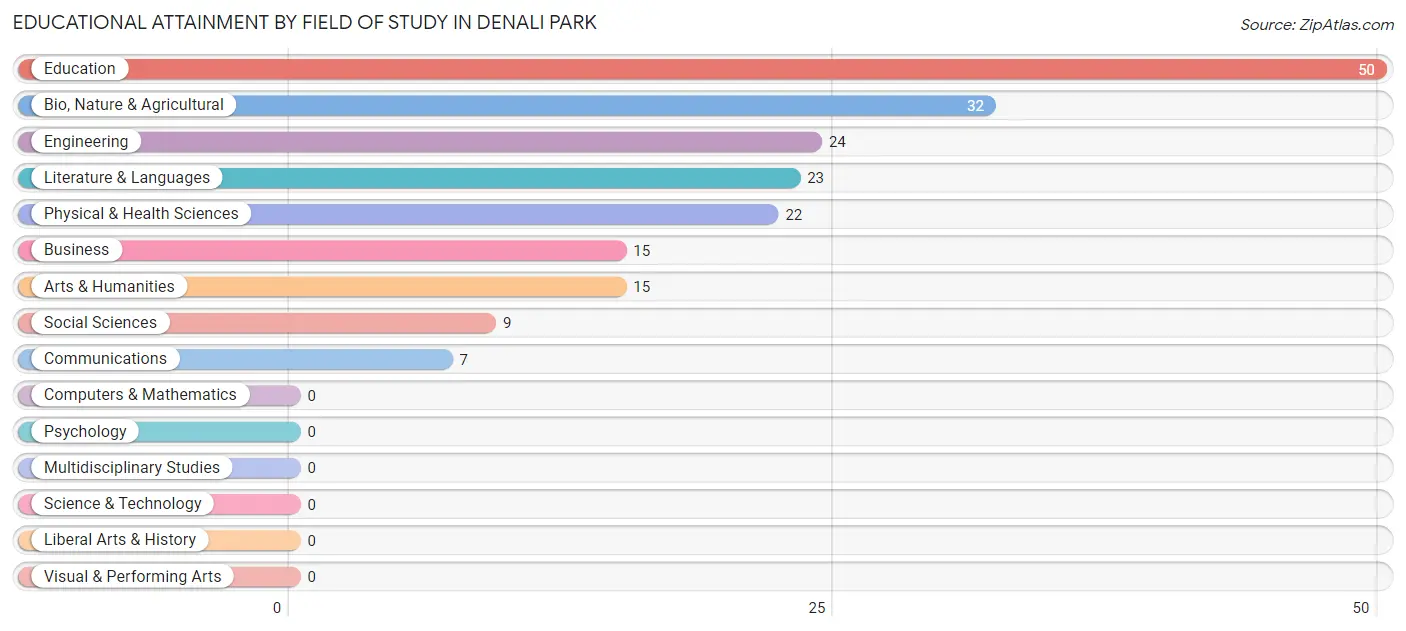
| Field of Study | # Graduates | % Graduates |
| Computers & Mathematics | 0 | 0.0% |
| Bio, Nature & Agricultural | 32 | 16.2% |
| Physical & Health Sciences | 22 | 11.2% |
| Psychology | 0 | 0.0% |
| Social Sciences | 9 | 4.6% |
| Engineering | 24 | 12.2% |
| Multidisciplinary Studies | 0 | 0.0% |
| Science & Technology | 0 | 0.0% |
| Business | 15 | 7.6% |
| Education | 50 | 25.4% |
| Literature & Languages | 23 | 11.7% |
| Liberal Arts & History | 0 | 0.0% |
| Visual & Performing Arts | 0 | 0.0% |
| Communications | 7 | 3.5% |
| Arts & Humanities | 15 | 7.6% |
| Total | 197 | 100.0% |
Transportation & Commute in Denali Park
Vehicle Availability by Sex in Denali Park
The most prevalent vehicle ownership categories in Denali Park are males with 2 vehicles (15, accounting for 100.0%) and females with 2 vehicles (17, making up 41.7%).
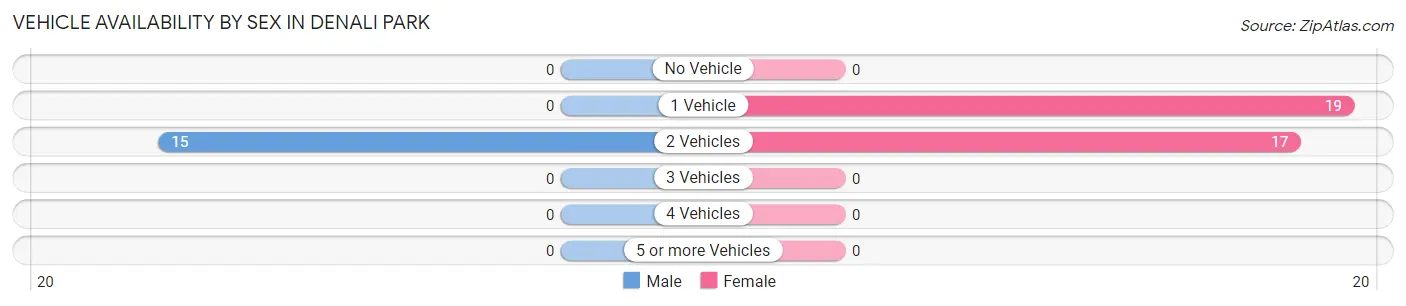
| Vehicles Available | Male | Female |
| No Vehicle | 0 (0.0%) | 0 (0.0%) |
| 1 Vehicle | 0 (0.0%) | 19 (52.8%) |
| 2 Vehicles | 15 (100.0%) | 17 (47.2%) |
| 3 Vehicles | 0 (0.0%) | 0 (0.0%) |
| 4 Vehicles | 0 (0.0%) | 0 (0.0%) |
| 5 or more Vehicles | 0 (0.0%) | 0 (0.0%) |
| Total | 15 (100.0%) | 36 (100.0%) |
Commute Time in Denali Park
The most frequently occuring commute durations in Denali Park are 20 to 24 minutes (359 commuters, 47.0%), 5 to 9 minutes (223 commuters, 29.2%), and 10 to 14 minutes (84 commuters, 11.0%).
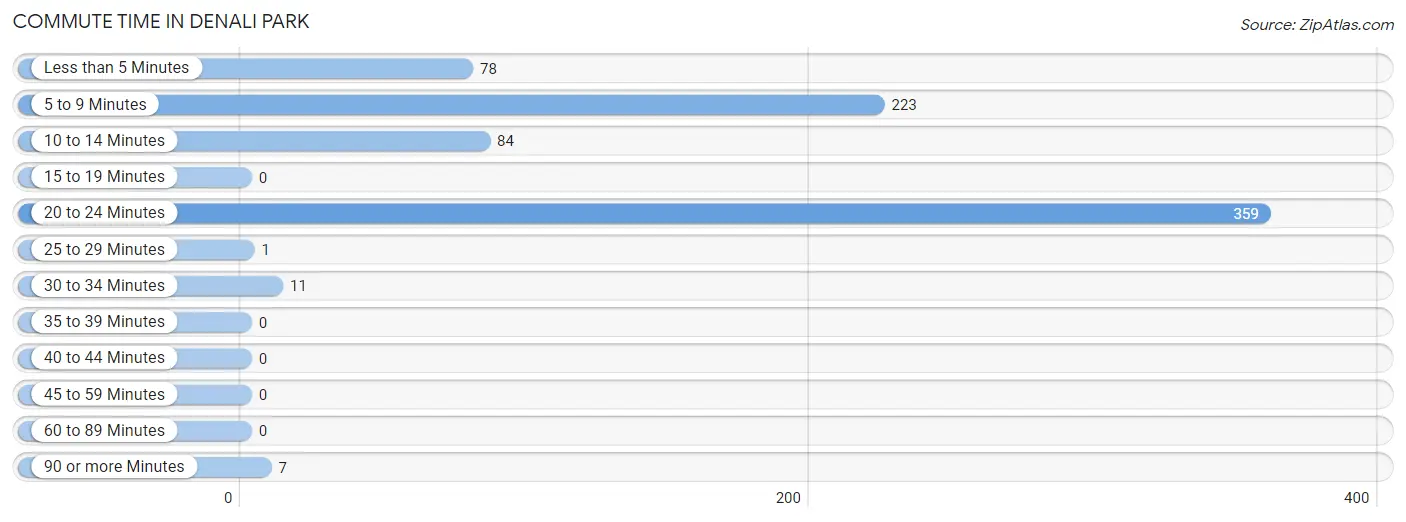
| Commute Time | # Commuters | % Commuters |
| Less than 5 Minutes | 78 | 10.2% |
| 5 to 9 Minutes | 223 | 29.2% |
| 10 to 14 Minutes | 84 | 11.0% |
| 15 to 19 Minutes | 0 | 0.0% |
| 20 to 24 Minutes | 359 | 47.0% |
| 25 to 29 Minutes | 1 | 0.1% |
| 30 to 34 Minutes | 11 | 1.4% |
| 35 to 39 Minutes | 0 | 0.0% |
| 40 to 44 Minutes | 0 | 0.0% |
| 45 to 59 Minutes | 0 | 0.0% |
| 60 to 89 Minutes | 0 | 0.0% |
| 90 or more Minutes | 7 | 0.9% |
Commute Time by Sex in Denali Park
The most common commute times in Denali Park are 20 to 24 minutes (359 commuters, 56.2%) for males and 5 to 9 minutes (37 commuters, 29.8%) for females.
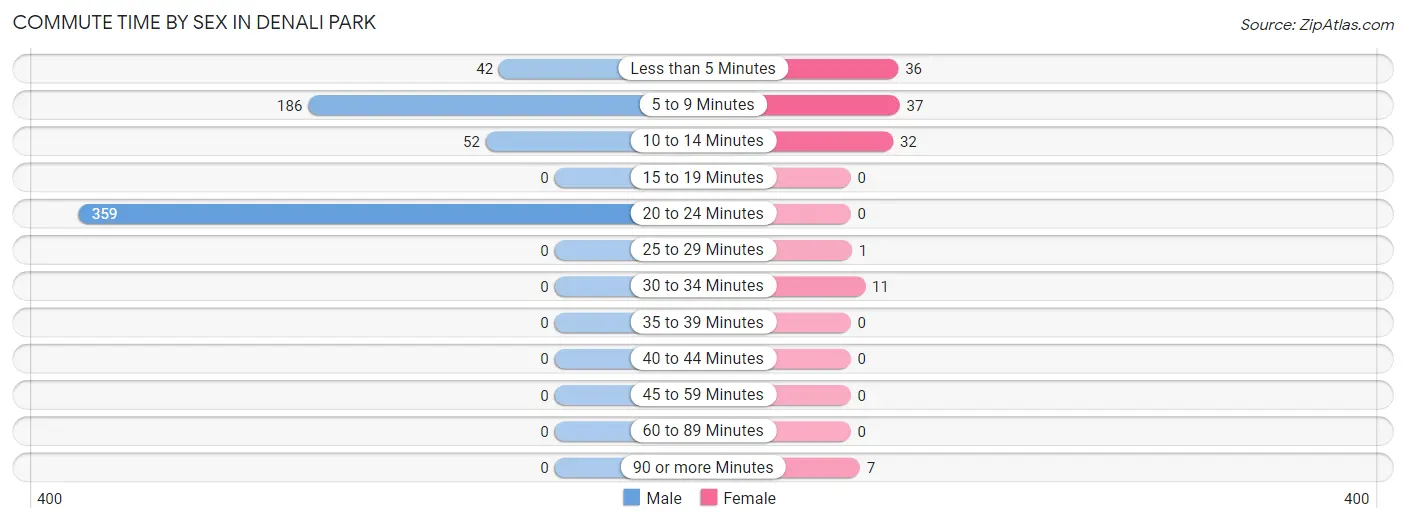
| Commute Time | Male | Female |
| Less than 5 Minutes | 42 (6.6%) | 36 (29.0%) |
| 5 to 9 Minutes | 186 (29.1%) | 37 (29.8%) |
| 10 to 14 Minutes | 52 (8.1%) | 32 (25.8%) |
| 15 to 19 Minutes | 0 (0.0%) | 0 (0.0%) |
| 20 to 24 Minutes | 359 (56.2%) | 0 (0.0%) |
| 25 to 29 Minutes | 0 (0.0%) | 1 (0.8%) |
| 30 to 34 Minutes | 0 (0.0%) | 11 (8.9%) |
| 35 to 39 Minutes | 0 (0.0%) | 0 (0.0%) |
| 40 to 44 Minutes | 0 (0.0%) | 0 (0.0%) |
| 45 to 59 Minutes | 0 (0.0%) | 0 (0.0%) |
| 60 to 89 Minutes | 0 (0.0%) | 0 (0.0%) |
| 90 or more Minutes | 0 (0.0%) | 7 (5.7%) |
Time of Departure to Work by Sex in Denali Park
The most frequent times of departure to work in Denali Park are 5:00 AM to 5:29 AM (423, 66.2%) for males and 5:30 AM to 5:59 AM (39, 31.5%) for females.
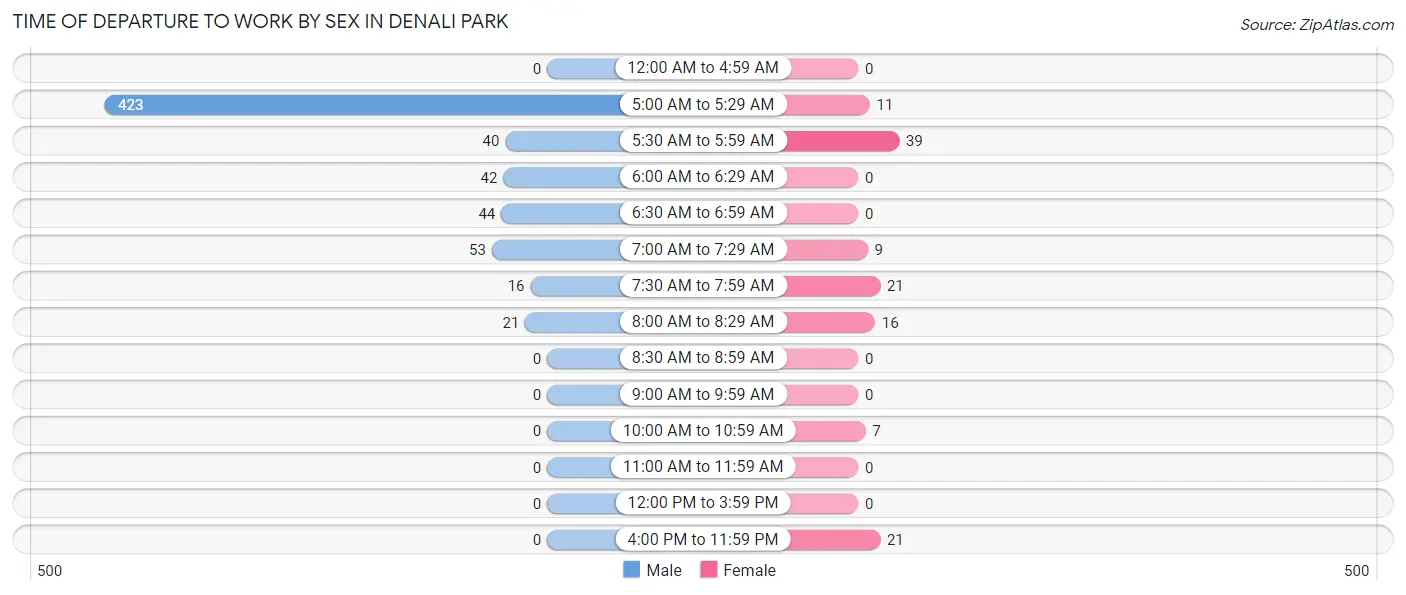
| Time of Departure | Male | Female |
| 12:00 AM to 4:59 AM | 0 (0.0%) | 0 (0.0%) |
| 5:00 AM to 5:29 AM | 423 (66.2%) | 11 (8.9%) |
| 5:30 AM to 5:59 AM | 40 (6.3%) | 39 (31.5%) |
| 6:00 AM to 6:29 AM | 42 (6.6%) | 0 (0.0%) |
| 6:30 AM to 6:59 AM | 44 (6.9%) | 0 (0.0%) |
| 7:00 AM to 7:29 AM | 53 (8.3%) | 9 (7.3%) |
| 7:30 AM to 7:59 AM | 16 (2.5%) | 21 (16.9%) |
| 8:00 AM to 8:29 AM | 21 (3.3%) | 16 (12.9%) |
| 8:30 AM to 8:59 AM | 0 (0.0%) | 0 (0.0%) |
| 9:00 AM to 9:59 AM | 0 (0.0%) | 0 (0.0%) |
| 10:00 AM to 10:59 AM | 0 (0.0%) | 7 (5.7%) |
| 11:00 AM to 11:59 AM | 0 (0.0%) | 0 (0.0%) |
| 12:00 PM to 3:59 PM | 0 (0.0%) | 0 (0.0%) |
| 4:00 PM to 11:59 PM | 0 (0.0%) | 21 (16.9%) |
| Total | 639 (100.0%) | 124 (100.0%) |
Housing Occupancy in Denali Park
Occupancy by Ownership in Denali Park
Of the total 45 dwellings in Denali Park, owner-occupied units account for 25 (55.6%), while renter-occupied units make up 20 (44.4%).
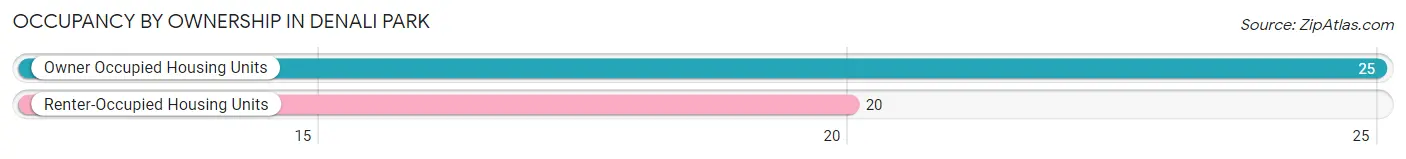
| Occupancy | # Housing Units | % Housing Units |
| Owner Occupied Housing Units | 25 | 55.6% |
| Renter-Occupied Housing Units | 20 | 44.4% |
| Total Occupied Housing Units | 45 | 100.0% |
Occupancy by Household Size in Denali Park
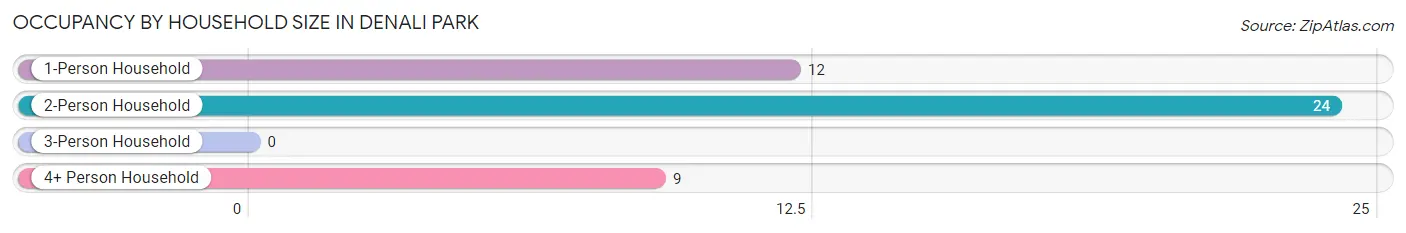
| Household Size | # Housing Units | % Housing Units |
| 1-Person Household | 12 | 26.7% |
| 2-Person Household | 24 | 53.3% |
| 3-Person Household | 0 | 0.0% |
| 4+ Person Household | 9 | 20.0% |
| Total Housing Units | 45 | 100.0% |
Occupancy by Ownership by Household Size in Denali Park
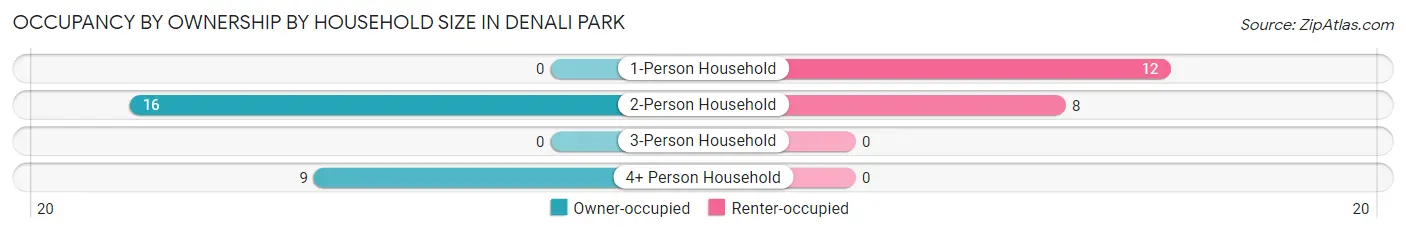
| Household Size | Owner-occupied | Renter-occupied |
| 1-Person Household | 0 (0.0%) | 12 (100.0%) |
| 2-Person Household | 16 (66.7%) | 8 (33.3%) |
| 3-Person Household | 0 (0.0%) | 0 (0.0%) |
| 4+ Person Household | 9 (100.0%) | 0 (0.0%) |
| Total Housing Units | 25 (55.6%) | 20 (44.4%) |
Occupancy by Educational Attainment in Denali Park
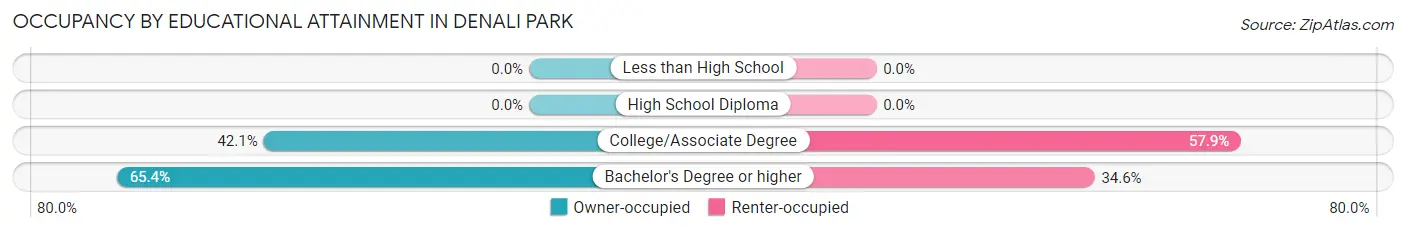
| Household Size | Owner-occupied | Renter-occupied |
| Less than High School | 0 (0.0%) | 0 (0.0%) |
| High School Diploma | 0 (0.0%) | 0 (0.0%) |
| College/Associate Degree | 8 (42.1%) | 11 (57.9%) |
| Bachelor's Degree or higher | 17 (65.4%) | 9 (34.6%) |
Occupancy by Age of Householder in Denali Park
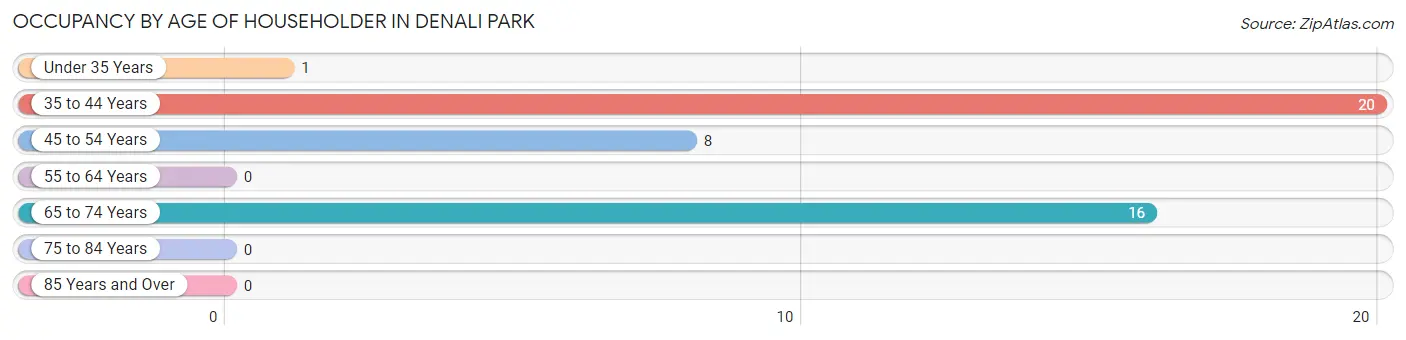
| Age Bracket | # Households | % Households |
| Under 35 Years | 1 | 2.2% |
| 35 to 44 Years | 20 | 44.4% |
| 45 to 54 Years | 8 | 17.8% |
| 55 to 64 Years | 0 | 0.0% |
| 65 to 74 Years | 16 | 35.6% |
| 75 to 84 Years | 0 | 0.0% |
| 85 Years and Over | 0 | 0.0% |
| Total | 45 | 100.0% |
Housing Finances in Denali Park
Median Income by Occupancy in Denali Park
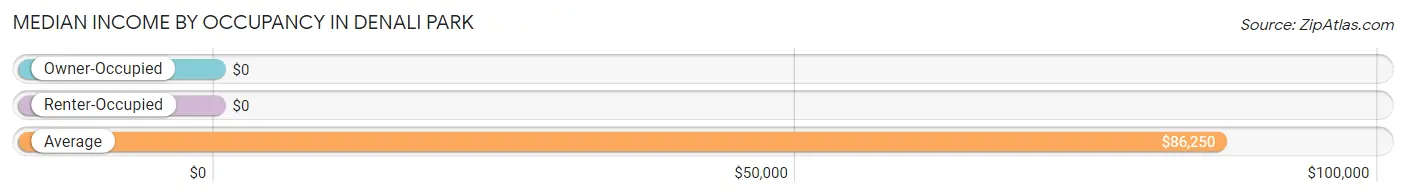
| Occupancy Type | # Households | Median Income |
| Owner-Occupied | 25 (55.6%) | $0 |
| Renter-Occupied | 20 (44.4%) | $0 |
| Average | 45 (100.0%) | $86,250 |
Occupancy by Householder Income Bracket in Denali Park
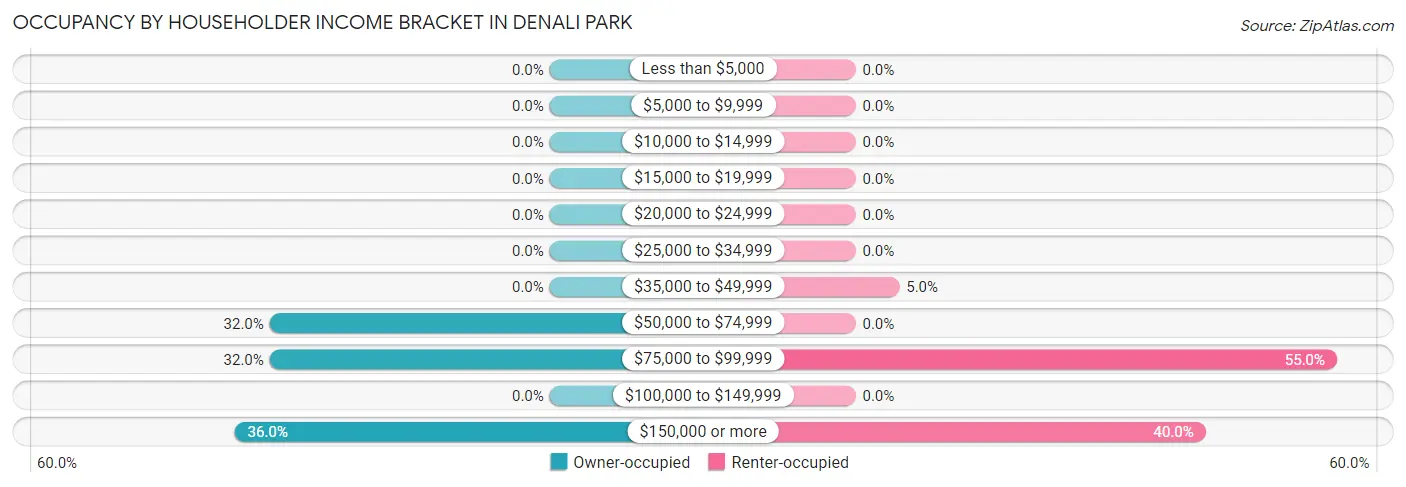
| Income Bracket | Owner-occupied | Renter-occupied |
| Less than $5,000 | 0 (0.0%) | 0 (0.0%) |
| $5,000 to $9,999 | 0 (0.0%) | 0 (0.0%) |
| $10,000 to $14,999 | 0 (0.0%) | 0 (0.0%) |
| $15,000 to $19,999 | 0 (0.0%) | 0 (0.0%) |
| $20,000 to $24,999 | 0 (0.0%) | 0 (0.0%) |
| $25,000 to $34,999 | 0 (0.0%) | 0 (0.0%) |
| $35,000 to $49,999 | 0 (0.0%) | 1 (5.0%) |
| $50,000 to $74,999 | 8 (32.0%) | 0 (0.0%) |
| $75,000 to $99,999 | 8 (32.0%) | 11 (55.0%) |
| $100,000 to $149,999 | 0 (0.0%) | 0 (0.0%) |
| $150,000 or more | 9 (36.0%) | 8 (40.0%) |
| Total | 25 (100.0%) | 20 (100.0%) |
Monthly Housing Cost Tiers in Denali Park
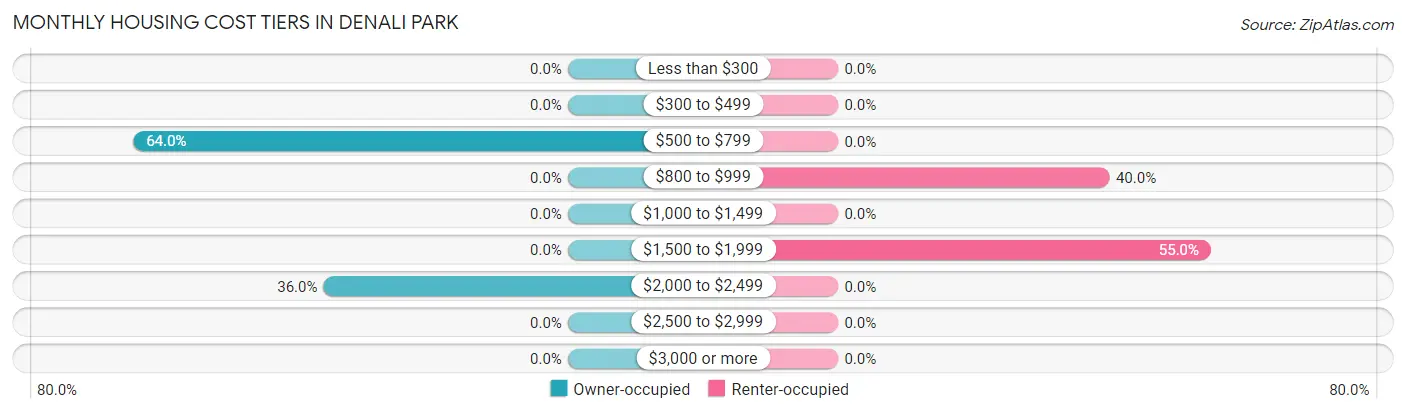
| Monthly Cost | Owner-occupied | Renter-occupied |
| Less than $300 | 0 (0.0%) | 0 (0.0%) |
| $300 to $499 | 0 (0.0%) | 0 (0.0%) |
| $500 to $799 | 16 (64.0%) | 0 (0.0%) |
| $800 to $999 | 0 (0.0%) | 8 (40.0%) |
| $1,000 to $1,499 | 0 (0.0%) | 0 (0.0%) |
| $1,500 to $1,999 | 0 (0.0%) | 11 (55.0%) |
| $2,000 to $2,499 | 9 (36.0%) | 0 (0.0%) |
| $2,500 to $2,999 | 0 (0.0%) | 0 (0.0%) |
| $3,000 or more | 0 (0.0%) | 0 (0.0%) |
| Total | 25 (100.0%) | 20 (100.0%) |
Physical Housing Characteristics in Denali Park
Housing Structures in Denali Park
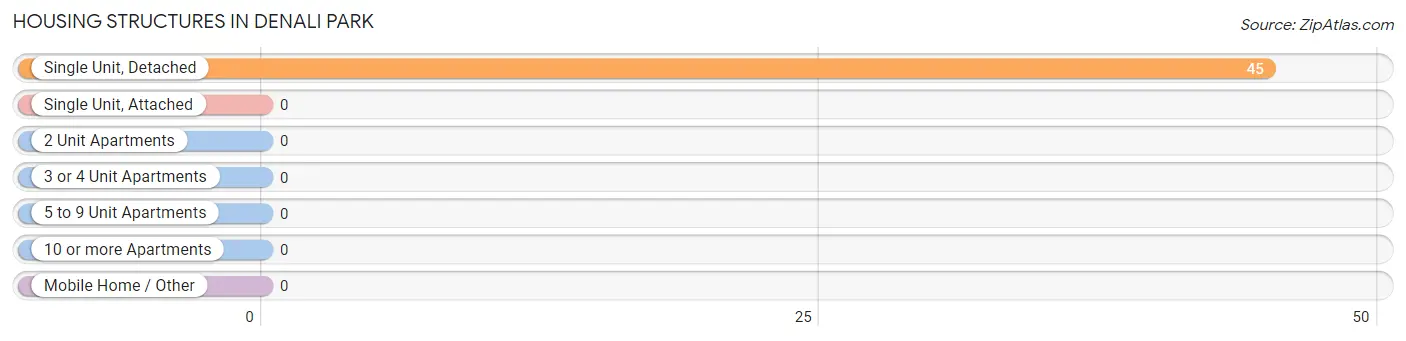
| Structure Type | # Housing Units | % Housing Units |
| Single Unit, Detached | 45 | 100.0% |
| Single Unit, Attached | 0 | 0.0% |
| 2 Unit Apartments | 0 | 0.0% |
| 3 or 4 Unit Apartments | 0 | 0.0% |
| 5 to 9 Unit Apartments | 0 | 0.0% |
| 10 or more Apartments | 0 | 0.0% |
| Mobile Home / Other | 0 | 0.0% |
| Total | 45 | 100.0% |
Housing Structures by Occupancy in Denali Park
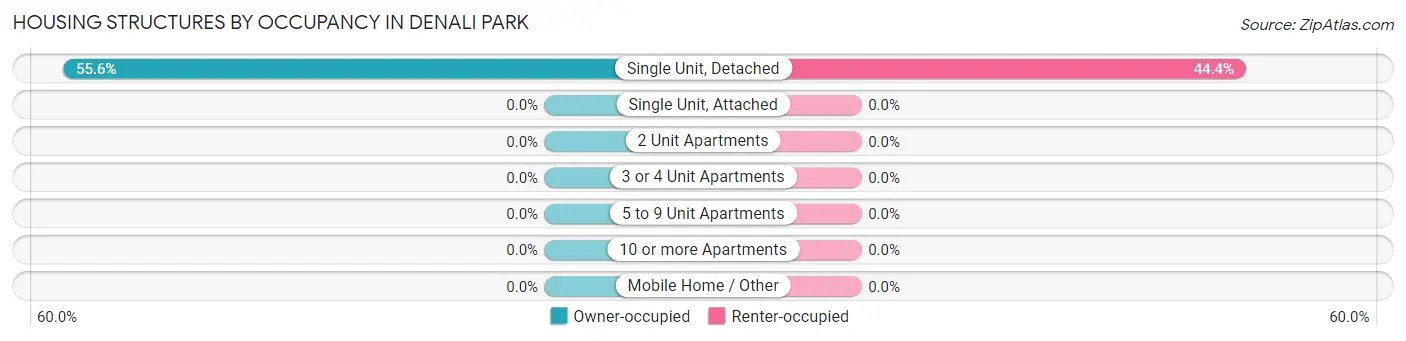
| Structure Type | Owner-occupied | Renter-occupied |
| Single Unit, Detached | 25 (55.6%) | 20 (44.4%) |
| Single Unit, Attached | 0 (0.0%) | 0 (0.0%) |
| 2 Unit Apartments | 0 (0.0%) | 0 (0.0%) |
| 3 or 4 Unit Apartments | 0 (0.0%) | 0 (0.0%) |
| 5 to 9 Unit Apartments | 0 (0.0%) | 0 (0.0%) |
| 10 or more Apartments | 0 (0.0%) | 0 (0.0%) |
| Mobile Home / Other | 0 (0.0%) | 0 (0.0%) |
| Total | 25 (55.6%) | 20 (44.4%) |
Housing Structures by Number of Rooms in Denali Park
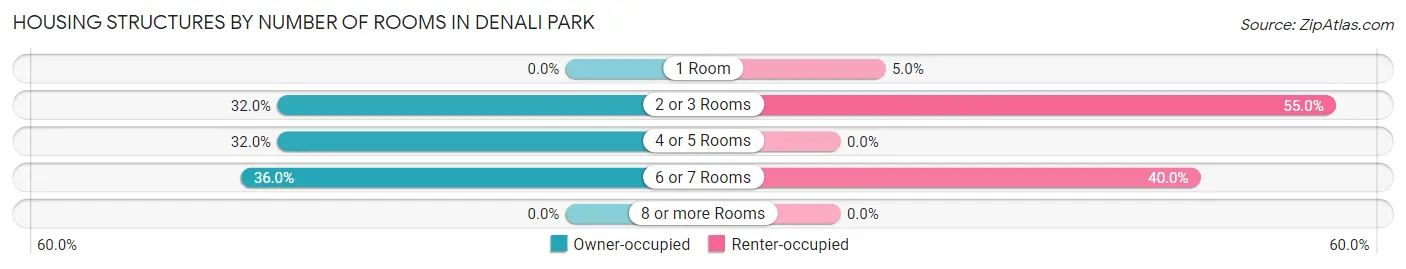
| Number of Rooms | Owner-occupied | Renter-occupied |
| 1 Room | 0 (0.0%) | 1 (5.0%) |
| 2 or 3 Rooms | 8 (32.0%) | 11 (55.0%) |
| 4 or 5 Rooms | 8 (32.0%) | 0 (0.0%) |
| 6 or 7 Rooms | 9 (36.0%) | 8 (40.0%) |
| 8 or more Rooms | 0 (0.0%) | 0 (0.0%) |
| Total | 25 (100.0%) | 20 (100.0%) |
Housing Structure by Heating Type in Denali Park
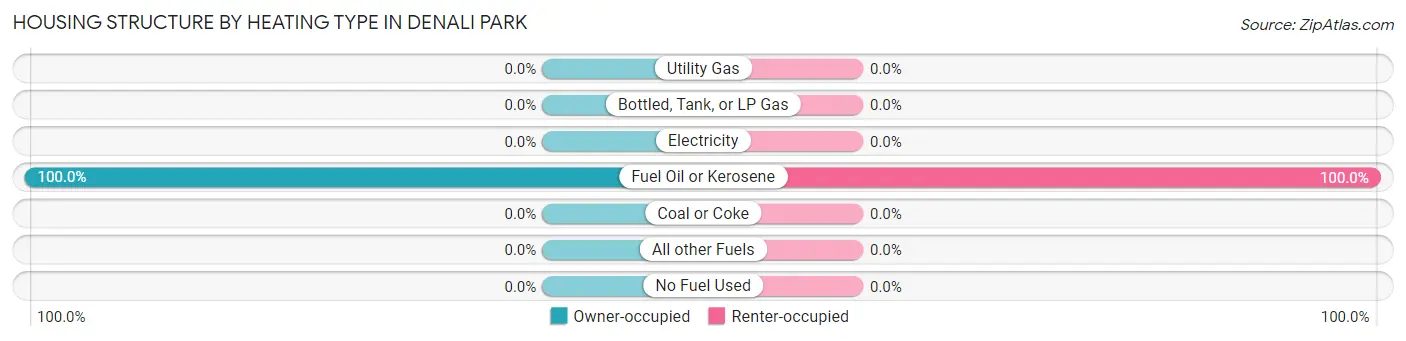
| Heating Type | Owner-occupied | Renter-occupied |
| Utility Gas | 0 (0.0%) | 0 (0.0%) |
| Bottled, Tank, or LP Gas | 0 (0.0%) | 0 (0.0%) |
| Electricity | 0 (0.0%) | 0 (0.0%) |
| Fuel Oil or Kerosene | 25 (100.0%) | 20 (100.0%) |
| Coal or Coke | 0 (0.0%) | 0 (0.0%) |
| All other Fuels | 0 (0.0%) | 0 (0.0%) |
| No Fuel Used | 0 (0.0%) | 0 (0.0%) |
| Total | 25 (100.0%) | 20 (100.0%) |
Household Vehicle Usage in Denali Park
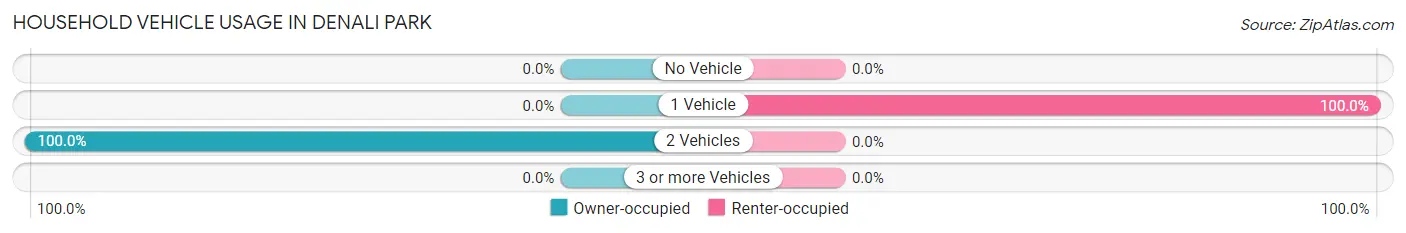
| Vehicles per Household | Owner-occupied | Renter-occupied |
| No Vehicle | 0 (0.0%) | 0 (0.0%) |
| 1 Vehicle | 0 (0.0%) | 20 (100.0%) |
| 2 Vehicles | 25 (100.0%) | 0 (0.0%) |
| 3 or more Vehicles | 0 (0.0%) | 0 (0.0%) |
| Total | 25 (100.0%) | 20 (100.0%) |
Real Estate & Mortgages in Denali Park
Real Estate and Mortgage Overview in Denali Park
| Characteristic | Without Mortgage | With Mortgage |
| Housing Units | 16 | 9 |
| Median Property Value | - | - |
| Median Household Income | - | - |
| Monthly Housing Costs | - | - |
| Real Estate Taxes | - | - |
Property Value by Mortgage Status in Denali Park
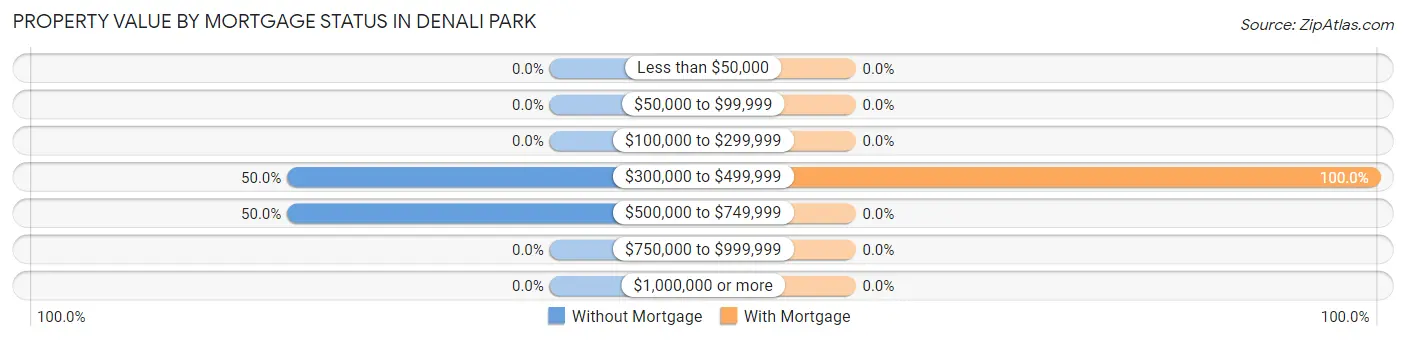
| Property Value | Without Mortgage | With Mortgage |
| Less than $50,000 | 0 (0.0%) | 0 (0.0%) |
| $50,000 to $99,999 | 0 (0.0%) | 0 (0.0%) |
| $100,000 to $299,999 | 0 (0.0%) | 0 (0.0%) |
| $300,000 to $499,999 | 8 (50.0%) | 9 (100.0%) |
| $500,000 to $749,999 | 8 (50.0%) | 0 (0.0%) |
| $750,000 to $999,999 | 0 (0.0%) | 0 (0.0%) |
| $1,000,000 or more | 0 (0.0%) | 0 (0.0%) |
| Total | 16 (100.0%) | 9 (100.0%) |
Household Income by Mortgage Status in Denali Park
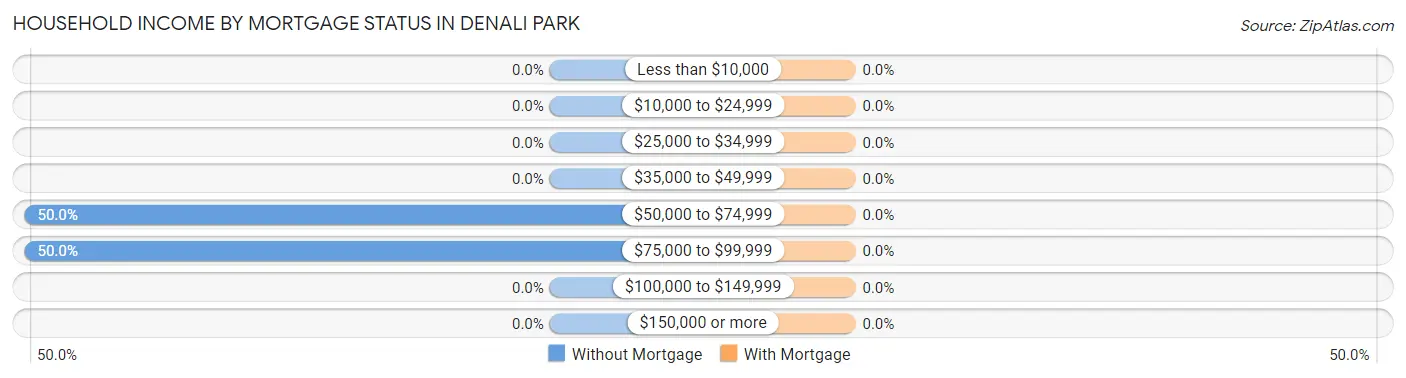
| Household Income | Without Mortgage | With Mortgage |
| Less than $10,000 | 0 (0.0%) | 0 (0.0%) |
| $10,000 to $24,999 | 0 (0.0%) | 0 (0.0%) |
| $25,000 to $34,999 | 0 (0.0%) | 0 (0.0%) |
| $35,000 to $49,999 | 0 (0.0%) | 0 (0.0%) |
| $50,000 to $74,999 | 8 (50.0%) | 0 (0.0%) |
| $75,000 to $99,999 | 8 (50.0%) | 0 (0.0%) |
| $100,000 to $149,999 | 0 (0.0%) | 0 (0.0%) |
| $150,000 or more | 0 (0.0%) | 0 (0.0%) |
| Total | 16 (100.0%) | 9 (100.0%) |
Property Value to Household Income Ratio in Denali Park
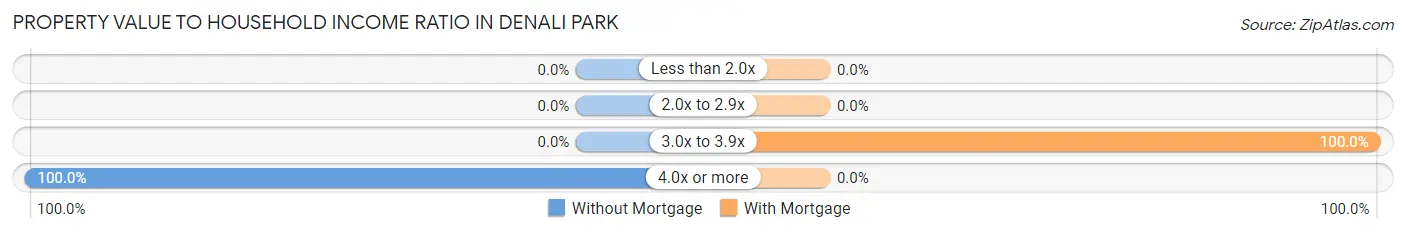
| Value-to-Income Ratio | Without Mortgage | With Mortgage |
| Less than 2.0x | 0 (0.0%) | 0 (0.0%) |
| 2.0x to 2.9x | 0 (0.0%) | 0 (0.0%) |
| 3.0x to 3.9x | 0 (0.0%) | 9 (100.0%) |
| 4.0x or more | 16 (100.0%) | 0 (0.0%) |
| Total | 16 (100.0%) | 9 (100.0%) |
Real Estate Taxes by Mortgage Status in Denali Park
| Property Taxes | Without Mortgage | With Mortgage |
| Less than $800 | 0 (0.0%) | 0 (0.0%) |
| $800 to $1,499 | 0 (0.0%) | 0 (0.0%) |
| $800 to $1,499 | 0 (0.0%) | 0 (0.0%) |
| Total | 16 (100.0%) | 9 (100.0%) |
Health & Disability in Denali Park
Health Insurance Coverage by Age in Denali Park
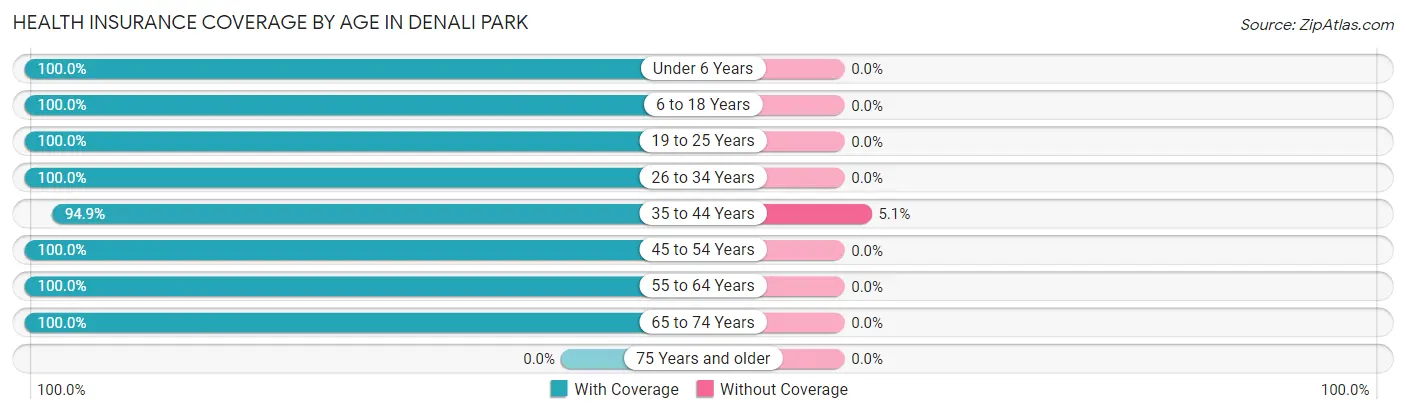
| Age Bracket | With Coverage | Without Coverage |
| Under 6 Years | 7 (100.0%) | 0 (0.0%) |
| 6 to 18 Years | 7 (100.0%) | 0 (0.0%) |
| 19 to 25 Years | 21 (100.0%) | 0 (0.0%) |
| 26 to 34 Years | 85 (100.0%) | 0 (0.0%) |
| 35 to 44 Years | 449 (94.9%) | 24 (5.1%) |
| 45 to 54 Years | 96 (100.0%) | 0 (0.0%) |
| 55 to 64 Years | 105 (100.0%) | 0 (0.0%) |
| 65 to 74 Years | 23 (100.0%) | 0 (0.0%) |
| 75 Years and older | 0 (0.0%) | 0 (0.0%) |
| Total | 793 (97.1%) | 24 (2.9%) |
Health Insurance Coverage by Citizenship Status in Denali Park
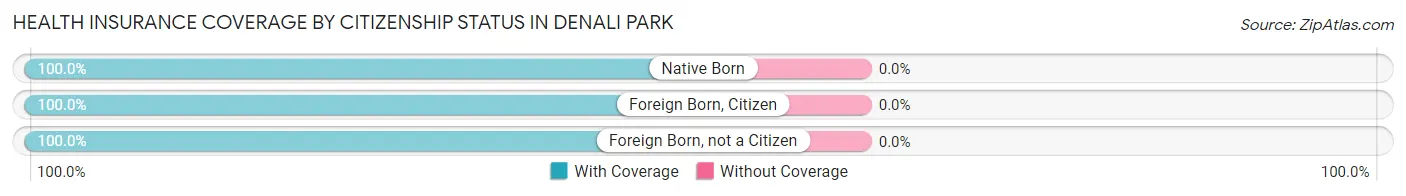
| Citizenship Status | With Coverage | Without Coverage |
| Native Born | 7 (100.0%) | 0 (0.0%) |
| Foreign Born, Citizen | 7 (100.0%) | 0 (0.0%) |
| Foreign Born, not a Citizen | 21 (100.0%) | 0 (0.0%) |
Health Insurance Coverage by Household Income in Denali Park
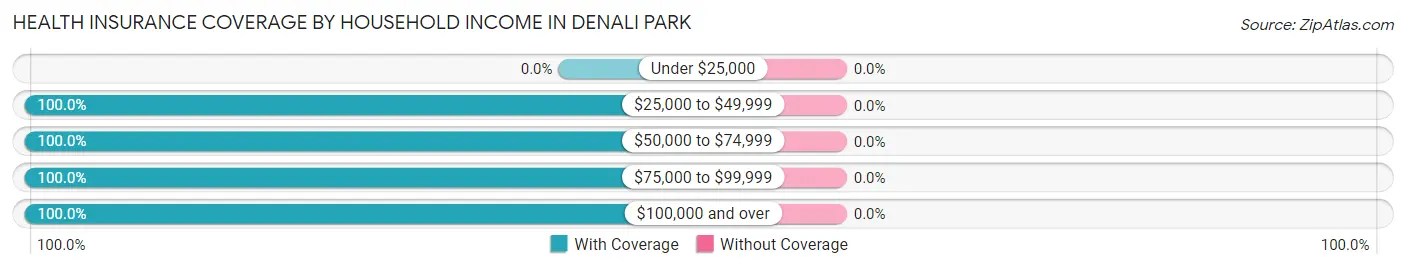
| Household Income | With Coverage | Without Coverage |
| Under $25,000 | 0 (0.0%) | 0 (0.0%) |
| $25,000 to $49,999 | 1 (100.0%) | 0 (0.0%) |
| $50,000 to $74,999 | 16 (100.0%) | 0 (0.0%) |
| $75,000 to $99,999 | 26 (100.0%) | 0 (0.0%) |
| $100,000 and over | 45 (100.0%) | 0 (0.0%) |
Public vs Private Health Insurance Coverage by Age in Denali Park
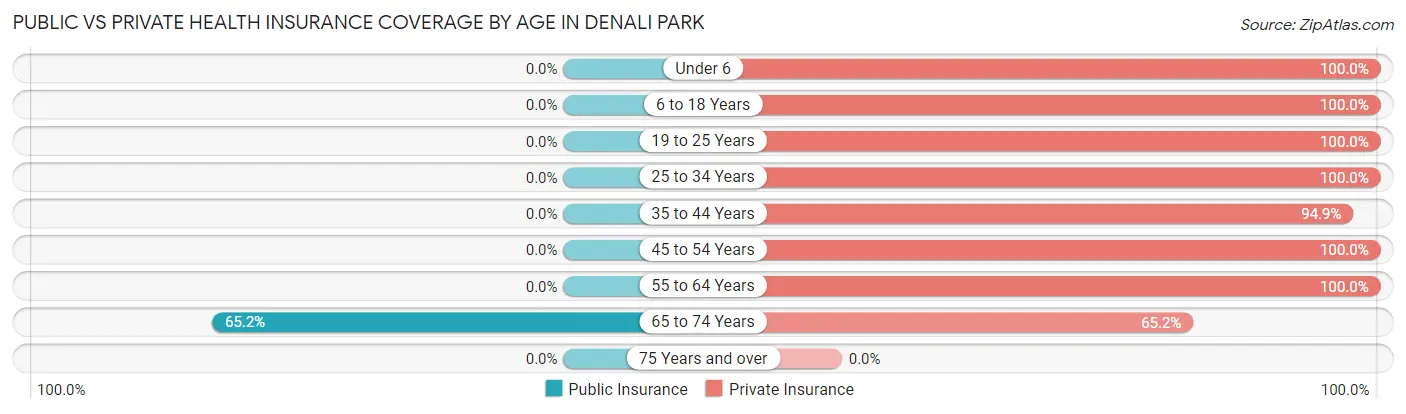
| Age Bracket | Public Insurance | Private Insurance |
| Under 6 | 0 (0.0%) | 7 (100.0%) |
| 6 to 18 Years | 0 (0.0%) | 7 (100.0%) |
| 19 to 25 Years | 0 (0.0%) | 21 (100.0%) |
| 25 to 34 Years | 0 (0.0%) | 85 (100.0%) |
| 35 to 44 Years | 0 (0.0%) | 449 (94.9%) |
| 45 to 54 Years | 0 (0.0%) | 96 (100.0%) |
| 55 to 64 Years | 0 (0.0%) | 105 (100.0%) |
| 65 to 74 Years | 15 (65.2%) | 15 (65.2%) |
| 75 Years and over | 0 (0.0%) | 0 (0.0%) |
| Total | 15 (1.8%) | 785 (96.1%) |
Disability Status by Sex by Age in Denali Park
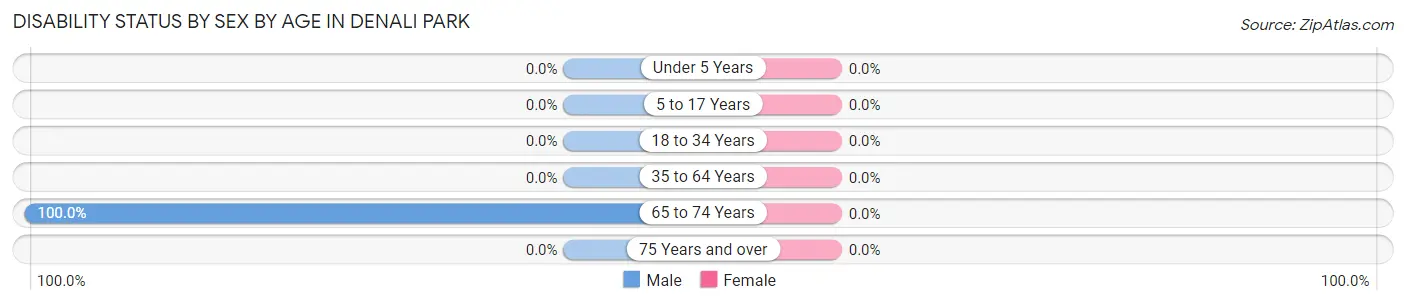
| Age Bracket | Male | Female |
| Under 5 Years | 0 (0.0%) | 0 (0.0%) |
| 5 to 17 Years | 0 (0.0%) | 0 (0.0%) |
| 18 to 34 Years | 0 (0.0%) | 0 (0.0%) |
| 35 to 64 Years | 0 (0.0%) | 0 (0.0%) |
| 65 to 74 Years | 8 (100.0%) | 0 (0.0%) |
| 75 Years and over | 0 (0.0%) | 0 (0.0%) |
Disability Class by Sex by Age in Denali Park
Disability Class: Hearing Difficulty
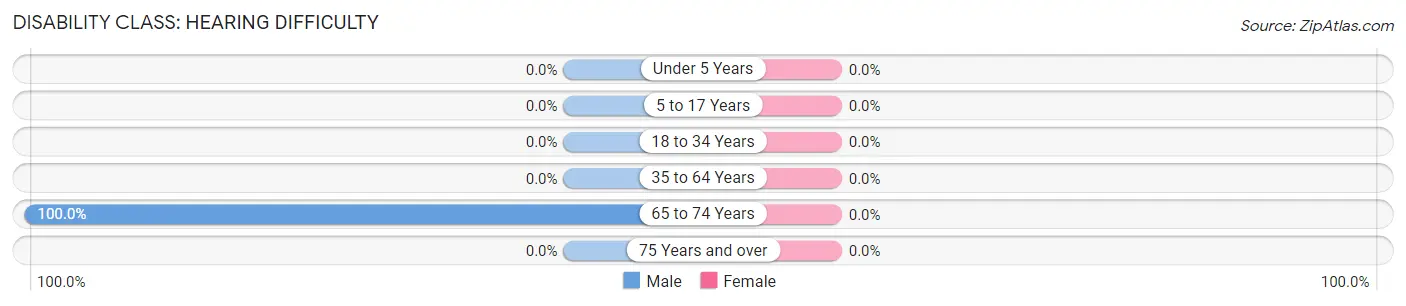
| Age Bracket | Male | Female |
| Under 5 Years | 0 (0.0%) | 0 (0.0%) |
| 5 to 17 Years | 0 (0.0%) | 0 (0.0%) |
| 18 to 34 Years | 0 (0.0%) | 0 (0.0%) |
| 35 to 64 Years | 0 (0.0%) | 0 (0.0%) |
| 65 to 74 Years | 8 (100.0%) | 0 (0.0%) |
| 75 Years and over | 0 (0.0%) | 0 (0.0%) |
Disability Class: Vision Difficulty

| Age Bracket | Male | Female |
| Under 5 Years | 0 (0.0%) | 0 (0.0%) |
| 5 to 17 Years | 0 (0.0%) | 0 (0.0%) |
| 18 to 34 Years | 0 (0.0%) | 0 (0.0%) |
| 35 to 64 Years | 0 (0.0%) | 0 (0.0%) |
| 65 to 74 Years | 0 (0.0%) | 0 (0.0%) |
| 75 Years and over | 0 (0.0%) | 0 (0.0%) |
Disability Class: Cognitive Difficulty
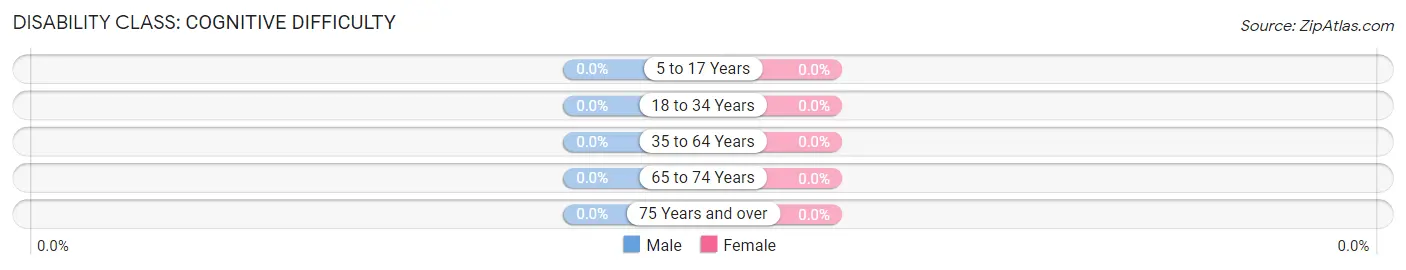
| Age Bracket | Male | Female |
| 5 to 17 Years | 0 (0.0%) | 0 (0.0%) |
| 18 to 34 Years | 0 (0.0%) | 0 (0.0%) |
| 35 to 64 Years | 0 (0.0%) | 0 (0.0%) |
| 65 to 74 Years | 0 (0.0%) | 0 (0.0%) |
| 75 Years and over | 0 (0.0%) | 0 (0.0%) |
Disability Class: Ambulatory Difficulty
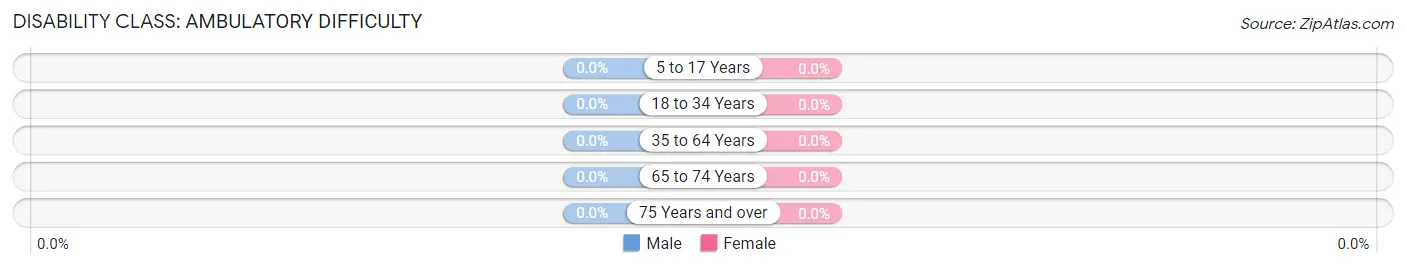
| Age Bracket | Male | Female |
| 5 to 17 Years | 0 (0.0%) | 0 (0.0%) |
| 18 to 34 Years | 0 (0.0%) | 0 (0.0%) |
| 35 to 64 Years | 0 (0.0%) | 0 (0.0%) |
| 65 to 74 Years | 0 (0.0%) | 0 (0.0%) |
| 75 Years and over | 0 (0.0%) | 0 (0.0%) |
Disability Class: Self-Care Difficulty
| Age Bracket | Male | Female |
| 5 to 17 Years | 0 (0.0%) | 0 (0.0%) |
| 18 to 34 Years | 0 (0.0%) | 0 (0.0%) |
| 35 to 64 Years | 0 (0.0%) | 0 (0.0%) |
| 65 to 74 Years | 0 (0.0%) | 0 (0.0%) |
| 75 Years and over | 0 (0.0%) | 0 (0.0%) |
Technology Access in Denali Park
Computing Device Access in Denali Park
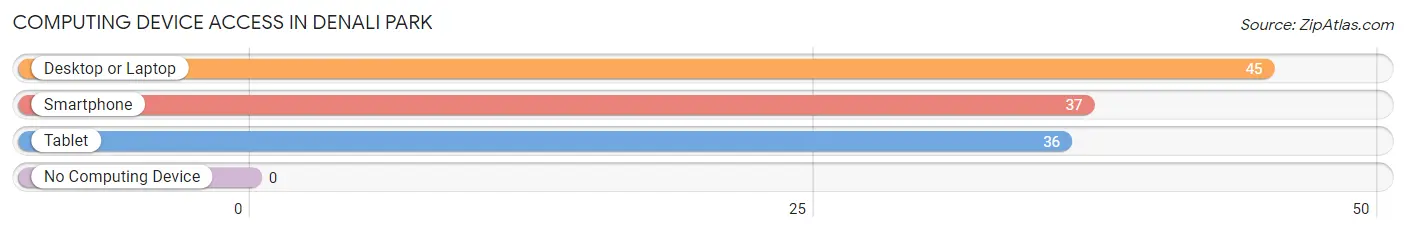
| Device Type | # Households | % Households |
| Desktop or Laptop | 45 | 100.0% |
| Smartphone | 37 | 82.2% |
| Tablet | 36 | 80.0% |
| No Computing Device | 0 | 0.0% |
| Total | 45 | 100.0% |
Internet Access in Denali Park
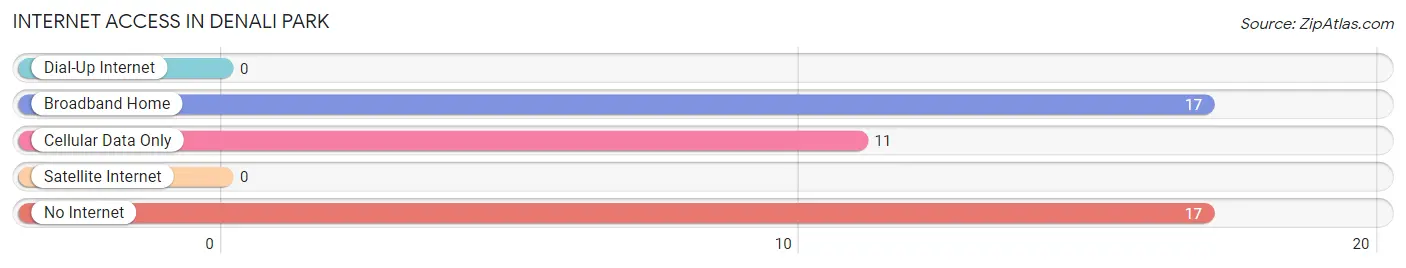
| Internet Type | # Households | % Households |
| Dial-Up Internet | 0 | 0.0% |
| Broadband Home | 17 | 37.8% |
| Cellular Data Only | 11 | 24.4% |
| Satellite Internet | 0 | 0.0% |
| No Internet | 17 | 37.8% |
| Total | 45 | 100.0% |
Denali Park Summary
Denali Park, Alaska is a vast and beautiful area located in the heart of the Alaska Range. It is home to the highest mountain peak in North America, Mount McKinley, and is one of the most popular tourist destinations in the state. Denali Park is a unique and diverse area that offers a variety of activities and attractions for visitors.
Geography
Denali Park is located in the south-central region of Alaska, approximately 240 miles north of Anchorage. It is bordered by the Alaska Range to the east, the Chugach Mountains to the south, and the Yukon River to the west. The park covers an area of 6 million acres, making it the largest national park in the United States. The terrain is mostly mountainous, with the highest peak being Mount McKinley at 20,310 feet. The park also contains numerous glaciers, rivers, and lakes, as well as a variety of wildlife.
History
Denali Park was established in 1917 as Mount McKinley National Park. It was renamed Denali National Park and Preserve in 1980. The park has a long and rich history, with evidence of human habitation dating back thousands of years. The area was first explored by Europeans in the late 19th century, and the first recorded ascent of Mount McKinley was made in 1913. The park has been a popular tourist destination since the early 20th century, and continues to attract visitors from around the world.
Economy
The economy of Denali Park is largely based on tourism. The park is home to a variety of attractions, including Mount McKinley, the Alaska Range, and numerous glaciers, rivers, and lakes. The park also offers a variety of activities, such as hiking, camping, fishing, and wildlife viewing. In addition, the park is home to a variety of businesses, including hotels, restaurants, and souvenir shops.
Demographics
As of the 2010 census, the population of Denali Park was 1,826. The population is largely composed of Native Americans, with the largest group being the Athabascan people. The park also has a small population of non-Native Americans, primarily from the United States and Canada.
Conclusion
Denali Park is a unique and beautiful area located in the heart of the Alaska Range. It is home to the highest mountain peak in North America, Mount McKinley, and is one of the most popular tourist destinations in the state. The park offers a variety of activities and attractions for visitors, and its economy is largely based on tourism. The population of Denali Park is largely composed of Native Americans, with the largest group being the Athabascan people.
Common Questions
What is Per Capita Income in Denali Park?
Per Capita income in Denali Park is $122,651.
What is the Median Family Income in Denali Park?
Median Family Income in Denali Park is $166,406.
What is the Median Household income in Denali Park?
Median Household Income in Denali Park is $86,250.
What is Inequality or Gini Index in Denali Park?
Inequality or Gini Index in Denali Park is 0.23.
What is the Total Population of Denali Park?
Total Population of Denali Park is 817.
What is the Total Male Population of Denali Park?
Total Male Population of Denali Park is 670.
What is the Total Female Population of Denali Park?
Total Female Population of Denali Park is 147.
What is the Ratio of Males per 100 Females in Denali Park?
There are 455.78 Males per 100 Females in Denali Park.
What is the Ratio of Females per 100 Males in Denali Park?
There are 21.94 Females per 100 Males in Denali Park.
What is the Median Population Age in Denali Park?
Median Population Age in Denali Park is 44.5 Years.
What is the Average Family Size in Denali Park
Average Family Size in Denali Park is 2.4 People.
What is the Average Household Size in Denali Park
Average Household Size in Denali Park is 2.0 People.
How Large is the Labor Force in Denali Park?
There are 780 People in the Labor Forcein in Denali Park.
What is the Percentage of People in the Labor Force in Denali Park?
97.1% of People are in the Labor Force in Denali Park.