Mosquito Lake, AK Map & Demographics
Mosquito Lake Map
Mosquito Lake Overview
$63,106
PER CAPITA INCOME
$119,375
AVG FAMILY INCOME
$96,719
AVG HOUSEHOLD INCOME
0.24
INEQUALITY / GINI INDEX
154
TOTAL POPULATION
89
MALE POPULATION
65
FEMALE POPULATION
136.92
MALES / 100 FEMALES
73.03
FEMALES / 100 MALES
54.7
MEDIAN AGE
2.3
AVG FAMILY SIZE
1.9
AVG HOUSEHOLD SIZE
88
LABOR FORCE [ PEOPLE ]
57.1%
PERCENT IN LABOR FORCE
Income in Mosquito Lake
Income Overview in Mosquito Lake
Per Capita Income in Mosquito Lake is $63,106, while median incomes of families and households are $119,375 and $96,719 respectively.
| Characteristic | Number | Measure |
| Per Capita Income | 154 | $63,106 |
| Median Family Income | 57 | $119,375 |
| Mean Family Income | 57 | $118,832 |
| Median Household Income | 81 | $96,719 |
| Mean Household Income | 81 | $95,259 |
| Income Deficit | 57 | $0 |
| Wage / Income Gap (%) | 154 | 0.00% |
| Wage / Income Gap ($) | 154 | 100.00¢ per $1 |
| Gini / Inequality Index | 154 | 0.24 |
Earnings by Sex in Mosquito Lake
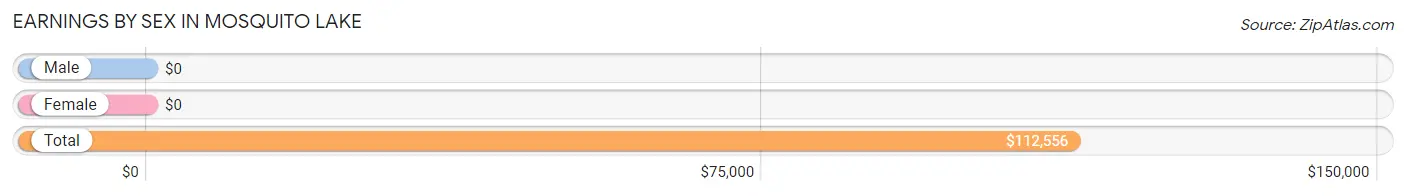
| Sex | Number | Average Earnings |
| Male | 51 (58.0%) | $0 |
| Female | 37 (42.0%) | $0 |
| Total | 88 (100.0%) | $112,556 |
Earnings by Sex by Income Bracket in Mosquito Lake
The most common earnings brackets in Mosquito Lake are $100,000+ for men (51 | 100.0%) and $17,500 to $19,999 for women (37 | 100.0%).
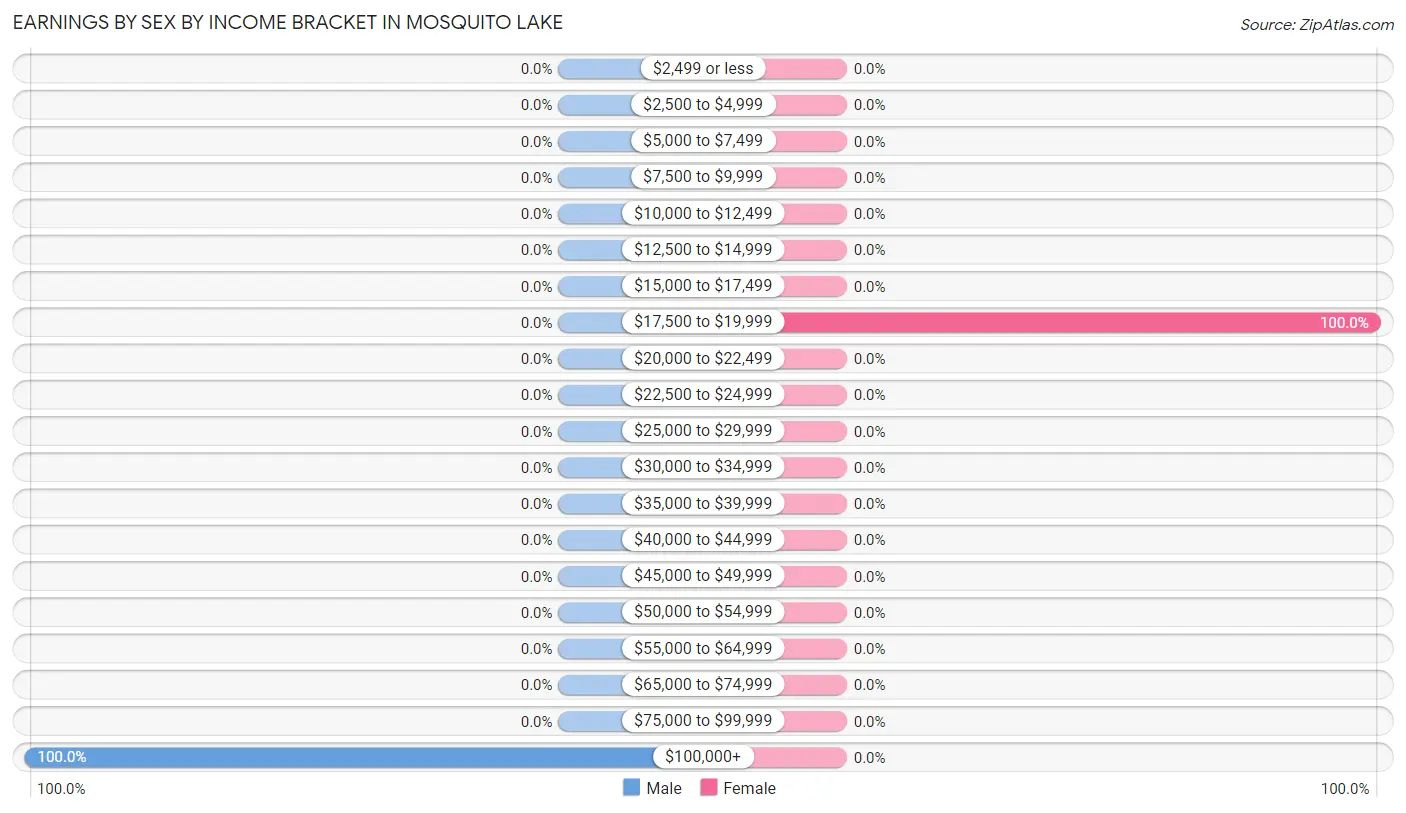
| Income | Male | Female |
| $2,499 or less | 0 (0.0%) | 0 (0.0%) |
| $2,500 to $4,999 | 0 (0.0%) | 0 (0.0%) |
| $5,000 to $7,499 | 0 (0.0%) | 0 (0.0%) |
| $7,500 to $9,999 | 0 (0.0%) | 0 (0.0%) |
| $10,000 to $12,499 | 0 (0.0%) | 0 (0.0%) |
| $12,500 to $14,999 | 0 (0.0%) | 0 (0.0%) |
| $15,000 to $17,499 | 0 (0.0%) | 0 (0.0%) |
| $17,500 to $19,999 | 0 (0.0%) | 37 (100.0%) |
| $20,000 to $22,499 | 0 (0.0%) | 0 (0.0%) |
| $22,500 to $24,999 | 0 (0.0%) | 0 (0.0%) |
| $25,000 to $29,999 | 0 (0.0%) | 0 (0.0%) |
| $30,000 to $34,999 | 0 (0.0%) | 0 (0.0%) |
| $35,000 to $39,999 | 0 (0.0%) | 0 (0.0%) |
| $40,000 to $44,999 | 0 (0.0%) | 0 (0.0%) |
| $45,000 to $49,999 | 0 (0.0%) | 0 (0.0%) |
| $50,000 to $54,999 | 0 (0.0%) | 0 (0.0%) |
| $55,000 to $64,999 | 0 (0.0%) | 0 (0.0%) |
| $65,000 to $74,999 | 0 (0.0%) | 0 (0.0%) |
| $75,000 to $99,999 | 0 (0.0%) | 0 (0.0%) |
| $100,000+ | 51 (100.0%) | 0 (0.0%) |
| Total | 51 (100.0%) | 37 (100.0%) |
Earnings by Sex by Educational Attainment in Mosquito Lake
| Educational Attainment | Male Income | Female Income |
| Less than High School | - | - |
| High School Diploma | - | - |
| College or Associate's Degree | - | - |
| Bachelor's Degree | - | - |
| Graduate Degree | - | - |
| Total | - | - |
Family Income in Mosquito Lake
Family Income Brackets in Mosquito Lake
According to the Mosquito Lake family income data, there are 33 families falling into the $100,000 to $149,999 income range, which is the most common income bracket and makes up 57.9% of all families.
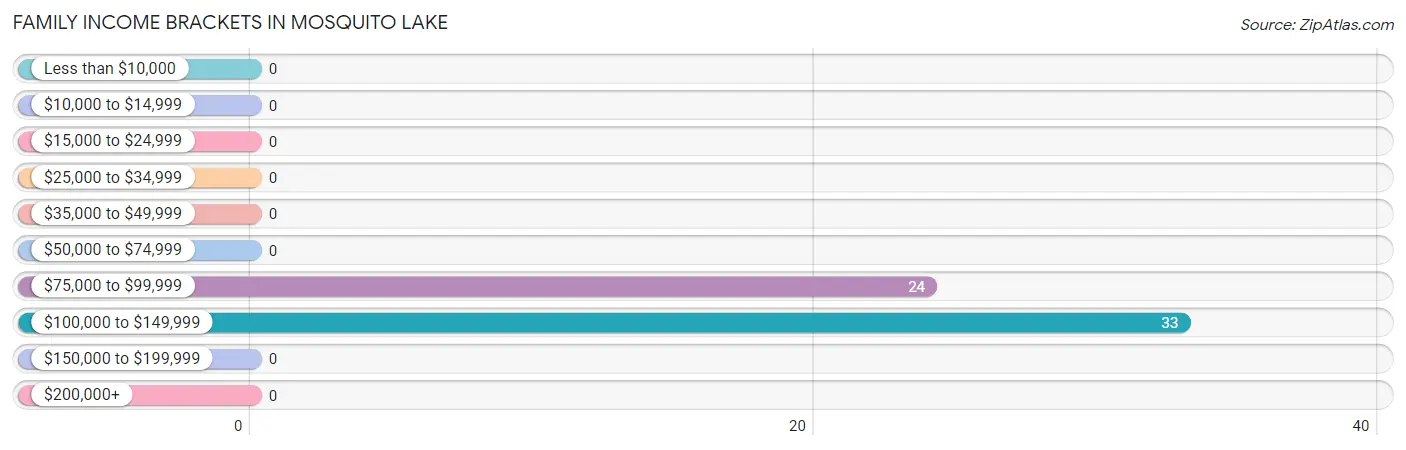
| Income Bracket | # Families | % Families |
| Less than $10,000 | 0 | 0.0% |
| $10,000 to $14,999 | 0 | 0.0% |
| $15,000 to $24,999 | 0 | 0.0% |
| $25,000 to $34,999 | 0 | 0.0% |
| $35,000 to $49,999 | 0 | 0.0% |
| $50,000 to $74,999 | 0 | 0.0% |
| $75,000 to $99,999 | 24 | 42.1% |
| $100,000 to $149,999 | 33 | 57.9% |
| $150,000 to $199,999 | 0 | 0.0% |
| $200,000+ | 0 | 0.0% |
Family Income by Famaliy Size in Mosquito Lake
2-person families (57 | 100.0%) account for the highest median family income in Mosquito Lake with $119,375 per family, while 2-person families (57 | 100.0%) have the highest median income of $59,688 per family member.
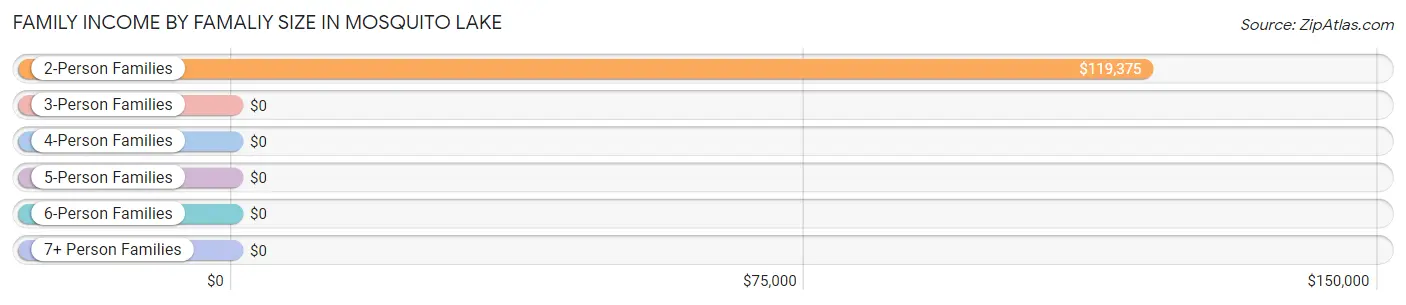
| Income Bracket | # Families | Median Income |
| 2-Person Families | 57 (100.0%) | $119,375 |
| 3-Person Families | 0 (0.0%) | $0 |
| 4-Person Families | 0 (0.0%) | $0 |
| 5-Person Families | 0 (0.0%) | $0 |
| 6-Person Families | 0 (0.0%) | $0 |
| 7+ Person Families | 0 (0.0%) | $0 |
| Total | 57 (100.0%) | $119,375 |
Family Income by Number of Earners in Mosquito Lake
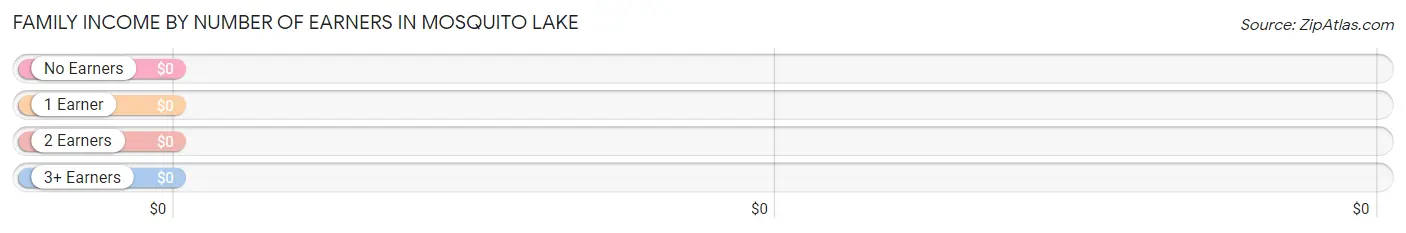
| Number of Earners | # Families | Median Income |
| No Earners | 24 (42.1%) | $0 |
| 1 Earner | 6 (10.5%) | $0 |
| 2 Earners | 27 (47.4%) | $0 |
| 3+ Earners | 0 (0.0%) | $0 |
| Total | 57 (100.0%) | $119,375 |
Household Income in Mosquito Lake
Household Income Brackets in Mosquito Lake
With 33 households falling in the category, the $100,000 to $149,999 income range is the most frequent in Mosquito Lake, accounting for 40.7% of all households.
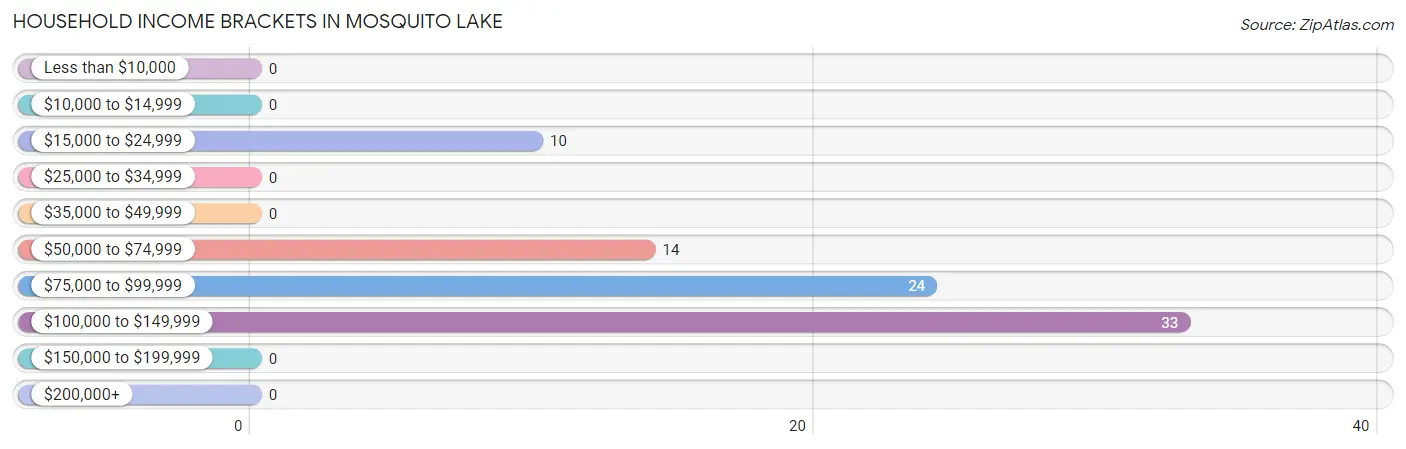
| Income Bracket | # Households | % Households |
| Less than $10,000 | 0 | 0.0% |
| $10,000 to $14,999 | 0 | 0.0% |
| $15,000 to $24,999 | 10 | 12.3% |
| $25,000 to $34,999 | 0 | 0.0% |
| $35,000 to $49,999 | 0 | 0.0% |
| $50,000 to $74,999 | 14 | 17.3% |
| $75,000 to $99,999 | 24 | 29.6% |
| $100,000 to $149,999 | 33 | 40.7% |
| $150,000 to $199,999 | 0 | 0.0% |
| $200,000+ | 0 | 0.0% |
Household Income by Householder Age in Mosquito Lake
The median household income in Mosquito Lake is $96,719, with the highest median household income of $138,009 found in the 45 to 64 years age bracket for the primary householder. A total of 43 households (53.1%) fall into this category.
| Income Bracket | # Households | Median Income |
| 15 to 24 Years | 0 (0.0%) | $0 |
| 25 to 44 Years | 0 (0.0%) | $0 |
| 45 to 64 Years | 43 (53.1%) | $138,009 |
| 65+ Years | 38 (46.9%) | $0 |
| Total | 81 (100.0%) | $96,719 |
Poverty in Mosquito Lake
Income Below Poverty by Sex and Age in Mosquito Lake
| Age Bracket | Male | Female |
| Under 5 Years | 0 (0.0%) | 0 (0.0%) |
| 5 Years | 0 (0.0%) | 0 (0.0%) |
| 6 to 11 Years | 0 (0.0%) | 0 (0.0%) |
| 12 to 14 Years | 0 (0.0%) | 0 (0.0%) |
| 15 Years | 0 (0.0%) | 0 (0.0%) |
| 16 and 17 Years | 0 (0.0%) | 0 (0.0%) |
| 18 to 24 Years | 0 (0.0%) | 0 (0.0%) |
| 25 to 34 Years | 0 (0.0%) | 0 (0.0%) |
| 35 to 44 Years | 0 (0.0%) | 0 (0.0%) |
| 45 to 54 Years | 0 (0.0%) | 0 (0.0%) |
| 55 to 64 Years | 0 (0.0%) | 0 (0.0%) |
| 65 to 74 Years | 0 (0.0%) | 0 (0.0%) |
| 75 Years and over | 0 (0.0%) | 0 (0.0%) |
| Total | 0 (0.0%) | 0 (0.0%) |
Income Above Poverty by Sex and Age in Mosquito Lake
According to the poverty statistics in Mosquito Lake, males aged 45 to 54 years and females aged 45 to 54 years are the age groups that are most secure financially, with 100.0% of males and 100.0% of females in these age groups living above the poverty line.
| Age Bracket | Male | Female |
| Under 5 Years | 0 (0.0%) | 0 (0.0%) |
| 5 Years | 0 (0.0%) | 0 (0.0%) |
| 6 to 11 Years | 0 (0.0%) | 0 (0.0%) |
| 12 to 14 Years | 0 (0.0%) | 0 (0.0%) |
| 15 Years | 0 (0.0%) | 0 (0.0%) |
| 16 and 17 Years | 0 (0.0%) | 0 (0.0%) |
| 18 to 24 Years | 0 (0.0%) | 0 (0.0%) |
| 25 to 34 Years | 0 (0.0%) | 0 (0.0%) |
| 35 to 44 Years | 0 (0.0%) | 0 (0.0%) |
| 45 to 54 Years | 45 (100.0%) | 34 (100.0%) |
| 55 to 64 Years | 6 (100.0%) | 10 (100.0%) |
| 65 to 74 Years | 38 (100.0%) | 21 (100.0%) |
| 75 Years and over | 0 (0.0%) | 0 (0.0%) |
| Total | 89 (100.0%) | 65 (100.0%) |
Income Below Poverty Among Married-Couple Families in Mosquito Lake
| Children | Above Poverty | Below Poverty |
| No Children | 57 (100.0%) | 0 (0.0%) |
| 1 or 2 Children | 0 (0.0%) | 0 (0.0%) |
| 3 or 4 Children | 0 (0.0%) | 0 (0.0%) |
| 5 or more Children | 0 (0.0%) | 0 (0.0%) |
| Total | 57 (100.0%) | 0 (0.0%) |
Income Below Poverty Among Single-Parent Households in Mosquito Lake
| Children | Single Father | Single Mother |
| No Children | 0 (0.0%) | 0 (0.0%) |
| 1 or 2 Children | 0 (0.0%) | 0 (0.0%) |
| 3 or 4 Children | 0 (0.0%) | 0 (0.0%) |
| 5 or more Children | 0 (0.0%) | 0 (0.0%) |
| Total | 0 (0.0%) | 0 (0.0%) |
Income Below Poverty Among Married-Couple vs Single-Parent Households in Mosquito Lake
| Children | Married-Couple Families | Single-Parent Households |
| No Children | 0 (0.0%) | 0 (0.0%) |
| 1 or 2 Children | 0 (0.0%) | 0 (0.0%) |
| 3 or 4 Children | 0 (0.0%) | 0 (0.0%) |
| 5 or more Children | 0 (0.0%) | 0 (0.0%) |
| Total | 0 (0.0%) | 0 (0.0%) |
Race in Mosquito Lake
The most populous races in Mosquito Lake are , and White / Caucasian (154 | 100.0%).
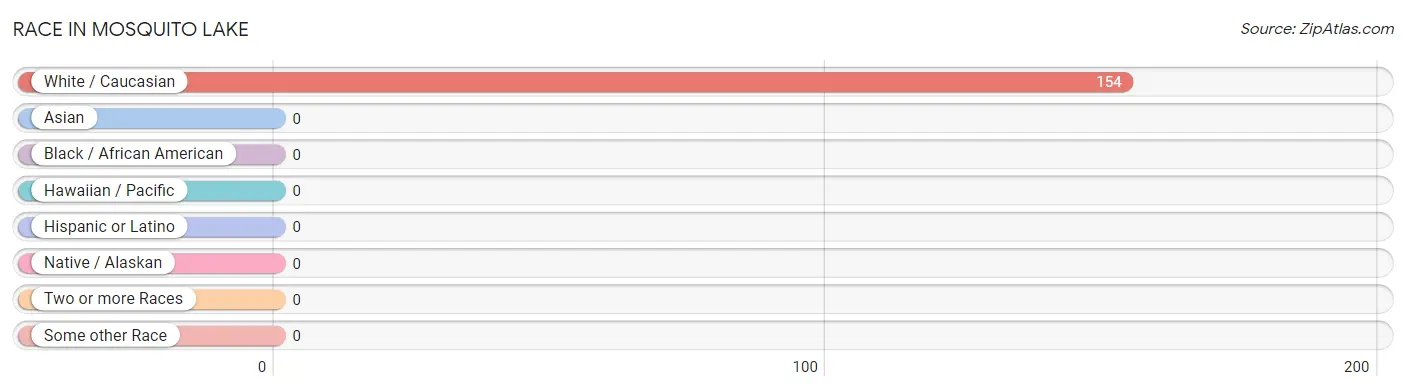
| Race | # Population | % Population |
| Asian | 0 | 0.0% |
| Black / African American | 0 | 0.0% |
| Hawaiian / Pacific | 0 | 0.0% |
| Hispanic or Latino | 0 | 0.0% |
| Native / Alaskan | 0 | 0.0% |
| White / Caucasian | 154 | 100.0% |
| Two or more Races | 0 | 0.0% |
| Some other Race | 0 | 0.0% |
| Total | 154 | 100.0% |
Ancestry in Mosquito Lake
The most populous ancestries reported in Mosquito Lake are European (14 | 9.1%), American (10 | 6.5%), English (7 | 4.5%), French (6 | 3.9%), and Irish (6 | 3.9%), together accounting for 27.9% of all Mosquito Lake residents.
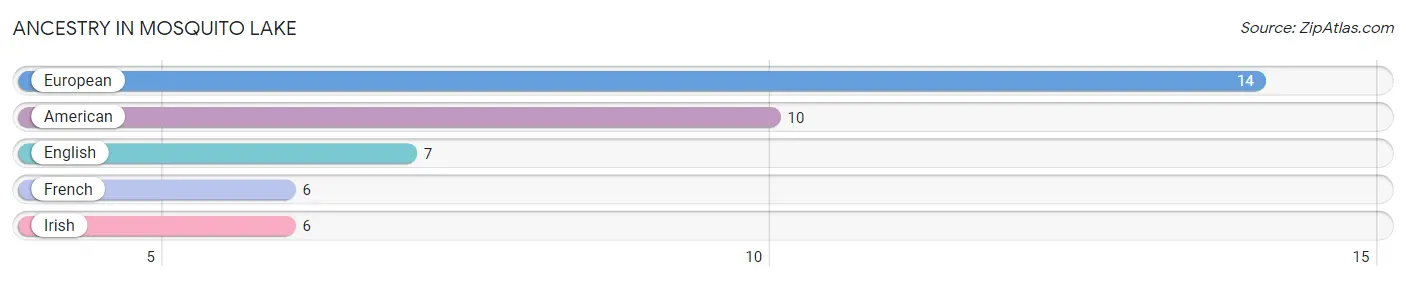
| Ancestry | # Population | % Population |
| American | 10 | 6.5% |
| English | 7 | 4.5% |
| European | 14 | 9.1% |
| French | 6 | 3.9% |
| Irish | 6 | 3.9% | View All 5 Rows |
Immigrants in Mosquito Lake

| Immigration Origin | # Population | % Population | View All 0 Rows |
Sex and Age in Mosquito Lake
Sex and Age in Mosquito Lake
The most populous age groups in Mosquito Lake are 50 to 54 Years (45 | 50.6%) for men and 50 to 54 Years (34 | 52.3%) for women.
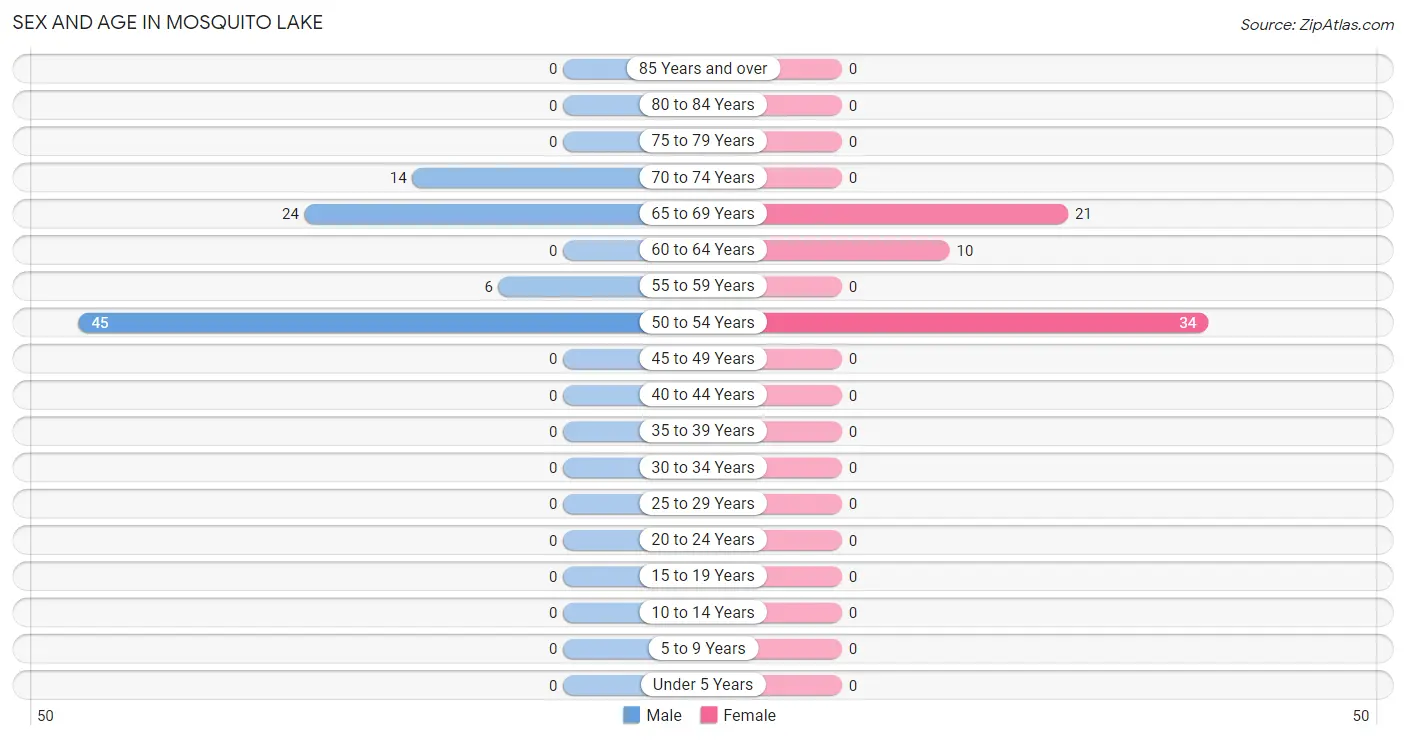
| Age Bracket | Male | Female |
| Under 5 Years | 0 (0.0%) | 0 (0.0%) |
| 5 to 9 Years | 0 (0.0%) | 0 (0.0%) |
| 10 to 14 Years | 0 (0.0%) | 0 (0.0%) |
| 15 to 19 Years | 0 (0.0%) | 0 (0.0%) |
| 20 to 24 Years | 0 (0.0%) | 0 (0.0%) |
| 25 to 29 Years | 0 (0.0%) | 0 (0.0%) |
| 30 to 34 Years | 0 (0.0%) | 0 (0.0%) |
| 35 to 39 Years | 0 (0.0%) | 0 (0.0%) |
| 40 to 44 Years | 0 (0.0%) | 0 (0.0%) |
| 45 to 49 Years | 0 (0.0%) | 0 (0.0%) |
| 50 to 54 Years | 45 (50.6%) | 34 (52.3%) |
| 55 to 59 Years | 6 (6.7%) | 0 (0.0%) |
| 60 to 64 Years | 0 (0.0%) | 10 (15.4%) |
| 65 to 69 Years | 24 (27.0%) | 21 (32.3%) |
| 70 to 74 Years | 14 (15.7%) | 0 (0.0%) |
| 75 to 79 Years | 0 (0.0%) | 0 (0.0%) |
| 80 to 84 Years | 0 (0.0%) | 0 (0.0%) |
| 85 Years and over | 0 (0.0%) | 0 (0.0%) |
| Total | 89 (100.0%) | 65 (100.0%) |
Families and Households in Mosquito Lake
Median Family Size in Mosquito Lake
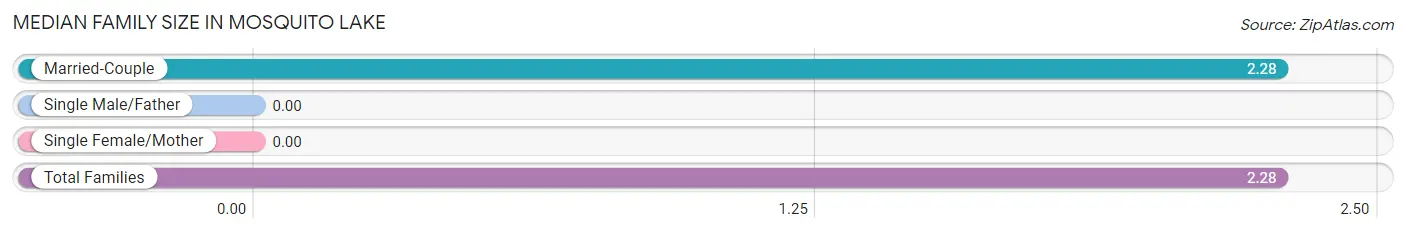
| Family Type | # Families | Family Size |
| Married-Couple | 57 (100.0%) | 2.28 |
| Single Male/Father | 0 (0.0%) | - |
| Single Female/Mother | 0 (0.0%) | - |
| Total Families | 57 (100.0%) | 2.28 |
Median Household Size in Mosquito Lake
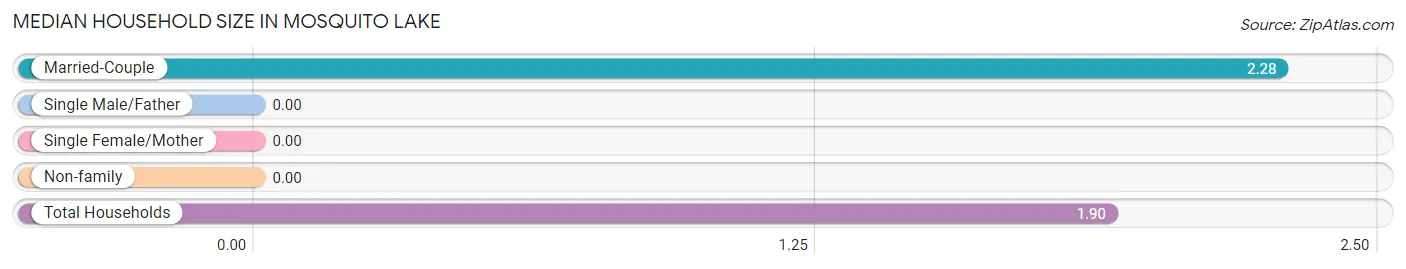
| Household Type | # Households | Household Size |
| Married-Couple | 57 (70.4%) | 2.28 |
| Single Male/Father | 0 (0.0%) | - |
| Single Female/Mother | 0 (0.0%) | - |
| Non-family | 24 (29.6%) | - |
| Total Households | 81 (100.0%) | 1.90 |
Household Size by Marriage Status in Mosquito Lake
Out of a total of 81 households in Mosquito Lake, 57 (70.4%) are family households, while 24 (29.6%) are nonfamily households. The most numerous type of family households are 2-person households, comprising 57, and the most common type of nonfamily households are 1-person households, comprising 24.
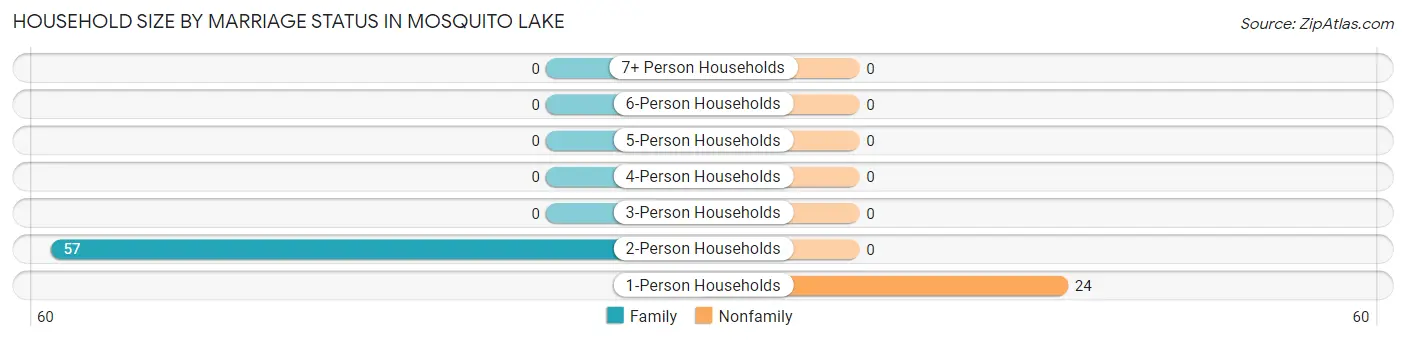
| Household Size | Family Households | Nonfamily Households |
| 1-Person Households | - | 24 (29.6%) |
| 2-Person Households | 57 (70.4%) | 0 (0.0%) |
| 3-Person Households | 0 (0.0%) | 0 (0.0%) |
| 4-Person Households | 0 (0.0%) | 0 (0.0%) |
| 5-Person Households | 0 (0.0%) | 0 (0.0%) |
| 6-Person Households | 0 (0.0%) | 0 (0.0%) |
| 7+ Person Households | 0 (0.0%) | 0 (0.0%) |
| Total | 57 (70.4%) | 24 (29.6%) |
Female Fertility in Mosquito Lake
Fertility by Age in Mosquito Lake
| Age Bracket | Women with Births | Births / 1,000 Women |
| 15 to 19 years | 0 (0.0%) | 0.0 |
| 20 to 34 years | 0 (0.0%) | 0.0 |
| 35 to 50 years | 0 (0.0%) | 0.0 |
| Total | 0 (0.0%) | 0.0 |
Fertility by Age by Marriage Status in Mosquito Lake
| Age Bracket | Married | Unmarried |
| 15 to 19 years | 0 (0.0%) | 0 (0.0%) |
| 20 to 34 years | 0 (0.0%) | 0 (0.0%) |
| 35 to 50 years | 0 (0.0%) | 0 (0.0%) |
| Total | 0 (0.0%) | 0 (0.0%) |
Fertility by Education in Mosquito Lake
| Educational Attainment | Women with Births | Births / 1,000 Women |
| Less than High School | 0 (0.0%) | 0.0 |
| High School Diploma | 0 (0.0%) | 0.0 |
| College or Associate's Degree | 0 (0.0%) | 0.0 |
| Bachelor's Degree | 0 (0.0%) | 0.0 |
| Graduate Degree | 0 (0.0%) | 0.0 |
| Total | 0 (0.0%) | 0.0 |
Fertility by Education by Marriage Status in Mosquito Lake
| Educational Attainment | Married | Unmarried |
| Less than High School | 0 (0.0%) | 0 (0.0%) |
| High School Diploma | 0 (0.0%) | 0 (0.0%) |
| College or Associate's Degree | 0 (0.0%) | 0 (0.0%) |
| Bachelor's Degree | 0 (0.0%) | 0 (0.0%) |
| Graduate Degree | 0 (0.0%) | 0 (0.0%) |
| Total | 0 (0.0%) | 0 (0.0%) |
Employment Characteristics in Mosquito Lake
Employment by Class of Employer in Mosquito Lake
Among the 88 employed individuals in Mosquito Lake, self-employed (not incorporated) (82 | 93.2%), and local government employees (6 | 6.8%) make up the most common classes of employment.
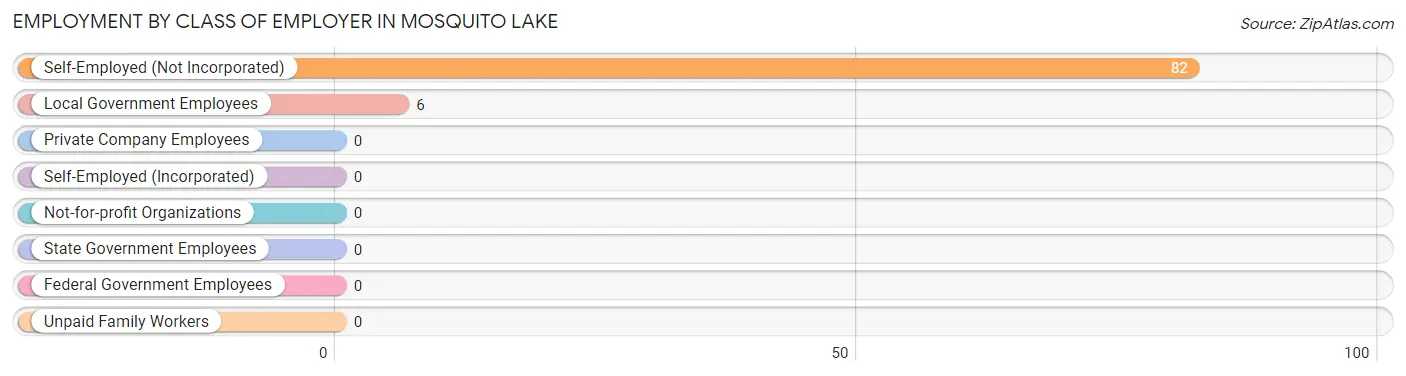
| Employer Class | # Employees | % Employees |
| Private Company Employees | 0 | 0.0% |
| Self-Employed (Incorporated) | 0 | 0.0% |
| Self-Employed (Not Incorporated) | 82 | 93.2% |
| Not-for-profit Organizations | 0 | 0.0% |
| Local Government Employees | 6 | 6.8% |
| State Government Employees | 0 | 0.0% |
| Federal Government Employees | 0 | 0.0% |
| Unpaid Family Workers | 0 | 0.0% |
| Total | 88 | 100.0% |
Employment Status by Age in Mosquito Lake
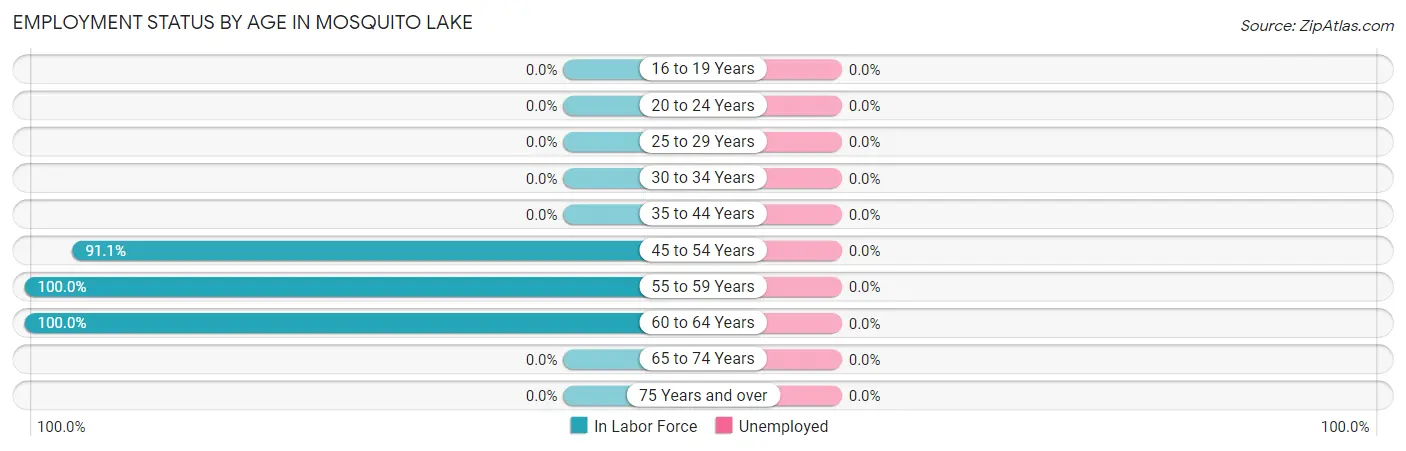
| Age Bracket | In Labor Force | Unemployed |
| 16 to 19 Years | 0 (0.0%) | 0 (0.0%) |
| 20 to 24 Years | 0 (0.0%) | 0 (0.0%) |
| 25 to 29 Years | 0 (0.0%) | 0 (0.0%) |
| 30 to 34 Years | 0 (0.0%) | 0 (0.0%) |
| 35 to 44 Years | 0 (0.0%) | 0 (0.0%) |
| 45 to 54 Years | 72 (91.1%) | 0 (0.0%) |
| 55 to 59 Years | 6 (100.0%) | 0 (0.0%) |
| 60 to 64 Years | 10 (100.0%) | 0 (0.0%) |
| 65 to 74 Years | 0 (0.0%) | 0 (0.0%) |
| 75 Years and over | 0 (0.0%) | 0 (0.0%) |
| Total | 88 (57.1%) | 0 (0.0%) |
Employment Status by Educational Attainment in Mosquito Lake
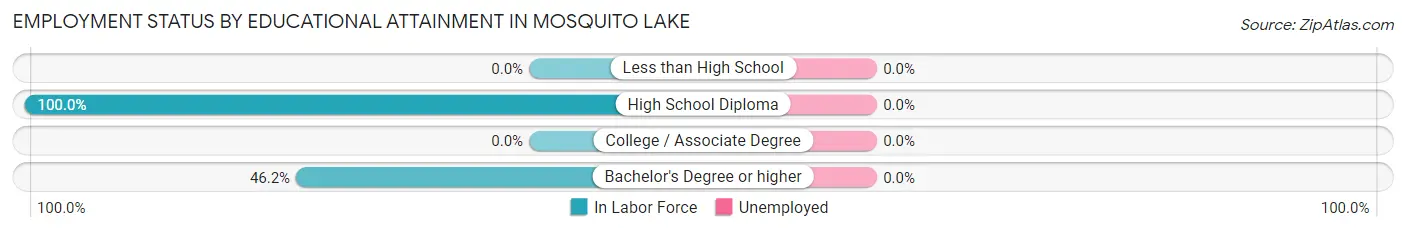
| Educational Attainment | In Labor Force | Unemployed |
| Less than High School | 0 (0.0%) | 0 (0.0%) |
| High School Diploma | 82 (100.0%) | 0 (0.0%) |
| College / Associate Degree | 0 (0.0%) | 0 (0.0%) |
| Bachelor's Degree or higher | 6 (46.2%) | 0 (0.0%) |
| Total | 88 (92.6%) | 0 (0.0%) |
Employment Occupations by Sex in Mosquito Lake
Management, Business, Science and Arts Occupations
The most common Management, Business, Science and Arts occupations in Mosquito Lake are , and Business & Financial (6 | 6.8%).
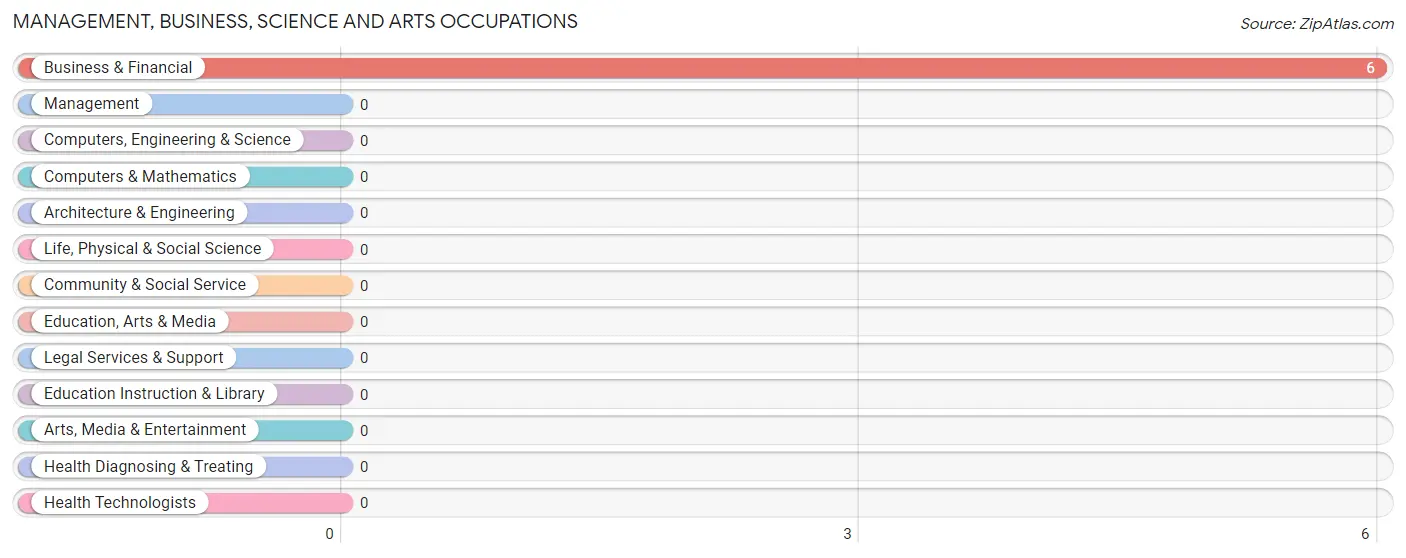
Management, Business, Science and Arts Occupations by Sex
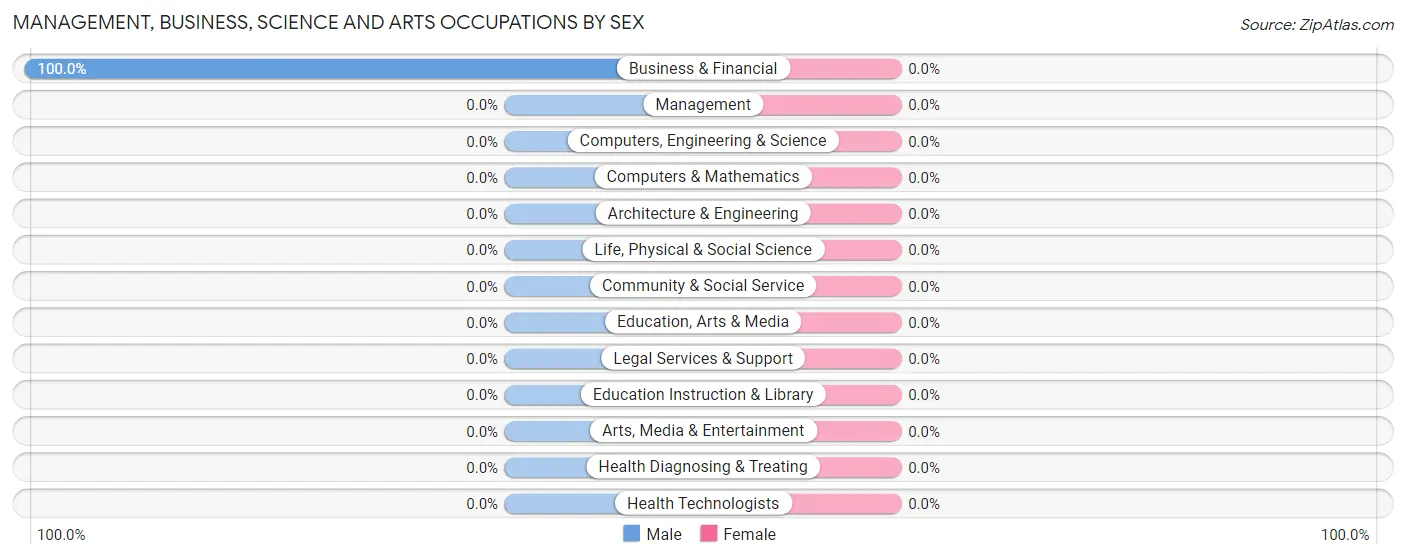
| Occupation | Male | Female |
| Management | 0 (0.0%) | 0 (0.0%) |
| Business & Financial | 6 (100.0%) | 0 (0.0%) |
| Computers, Engineering & Science | 0 (0.0%) | 0 (0.0%) |
| Computers & Mathematics | 0 (0.0%) | 0 (0.0%) |
| Architecture & Engineering | 0 (0.0%) | 0 (0.0%) |
| Life, Physical & Social Science | 0 (0.0%) | 0 (0.0%) |
| Community & Social Service | 0 (0.0%) | 0 (0.0%) |
| Education, Arts & Media | 0 (0.0%) | 0 (0.0%) |
| Legal Services & Support | 0 (0.0%) | 0 (0.0%) |
| Education Instruction & Library | 0 (0.0%) | 0 (0.0%) |
| Arts, Media & Entertainment | 0 (0.0%) | 0 (0.0%) |
| Health Diagnosing & Treating | 0 (0.0%) | 0 (0.0%) |
| Health Technologists | 0 (0.0%) | 0 (0.0%) |
| Total (Category) | 6 (100.0%) | 0 (0.0%) |
| Total (Overall) | 51 (58.0%) | 37 (42.0%) |
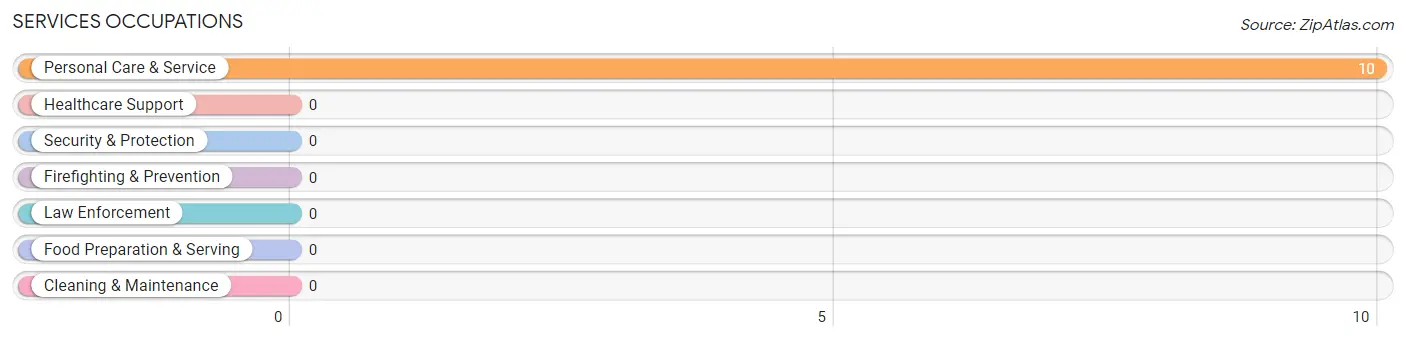
Services Occupations
The most common Services occupations in Mosquito Lake are , and Personal Care & Service (10 | 11.4%).
Services Occupations by Sex
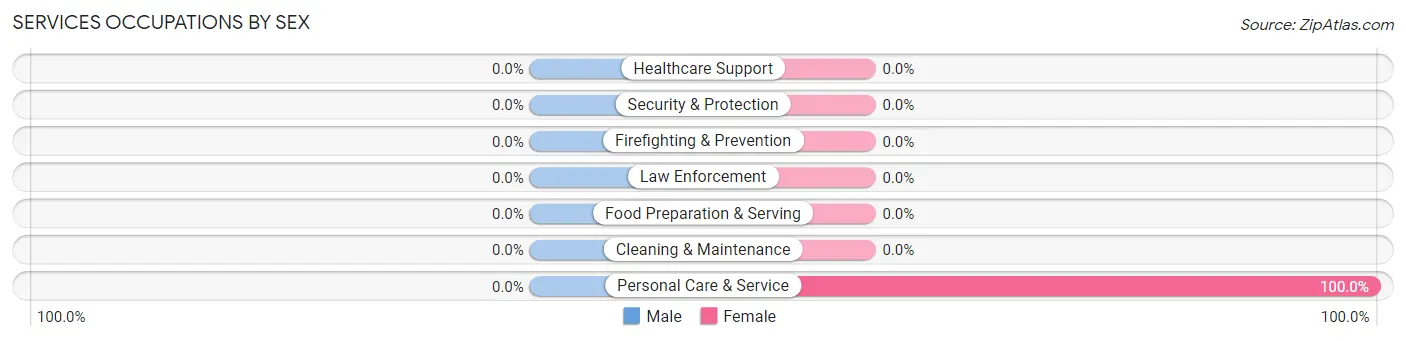
| Occupation | Male | Female |
| Healthcare Support | 0 (0.0%) | 0 (0.0%) |
| Security & Protection | 0 (0.0%) | 0 (0.0%) |
| Firefighting & Prevention | 0 (0.0%) | 0 (0.0%) |
| Law Enforcement | 0 (0.0%) | 0 (0.0%) |
| Food Preparation & Serving | 0 (0.0%) | 0 (0.0%) |
| Cleaning & Maintenance | 0 (0.0%) | 0 (0.0%) |
| Personal Care & Service | 0 (0.0%) | 10 (100.0%) |
| Total (Category) | 0 (0.0%) | 10 (100.0%) |
| Total (Overall) | 51 (58.0%) | 37 (42.0%) |
Sales and Office Occupations
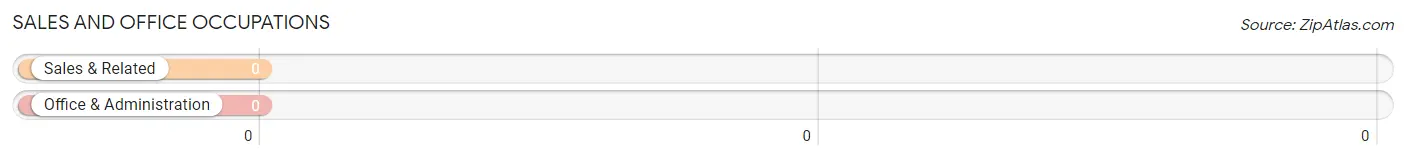
Sales and Office Occupations by Sex
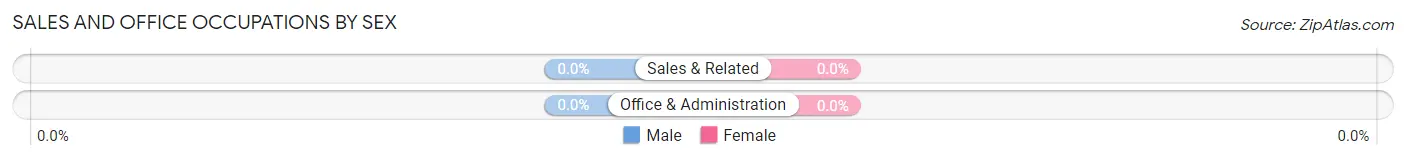
| Occupation | Male | Female |
| Sales & Related | 0 (0.0%) | 0 (0.0%) |
| Office & Administration | 0 (0.0%) | 0 (0.0%) |
| Total (Category) | 0 (0.0%) | 0 (0.0%) |
| Total (Overall) | 51 (58.0%) | 37 (42.0%) |
Natural Resources, Construction and Maintenance Occupations
The most common Natural Resources, Construction and Maintenance occupations in Mosquito Lake are Construction & Extraction (45 | 51.1%), and Farming, Fishing & Forestry (27 | 30.7%).
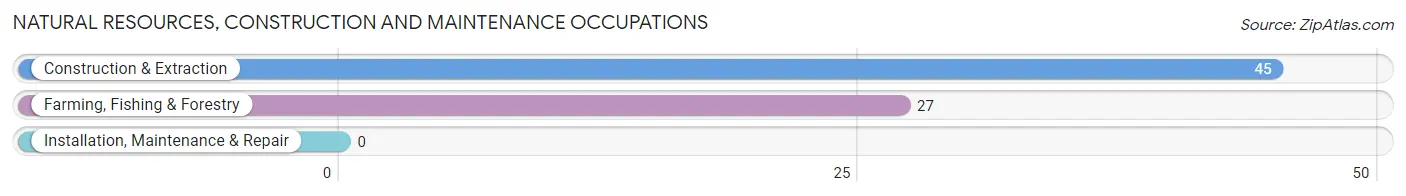
Natural Resources, Construction and Maintenance Occupations by Sex
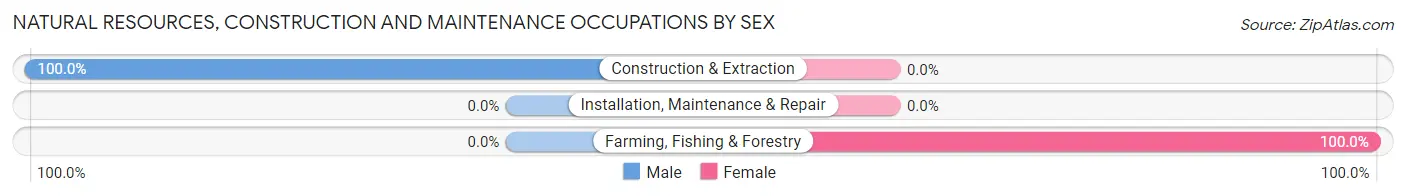
| Occupation | Male | Female |
| Farming, Fishing & Forestry | 0 (0.0%) | 27 (100.0%) |
| Construction & Extraction | 45 (100.0%) | 0 (0.0%) |
| Installation, Maintenance & Repair | 0 (0.0%) | 0 (0.0%) |
| Total (Category) | 45 (62.5%) | 27 (37.5%) |
| Total (Overall) | 51 (58.0%) | 37 (42.0%) |
Production, Transportation and Moving Occupations
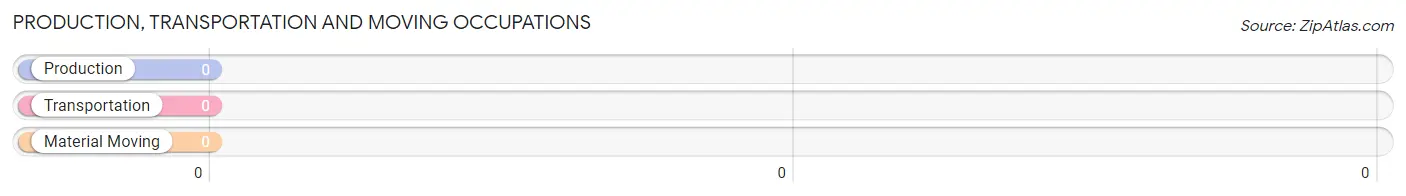
Production, Transportation and Moving Occupations by Sex
| Occupation | Male | Female |
| Production | 0 (0.0%) | 0 (0.0%) |
| Transportation | 0 (0.0%) | 0 (0.0%) |
| Material Moving | 0 (0.0%) | 0 (0.0%) |
| Total (Category) | 0 (0.0%) | 0 (0.0%) |
| Total (Overall) | 51 (58.0%) | 37 (42.0%) |
Employment Industries by Sex in Mosquito Lake
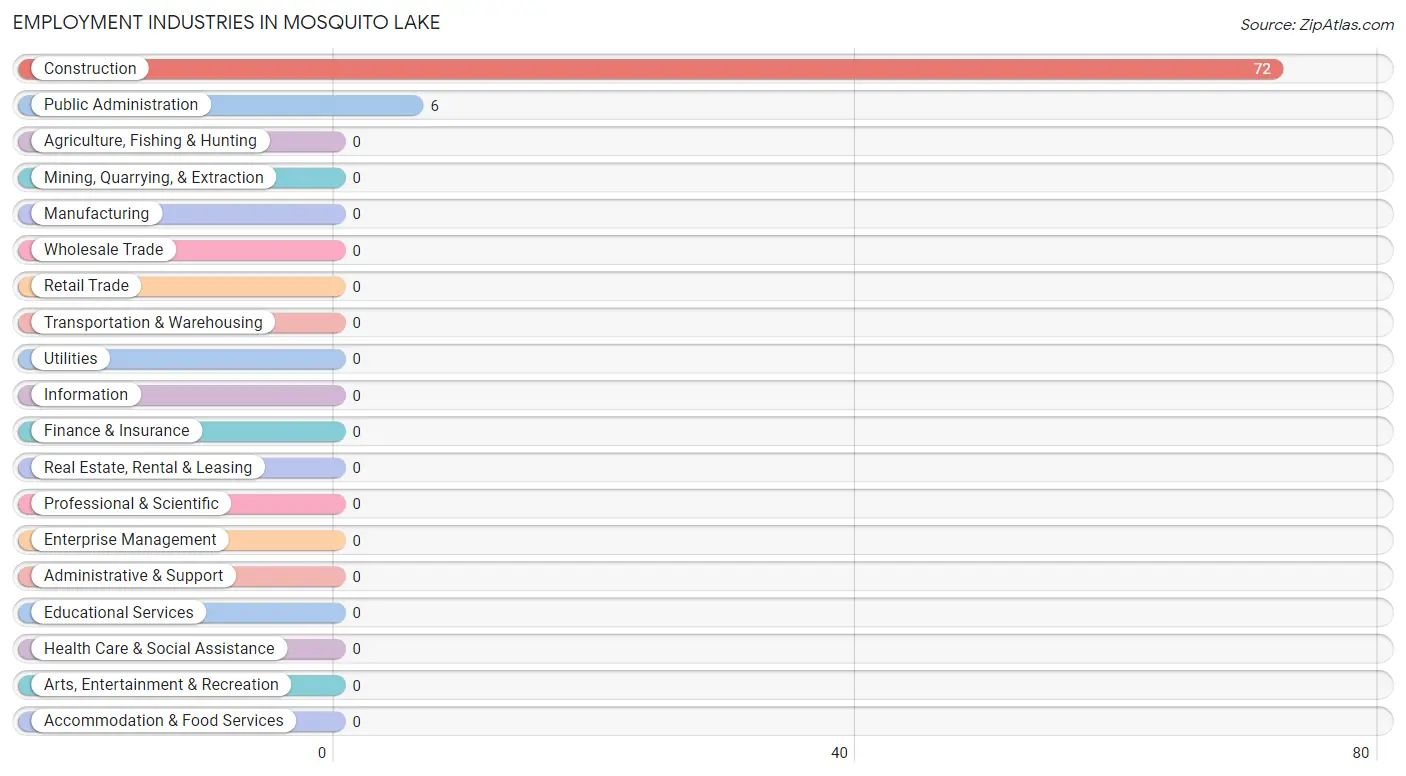
Employment Industries in Mosquito Lake
The major employment industries in Mosquito Lake include Construction (72 | 81.8%), and Public Administration (6 | 6.8%).
Employment Industries by Sex in Mosquito Lake
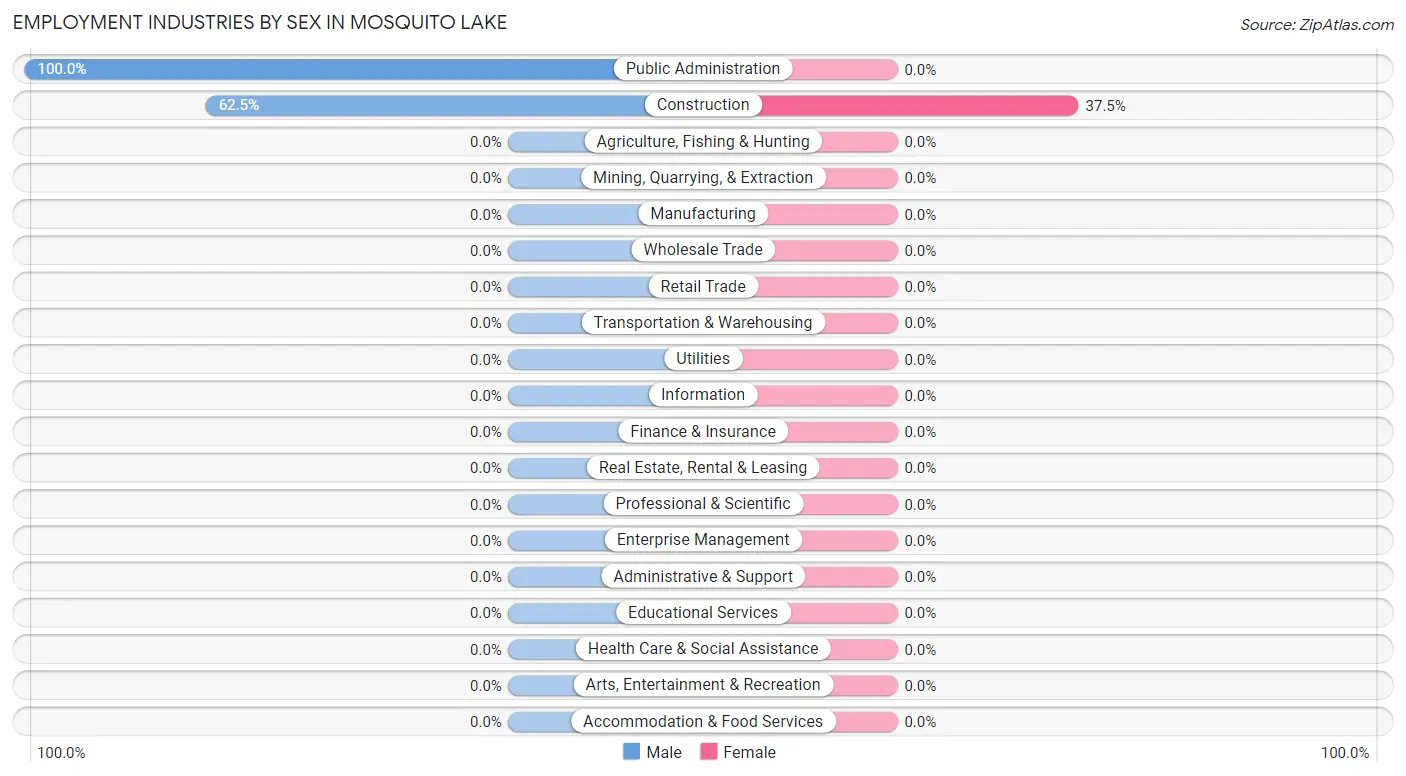
| Industry | Male | Female |
| Agriculture, Fishing & Hunting | 0 (0.0%) | 0 (0.0%) |
| Mining, Quarrying, & Extraction | 0 (0.0%) | 0 (0.0%) |
| Construction | 45 (62.5%) | 27 (37.5%) |
| Manufacturing | 0 (0.0%) | 0 (0.0%) |
| Wholesale Trade | 0 (0.0%) | 0 (0.0%) |
| Retail Trade | 0 (0.0%) | 0 (0.0%) |
| Transportation & Warehousing | 0 (0.0%) | 0 (0.0%) |
| Utilities | 0 (0.0%) | 0 (0.0%) |
| Information | 0 (0.0%) | 0 (0.0%) |
| Finance & Insurance | 0 (0.0%) | 0 (0.0%) |
| Real Estate, Rental & Leasing | 0 (0.0%) | 0 (0.0%) |
| Professional & Scientific | 0 (0.0%) | 0 (0.0%) |
| Enterprise Management | 0 (0.0%) | 0 (0.0%) |
| Administrative & Support | 0 (0.0%) | 0 (0.0%) |
| Educational Services | 0 (0.0%) | 0 (0.0%) |
| Health Care & Social Assistance | 0 (0.0%) | 0 (0.0%) |
| Arts, Entertainment & Recreation | 0 (0.0%) | 0 (0.0%) |
| Accommodation & Food Services | 0 (0.0%) | 0 (0.0%) |
| Public Administration | 6 (100.0%) | 0 (0.0%) |
| Total | 51 (58.0%) | 37 (42.0%) |
Education in Mosquito Lake
School Enrollment in Mosquito Lake
| School Level | # Students | % Students |
| Nursery / Preschool | 0 | 0.0% |
| Kindergarten | 0 | 0.0% |
| Elementary School | 0 | 0.0% |
| Middle School | 0 | 0.0% |
| High School | 0 | 0.0% |
| College / Undergraduate | 0 | 0.0% |
| Graduate / Professional | 0 | 0.0% |
| Total | 0 | 0.0% |
School Enrollment by Age by Funding Source in Mosquito Lake
| Age Bracket | Public School | Private School |
| 3 to 4 Year Olds | 0 (0.0%) | 0 (0.0%) |
| 5 to 9 Year Old | 0 (0.0%) | 0 (0.0%) |
| 10 to 14 Year Olds | 0 (0.0%) | 0 (0.0%) |
| 15 to 17 Year Olds | 0 (0.0%) | 0 (0.0%) |
| 18 to 19 Year Olds | 0 (0.0%) | 0 (0.0%) |
| 20 to 24 Year Olds | 0 (0.0%) | 0 (0.0%) |
| 25 to 34 Year Olds | 0 (0.0%) | 0 (0.0%) |
| 35 Years and over | 0 (0.0%) | 0 (0.0%) |
| Total | 0 (0.0%) | 0 (0.0%) |
Educational Attainment by Field of Study in Mosquito Lake
Bio, nature & agricultural (24 | 47.1%), arts & humanities (14 | 27.5%), engineering (7 | 13.7%), and psychology (6 | 11.8%) are the most common fields of study among 51 individuals in Mosquito Lake who have obtained a bachelor's degree or higher.
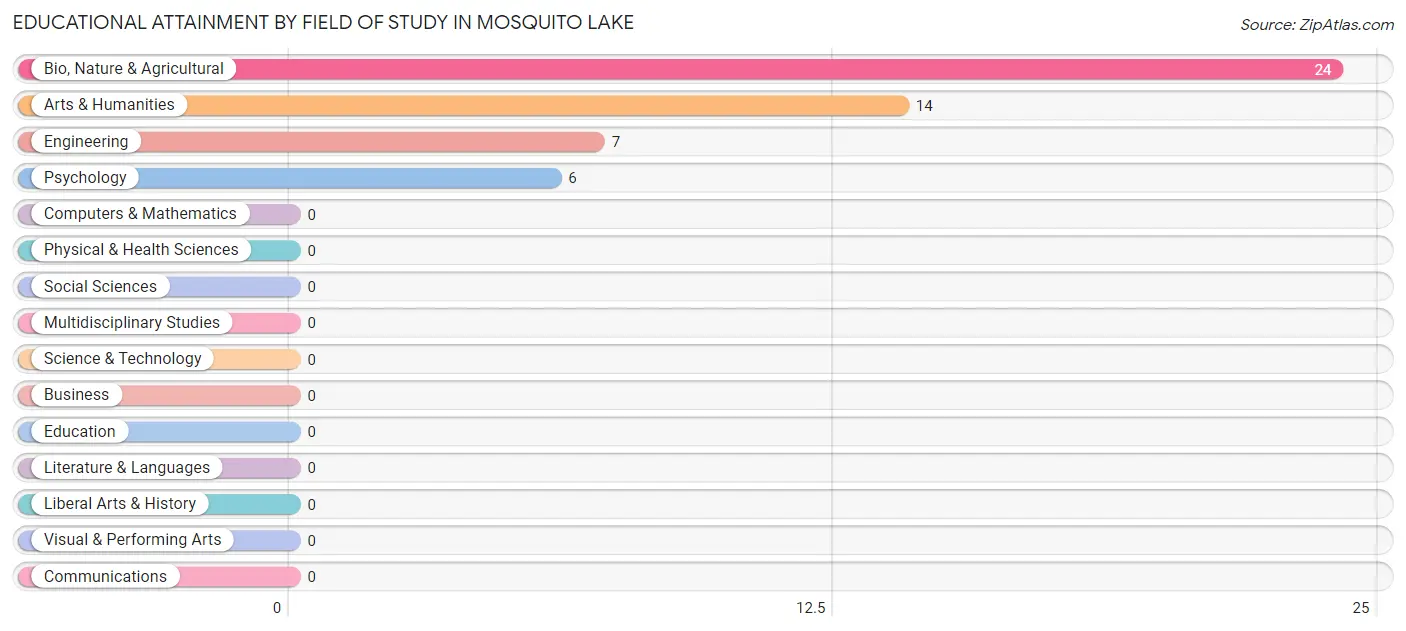
| Field of Study | # Graduates | % Graduates |
| Computers & Mathematics | 0 | 0.0% |
| Bio, Nature & Agricultural | 24 | 47.1% |
| Physical & Health Sciences | 0 | 0.0% |
| Psychology | 6 | 11.8% |
| Social Sciences | 0 | 0.0% |
| Engineering | 7 | 13.7% |
| Multidisciplinary Studies | 0 | 0.0% |
| Science & Technology | 0 | 0.0% |
| Business | 0 | 0.0% |
| Education | 0 | 0.0% |
| Literature & Languages | 0 | 0.0% |
| Liberal Arts & History | 0 | 0.0% |
| Visual & Performing Arts | 0 | 0.0% |
| Communications | 0 | 0.0% |
| Arts & Humanities | 14 | 27.5% |
| Total | 51 | 100.0% |
Transportation & Commute in Mosquito Lake
Vehicle Availability by Sex in Mosquito Lake
The most prevalent vehicle ownership categories in Mosquito Lake are males with 3 vehicles (45, accounting for 88.2%) and females with 3 vehicles (27, making up 121.6%).
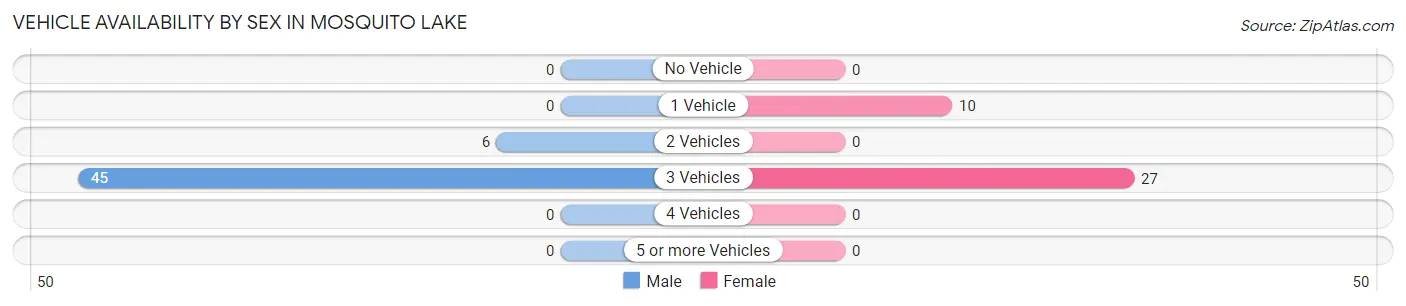
| Vehicles Available | Male | Female |
| No Vehicle | 0 (0.0%) | 0 (0.0%) |
| 1 Vehicle | 0 (0.0%) | 10 (27.0%) |
| 2 Vehicles | 6 (11.8%) | 0 (0.0%) |
| 3 Vehicles | 45 (88.2%) | 27 (73.0%) |
| 4 Vehicles | 0 (0.0%) | 0 (0.0%) |
| 5 or more Vehicles | 0 (0.0%) | 0 (0.0%) |
| Total | 51 (100.0%) | 37 (100.0%) |
Commute Time in Mosquito Lake
The most frequently occuring commute durations in Mosquito Lake are less than 5 minutes (45 commuters, 51.1%), 15 to 19 minutes (27 commuters, 30.7%), and 30 to 34 minutes (10 commuters, 11.4%).
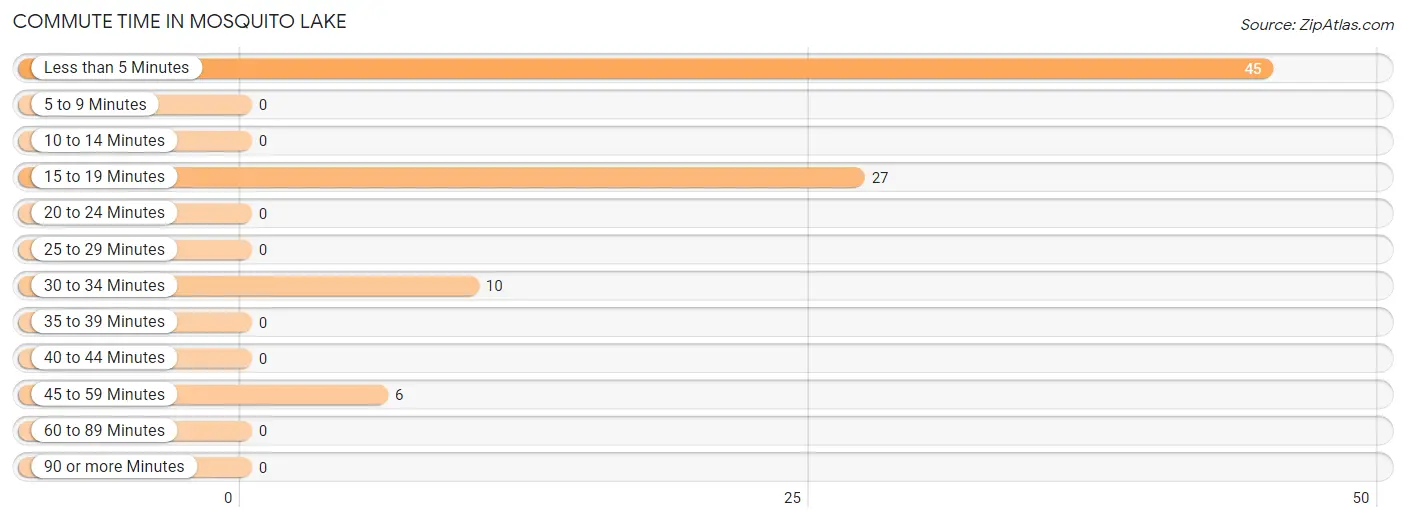
| Commute Time | # Commuters | % Commuters |
| Less than 5 Minutes | 45 | 51.1% |
| 5 to 9 Minutes | 0 | 0.0% |
| 10 to 14 Minutes | 0 | 0.0% |
| 15 to 19 Minutes | 27 | 30.7% |
| 20 to 24 Minutes | 0 | 0.0% |
| 25 to 29 Minutes | 0 | 0.0% |
| 30 to 34 Minutes | 10 | 11.4% |
| 35 to 39 Minutes | 0 | 0.0% |
| 40 to 44 Minutes | 0 | 0.0% |
| 45 to 59 Minutes | 6 | 6.8% |
| 60 to 89 Minutes | 0 | 0.0% |
| 90 or more Minutes | 0 | 0.0% |
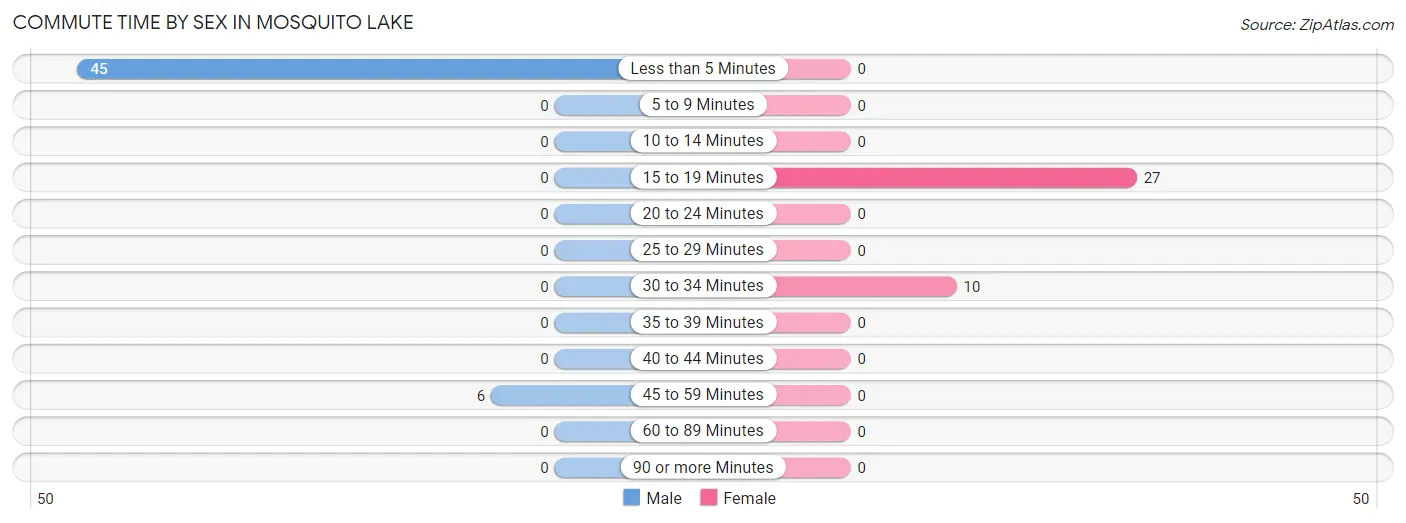
Commute Time by Sex in Mosquito Lake
The most common commute times in Mosquito Lake are less than 5 minutes (45 commuters, 88.2%) for males and 15 to 19 minutes (27 commuters, 73.0%) for females.
| Commute Time | Male | Female |
| Less than 5 Minutes | 45 (88.2%) | 0 (0.0%) |
| 5 to 9 Minutes | 0 (0.0%) | 0 (0.0%) |
| 10 to 14 Minutes | 0 (0.0%) | 0 (0.0%) |
| 15 to 19 Minutes | 0 (0.0%) | 27 (73.0%) |
| 20 to 24 Minutes | 0 (0.0%) | 0 (0.0%) |
| 25 to 29 Minutes | 0 (0.0%) | 0 (0.0%) |
| 30 to 34 Minutes | 0 (0.0%) | 10 (27.0%) |
| 35 to 39 Minutes | 0 (0.0%) | 0 (0.0%) |
| 40 to 44 Minutes | 0 (0.0%) | 0 (0.0%) |
| 45 to 59 Minutes | 6 (11.8%) | 0 (0.0%) |
| 60 to 89 Minutes | 0 (0.0%) | 0 (0.0%) |
| 90 or more Minutes | 0 (0.0%) | 0 (0.0%) |
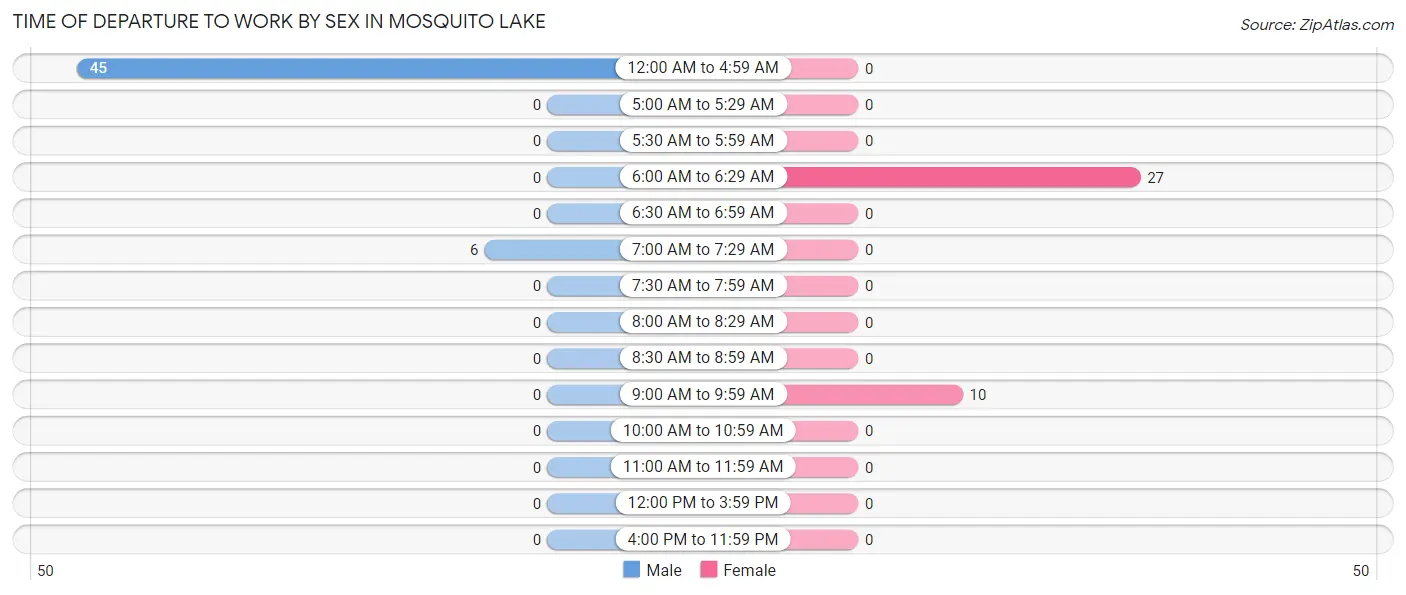
Time of Departure to Work by Sex in Mosquito Lake
The most frequent times of departure to work in Mosquito Lake are 12:00 AM to 4:59 AM (45, 88.2%) for males and 6:00 AM to 6:29 AM (27, 73.0%) for females.
| Time of Departure | Male | Female |
| 12:00 AM to 4:59 AM | 45 (88.2%) | 0 (0.0%) |
| 5:00 AM to 5:29 AM | 0 (0.0%) | 0 (0.0%) |
| 5:30 AM to 5:59 AM | 0 (0.0%) | 0 (0.0%) |
| 6:00 AM to 6:29 AM | 0 (0.0%) | 27 (73.0%) |
| 6:30 AM to 6:59 AM | 0 (0.0%) | 0 (0.0%) |
| 7:00 AM to 7:29 AM | 6 (11.8%) | 0 (0.0%) |
| 7:30 AM to 7:59 AM | 0 (0.0%) | 0 (0.0%) |
| 8:00 AM to 8:29 AM | 0 (0.0%) | 0 (0.0%) |
| 8:30 AM to 8:59 AM | 0 (0.0%) | 0 (0.0%) |
| 9:00 AM to 9:59 AM | 0 (0.0%) | 10 (27.0%) |
| 10:00 AM to 10:59 AM | 0 (0.0%) | 0 (0.0%) |
| 11:00 AM to 11:59 AM | 0 (0.0%) | 0 (0.0%) |
| 12:00 PM to 3:59 PM | 0 (0.0%) | 0 (0.0%) |
| 4:00 PM to 11:59 PM | 0 (0.0%) | 0 (0.0%) |
| Total | 51 (100.0%) | 37 (100.0%) |
Housing Occupancy in Mosquito Lake
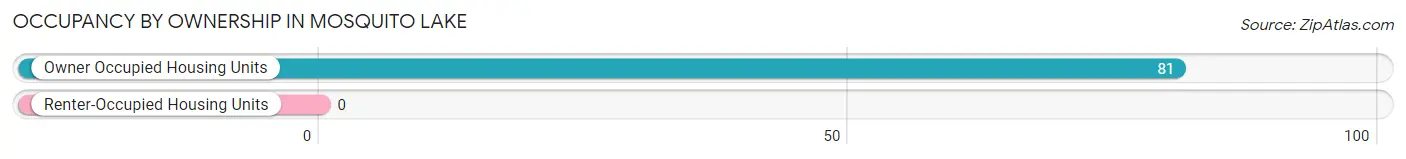
Occupancy by Ownership in Mosquito Lake
Of the total 81 dwellings in Mosquito Lake, owner-occupied units account for 81 (100.0%), while renter-occupied units make up 0 (0.0%).
| Occupancy | # Housing Units | % Housing Units |
| Owner Occupied Housing Units | 81 | 100.0% |
| Renter-Occupied Housing Units | 0 | 0.0% |
| Total Occupied Housing Units | 81 | 100.0% |
Occupancy by Household Size in Mosquito Lake
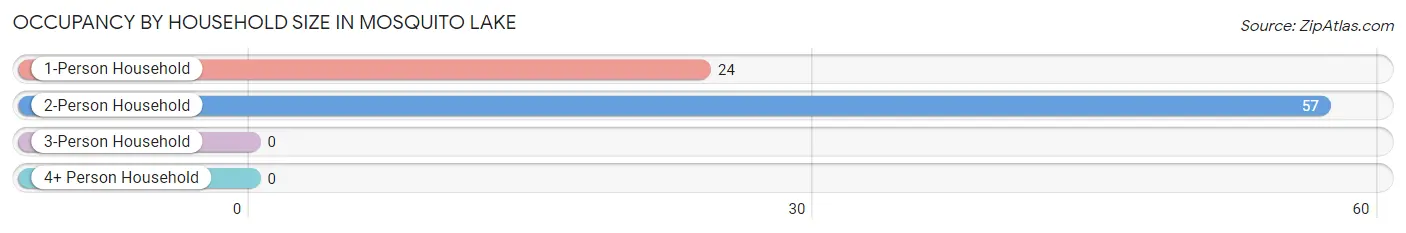
| Household Size | # Housing Units | % Housing Units |
| 1-Person Household | 24 | 29.6% |
| 2-Person Household | 57 | 70.4% |
| 3-Person Household | 0 | 0.0% |
| 4+ Person Household | 0 | 0.0% |
| Total Housing Units | 81 | 100.0% |
Occupancy by Ownership by Household Size in Mosquito Lake
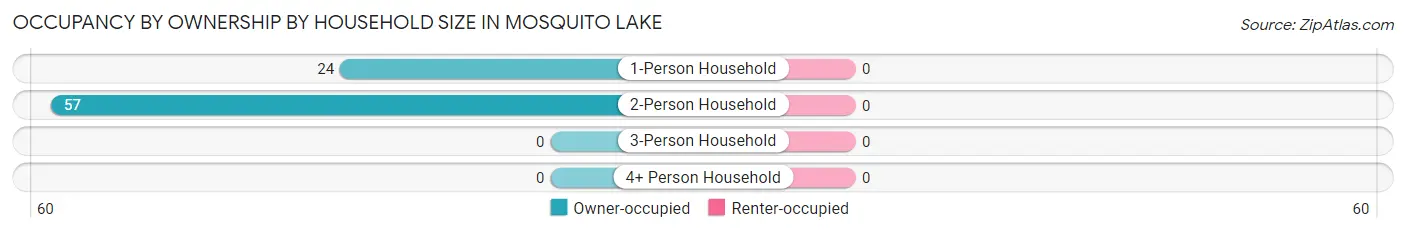
| Household Size | Owner-occupied | Renter-occupied |
| 1-Person Household | 24 (100.0%) | 0 (0.0%) |
| 2-Person Household | 57 (100.0%) | 0 (0.0%) |
| 3-Person Household | 0 (0.0%) | 0 (0.0%) |
| 4+ Person Household | 0 (0.0%) | 0 (0.0%) |
| Total Housing Units | 81 (100.0%) | 0 (0.0%) |
Occupancy by Educational Attainment in Mosquito Lake
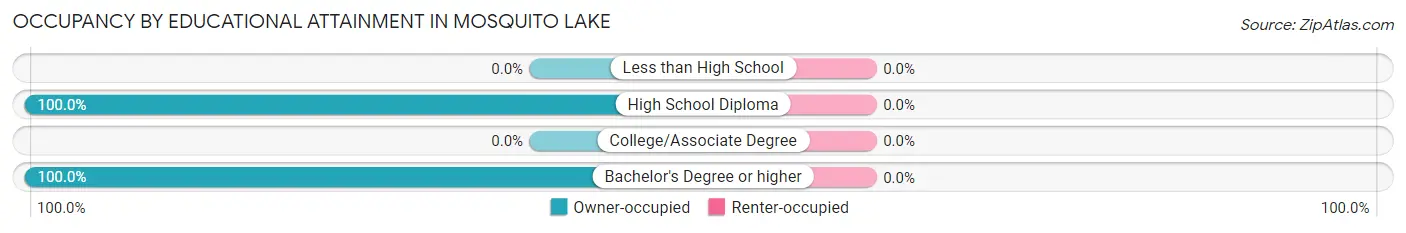
| Household Size | Owner-occupied | Renter-occupied |
| Less than High School | 0 (0.0%) | 0 (0.0%) |
| High School Diploma | 37 (100.0%) | 0 (0.0%) |
| College/Associate Degree | 0 (0.0%) | 0 (0.0%) |
| Bachelor's Degree or higher | 44 (100.0%) | 0 (0.0%) |
Occupancy by Age of Householder in Mosquito Lake
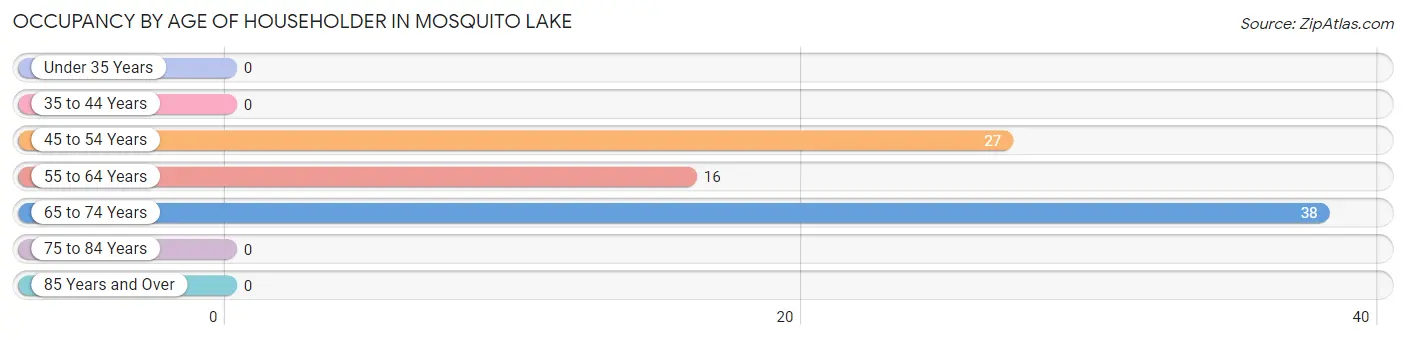
| Age Bracket | # Households | % Households |
| Under 35 Years | 0 | 0.0% |
| 35 to 44 Years | 0 | 0.0% |
| 45 to 54 Years | 27 | 33.3% |
| 55 to 64 Years | 16 | 19.8% |
| 65 to 74 Years | 38 | 46.9% |
| 75 to 84 Years | 0 | 0.0% |
| 85 Years and Over | 0 | 0.0% |
| Total | 81 | 100.0% |
Housing Finances in Mosquito Lake
Median Income by Occupancy in Mosquito Lake
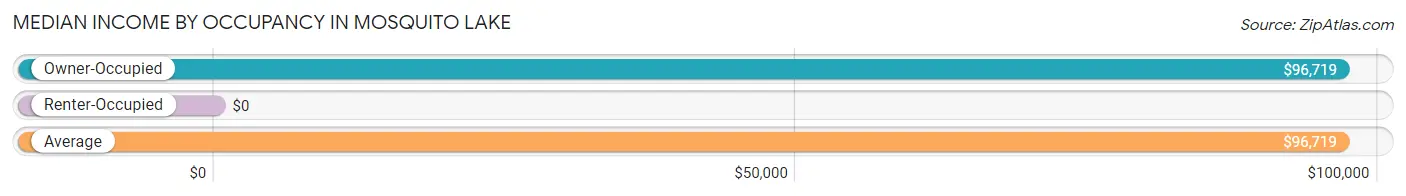
| Occupancy Type | # Households | Median Income |
| Owner-Occupied | 81 (100.0%) | $96,719 |
| Renter-Occupied | 0 (0.0%) | $0 |
| Average | 81 (100.0%) | $96,719 |
Occupancy by Householder Income Bracket in Mosquito Lake
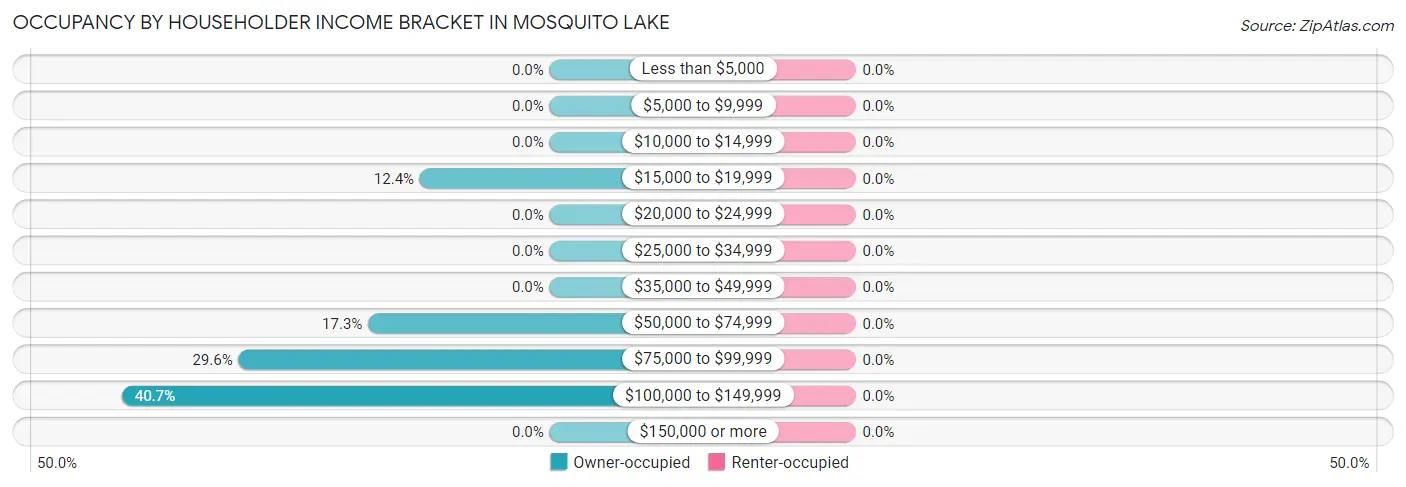
| Income Bracket | Owner-occupied | Renter-occupied |
| Less than $5,000 | 0 (0.0%) | 0 (0.0%) |
| $5,000 to $9,999 | 0 (0.0%) | 0 (0.0%) |
| $10,000 to $14,999 | 0 (0.0%) | 0 (0.0%) |
| $15,000 to $19,999 | 10 (12.3%) | 0 (0.0%) |
| $20,000 to $24,999 | 0 (0.0%) | 0 (0.0%) |
| $25,000 to $34,999 | 0 (0.0%) | 0 (0.0%) |
| $35,000 to $49,999 | 0 (0.0%) | 0 (0.0%) |
| $50,000 to $74,999 | 14 (17.3%) | 0 (0.0%) |
| $75,000 to $99,999 | 24 (29.6%) | 0 (0.0%) |
| $100,000 to $149,999 | 33 (40.7%) | 0 (0.0%) |
| $150,000 or more | 0 (0.0%) | 0 (0.0%) |
| Total | 81 (100.0%) | 0 (0.0%) |
Monthly Housing Cost Tiers in Mosquito Lake
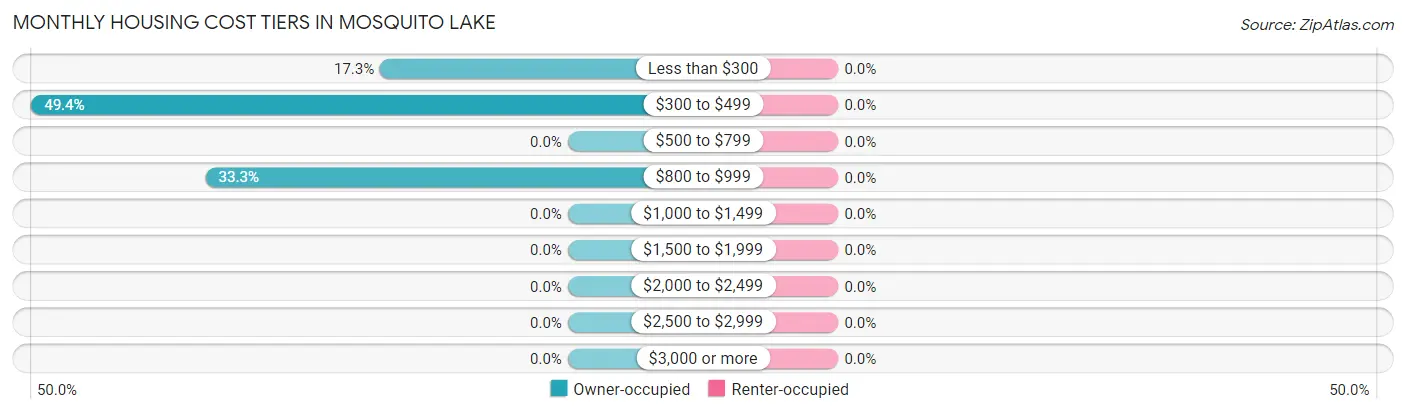
| Monthly Cost | Owner-occupied | Renter-occupied |
| Less than $300 | 14 (17.3%) | 0 (0.0%) |
| $300 to $499 | 40 (49.4%) | 0 (0.0%) |
| $500 to $799 | 0 (0.0%) | 0 (0.0%) |
| $800 to $999 | 27 (33.3%) | 0 (0.0%) |
| $1,000 to $1,499 | 0 (0.0%) | 0 (0.0%) |
| $1,500 to $1,999 | 0 (0.0%) | 0 (0.0%) |
| $2,000 to $2,499 | 0 (0.0%) | 0 (0.0%) |
| $2,500 to $2,999 | 0 (0.0%) | 0 (0.0%) |
| $3,000 or more | 0 (0.0%) | 0 (0.0%) |
| Total | 81 (100.0%) | 0 (0.0%) |
Physical Housing Characteristics in Mosquito Lake
Housing Structures in Mosquito Lake
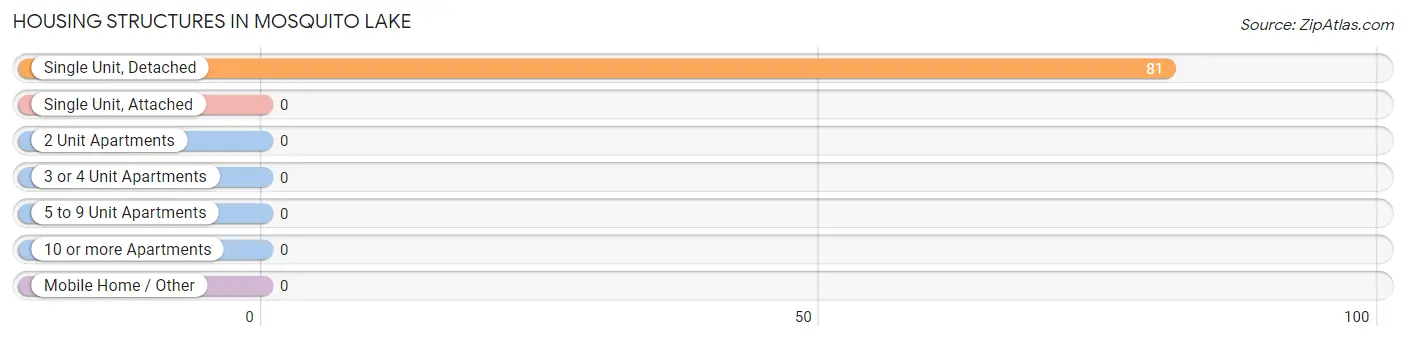
| Structure Type | # Housing Units | % Housing Units |
| Single Unit, Detached | 81 | 100.0% |
| Single Unit, Attached | 0 | 0.0% |
| 2 Unit Apartments | 0 | 0.0% |
| 3 or 4 Unit Apartments | 0 | 0.0% |
| 5 to 9 Unit Apartments | 0 | 0.0% |
| 10 or more Apartments | 0 | 0.0% |
| Mobile Home / Other | 0 | 0.0% |
| Total | 81 | 100.0% |
Housing Structures by Occupancy in Mosquito Lake
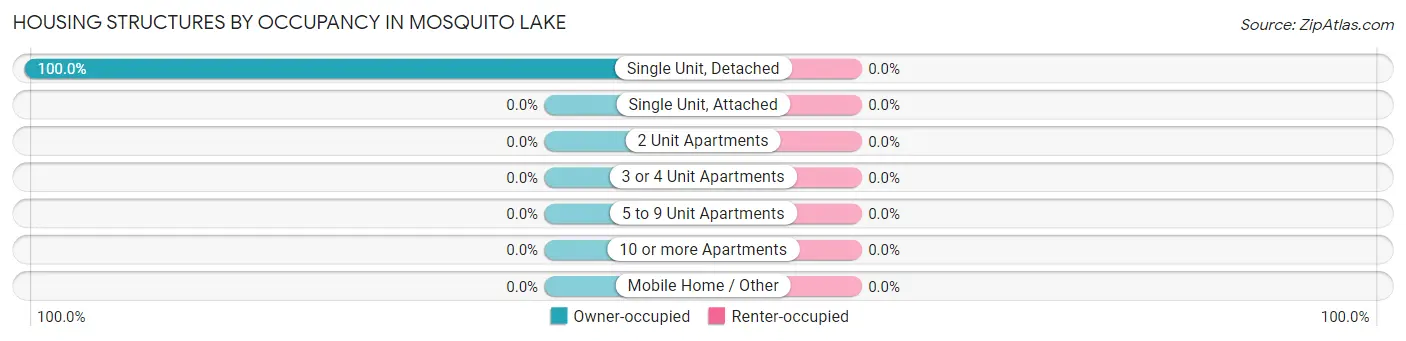
| Structure Type | Owner-occupied | Renter-occupied |
| Single Unit, Detached | 81 (100.0%) | 0 (0.0%) |
| Single Unit, Attached | 0 (0.0%) | 0 (0.0%) |
| 2 Unit Apartments | 0 (0.0%) | 0 (0.0%) |
| 3 or 4 Unit Apartments | 0 (0.0%) | 0 (0.0%) |
| 5 to 9 Unit Apartments | 0 (0.0%) | 0 (0.0%) |
| 10 or more Apartments | 0 (0.0%) | 0 (0.0%) |
| Mobile Home / Other | 0 (0.0%) | 0 (0.0%) |
| Total | 81 (100.0%) | 0 (0.0%) |
Housing Structures by Number of Rooms in Mosquito Lake
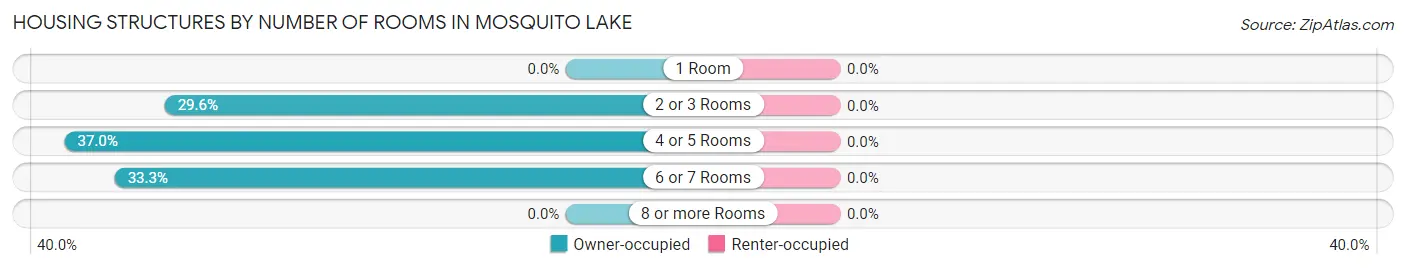
| Number of Rooms | Owner-occupied | Renter-occupied |
| 1 Room | 0 (0.0%) | 0 (0.0%) |
| 2 or 3 Rooms | 24 (29.6%) | 0 (0.0%) |
| 4 or 5 Rooms | 30 (37.0%) | 0 (0.0%) |
| 6 or 7 Rooms | 27 (33.3%) | 0 (0.0%) |
| 8 or more Rooms | 0 (0.0%) | 0 (0.0%) |
| Total | 81 (100.0%) | 0 (0.0%) |
Housing Structure by Heating Type in Mosquito Lake
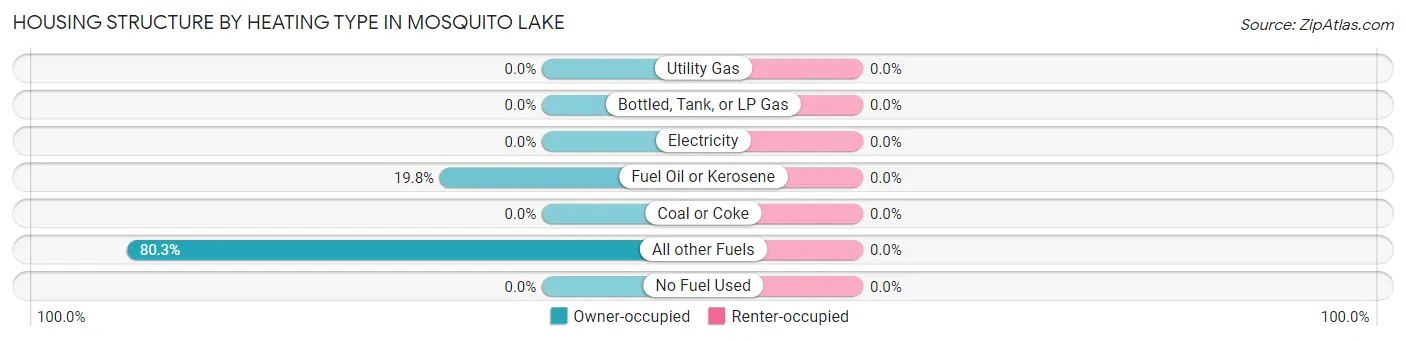
| Heating Type | Owner-occupied | Renter-occupied |
| Utility Gas | 0 (0.0%) | 0 (0.0%) |
| Bottled, Tank, or LP Gas | 0 (0.0%) | 0 (0.0%) |
| Electricity | 0 (0.0%) | 0 (0.0%) |
| Fuel Oil or Kerosene | 16 (19.8%) | 0 (0.0%) |
| Coal or Coke | 0 (0.0%) | 0 (0.0%) |
| All other Fuels | 65 (80.2%) | 0 (0.0%) |
| No Fuel Used | 0 (0.0%) | 0 (0.0%) |
| Total | 81 (100.0%) | 0 (0.0%) |
Household Vehicle Usage in Mosquito Lake
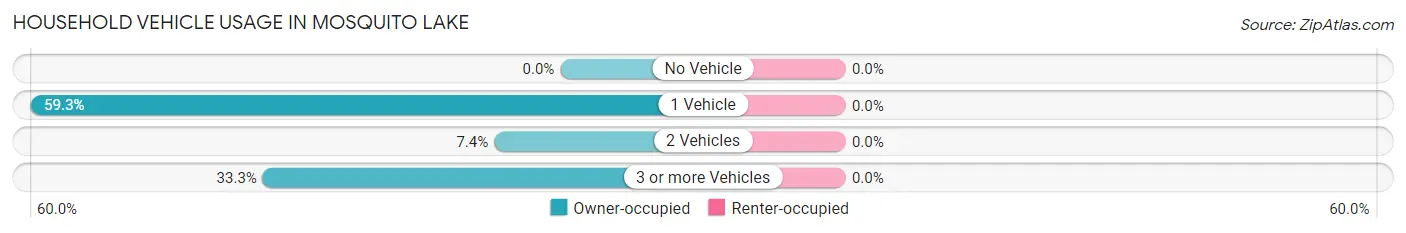
| Vehicles per Household | Owner-occupied | Renter-occupied |
| No Vehicle | 0 (0.0%) | 0 (0.0%) |
| 1 Vehicle | 48 (59.3%) | 0 (0.0%) |
| 2 Vehicles | 6 (7.4%) | 0 (0.0%) |
| 3 or more Vehicles | 27 (33.3%) | 0 (0.0%) |
| Total | 81 (100.0%) | 0 (0.0%) |
Real Estate & Mortgages in Mosquito Lake
Real Estate and Mortgage Overview in Mosquito Lake
| Characteristic | Without Mortgage | With Mortgage |
| Housing Units | 81 | 0 |
| Median Property Value | - | - |
| Median Household Income | $96,719 | $0 |
| Monthly Housing Costs | $416 | $0 |
| Real Estate Taxes | $2,204 | $0 |
Property Value by Mortgage Status in Mosquito Lake
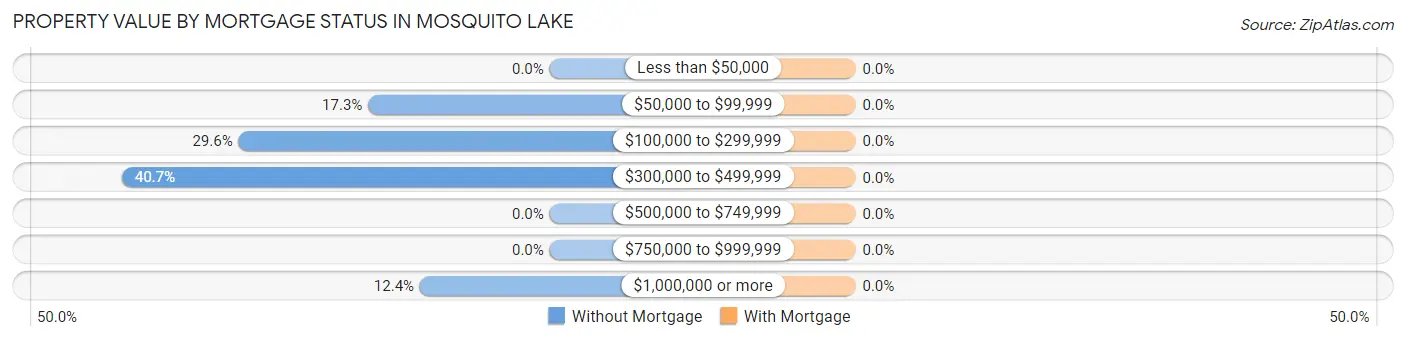
| Property Value | Without Mortgage | With Mortgage |
| Less than $50,000 | 0 (0.0%) | 0 (0.0%) |
| $50,000 to $99,999 | 14 (17.3%) | 0 (0.0%) |
| $100,000 to $299,999 | 24 (29.6%) | 0 (0.0%) |
| $300,000 to $499,999 | 33 (40.7%) | 0 (0.0%) |
| $500,000 to $749,999 | 0 (0.0%) | 0 (0.0%) |
| $750,000 to $999,999 | 0 (0.0%) | 0 (0.0%) |
| $1,000,000 or more | 10 (12.3%) | 0 (0.0%) |
| Total | 81 (100.0%) | 0 (0.0%) |
Household Income by Mortgage Status in Mosquito Lake
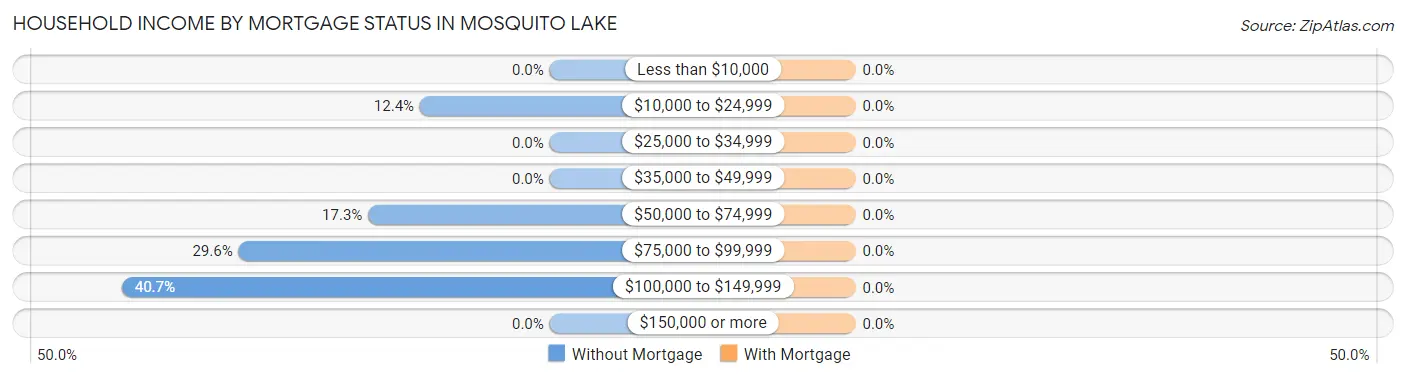
| Household Income | Without Mortgage | With Mortgage |
| Less than $10,000 | 0 (0.0%) | 0 (0.0%) |
| $10,000 to $24,999 | 10 (12.3%) | 0 (0.0%) |
| $25,000 to $34,999 | 0 (0.0%) | 0 (0.0%) |
| $35,000 to $49,999 | 0 (0.0%) | 0 (0.0%) |
| $50,000 to $74,999 | 14 (17.3%) | 0 (0.0%) |
| $75,000 to $99,999 | 24 (29.6%) | 0 (0.0%) |
| $100,000 to $149,999 | 33 (40.7%) | 0 (0.0%) |
| $150,000 or more | 0 (0.0%) | 0 (0.0%) |
| Total | 81 (100.0%) | 0 (0.0%) |
Property Value to Household Income Ratio in Mosquito Lake
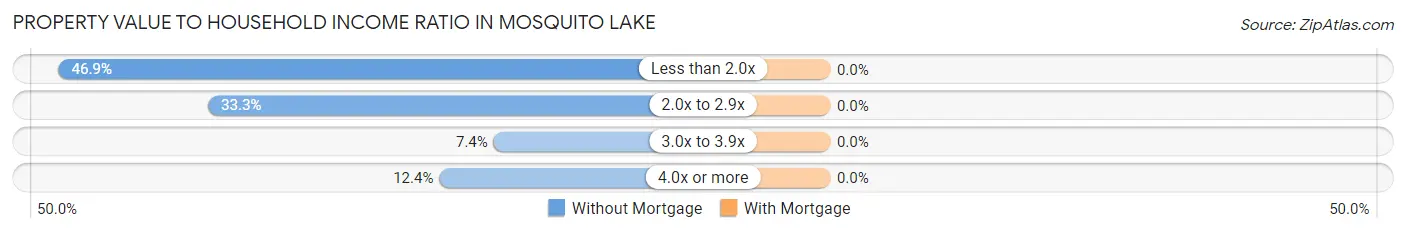
| Value-to-Income Ratio | Without Mortgage | With Mortgage |
| Less than 2.0x | 38 (46.9%) | 0 (0.0%) |
| 2.0x to 2.9x | 27 (33.3%) | 0 (0.0%) |
| 3.0x to 3.9x | 6 (7.4%) | 0 (0.0%) |
| 4.0x or more | 10 (12.3%) | 0 (0.0%) |
| Total | 81 (100.0%) | 0 (0.0%) |
Real Estate Taxes by Mortgage Status in Mosquito Lake
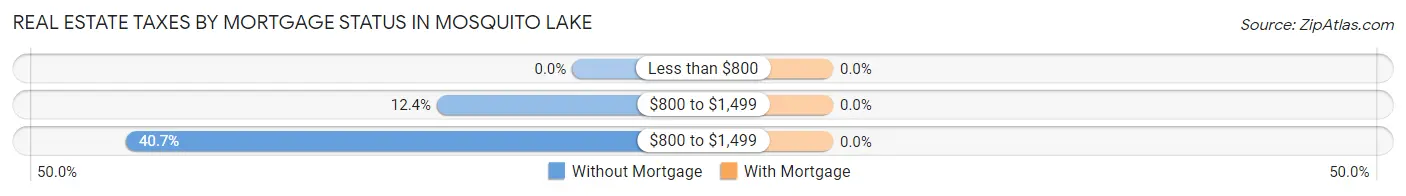
| Property Taxes | Without Mortgage | With Mortgage |
| Less than $800 | 0 (0.0%) | 0 (0.0%) |
| $800 to $1,499 | 10 (12.3%) | 0 (0.0%) |
| $800 to $1,499 | 33 (40.7%) | 0 (0.0%) |
| Total | 81 (100.0%) | 0 (0.0%) |
Health & Disability in Mosquito Lake
Health Insurance Coverage by Age in Mosquito Lake
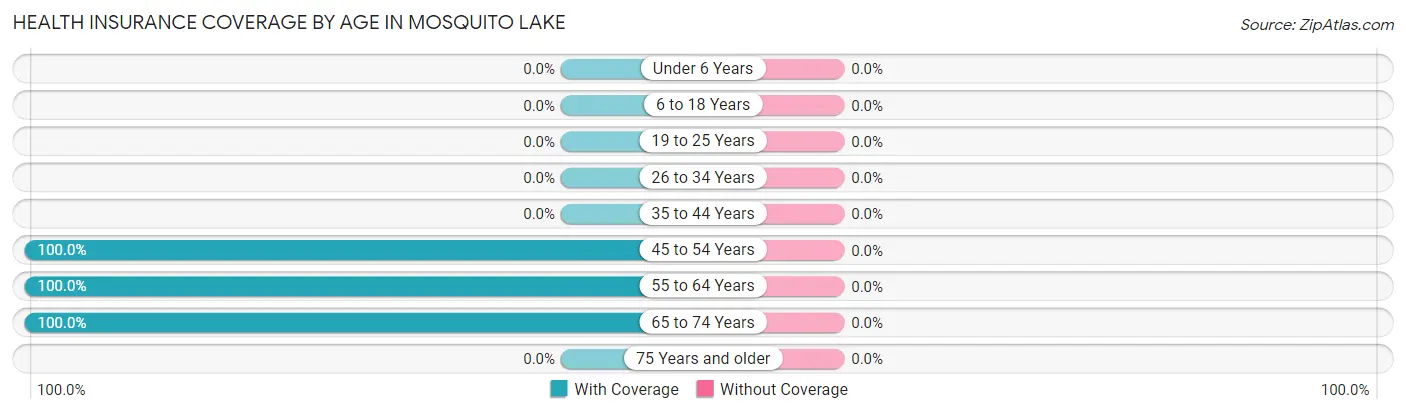
| Age Bracket | With Coverage | Without Coverage |
| Under 6 Years | 0 (0.0%) | 0 (0.0%) |
| 6 to 18 Years | 0 (0.0%) | 0 (0.0%) |
| 19 to 25 Years | 0 (0.0%) | 0 (0.0%) |
| 26 to 34 Years | 0 (0.0%) | 0 (0.0%) |
| 35 to 44 Years | 0 (0.0%) | 0 (0.0%) |
| 45 to 54 Years | 79 (100.0%) | 0 (0.0%) |
| 55 to 64 Years | 16 (100.0%) | 0 (0.0%) |
| 65 to 74 Years | 59 (100.0%) | 0 (0.0%) |
| 75 Years and older | 0 (0.0%) | 0 (0.0%) |
| Total | 154 (100.0%) | 0 (0.0%) |
Health Insurance Coverage by Citizenship Status in Mosquito Lake
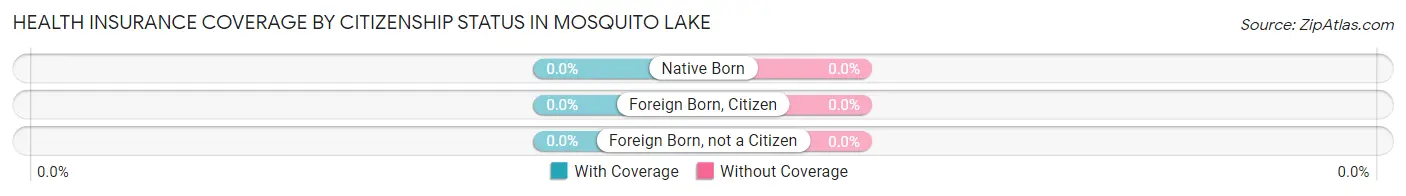
| Citizenship Status | With Coverage | Without Coverage |
| Native Born | 0 (0.0%) | 0 (0.0%) |
| Foreign Born, Citizen | 0 (0.0%) | 0 (0.0%) |
| Foreign Born, not a Citizen | 0 (0.0%) | 0 (0.0%) |
Health Insurance Coverage by Household Income in Mosquito Lake
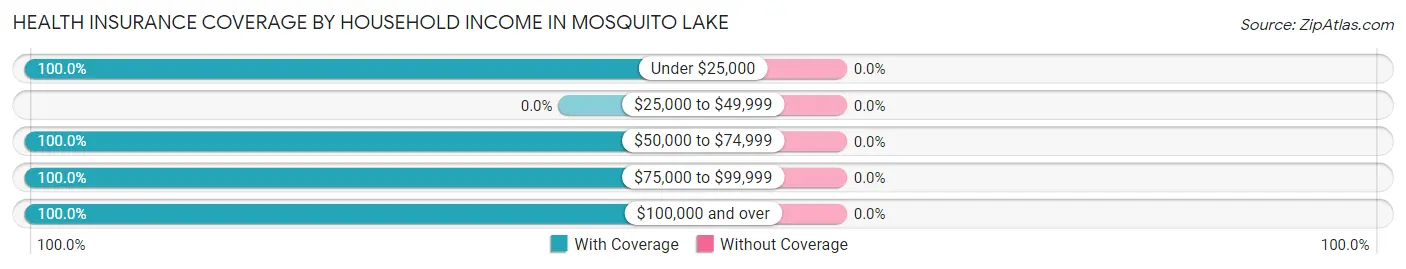
| Household Income | With Coverage | Without Coverage |
| Under $25,000 | 10 (100.0%) | 0 (0.0%) |
| $25,000 to $49,999 | 0 (0.0%) | 0 (0.0%) |
| $50,000 to $74,999 | 14 (100.0%) | 0 (0.0%) |
| $75,000 to $99,999 | 45 (100.0%) | 0 (0.0%) |
| $100,000 and over | 85 (100.0%) | 0 (0.0%) |
Public vs Private Health Insurance Coverage by Age in Mosquito Lake
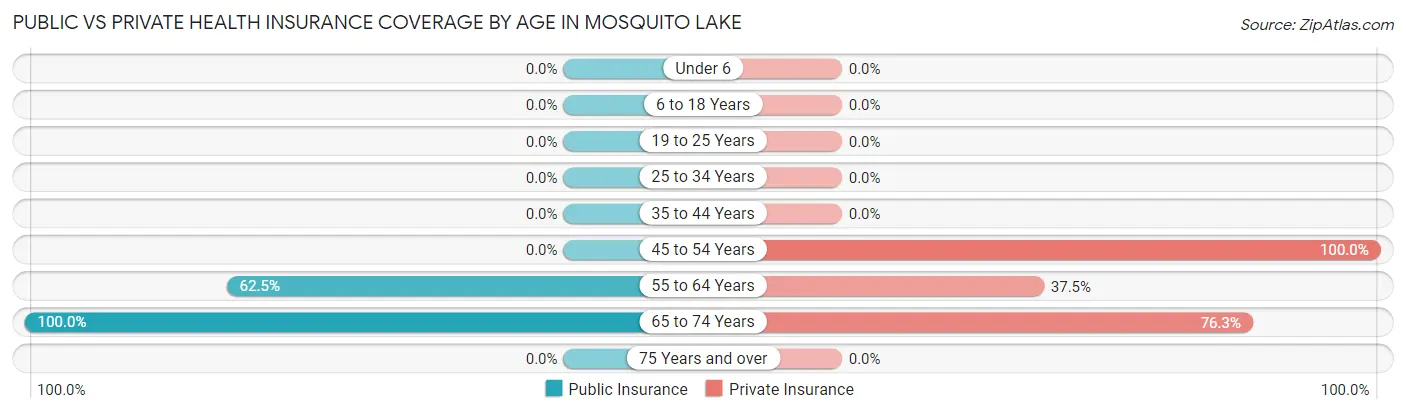
| Age Bracket | Public Insurance | Private Insurance |
| Under 6 | 0 (0.0%) | 0 (0.0%) |
| 6 to 18 Years | 0 (0.0%) | 0 (0.0%) |
| 19 to 25 Years | 0 (0.0%) | 0 (0.0%) |
| 25 to 34 Years | 0 (0.0%) | 0 (0.0%) |
| 35 to 44 Years | 0 (0.0%) | 0 (0.0%) |
| 45 to 54 Years | 0 (0.0%) | 79 (100.0%) |
| 55 to 64 Years | 10 (62.5%) | 6 (37.5%) |
| 65 to 74 Years | 59 (100.0%) | 45 (76.3%) |
| 75 Years and over | 0 (0.0%) | 0 (0.0%) |
| Total | 69 (44.8%) | 130 (84.4%) |
Disability Status by Sex by Age in Mosquito Lake
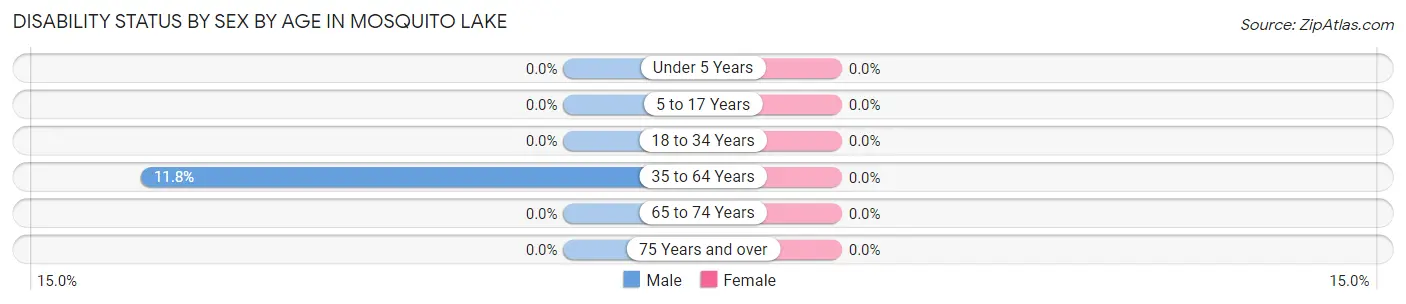
| Age Bracket | Male | Female |
| Under 5 Years | 0 (0.0%) | 0 (0.0%) |
| 5 to 17 Years | 0 (0.0%) | 0 (0.0%) |
| 18 to 34 Years | 0 (0.0%) | 0 (0.0%) |
| 35 to 64 Years | 6 (11.8%) | 0 (0.0%) |
| 65 to 74 Years | 0 (0.0%) | 0 (0.0%) |
| 75 Years and over | 0 (0.0%) | 0 (0.0%) |
Disability Class by Sex by Age in Mosquito Lake
Disability Class: Hearing Difficulty
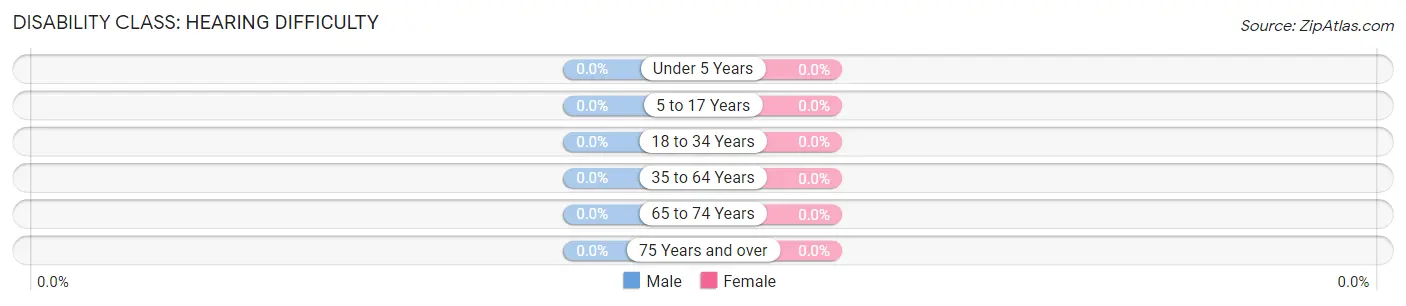
| Age Bracket | Male | Female |
| Under 5 Years | 0 (0.0%) | 0 (0.0%) |
| 5 to 17 Years | 0 (0.0%) | 0 (0.0%) |
| 18 to 34 Years | 0 (0.0%) | 0 (0.0%) |
| 35 to 64 Years | 0 (0.0%) | 0 (0.0%) |
| 65 to 74 Years | 0 (0.0%) | 0 (0.0%) |
| 75 Years and over | 0 (0.0%) | 0 (0.0%) |
Disability Class: Vision Difficulty
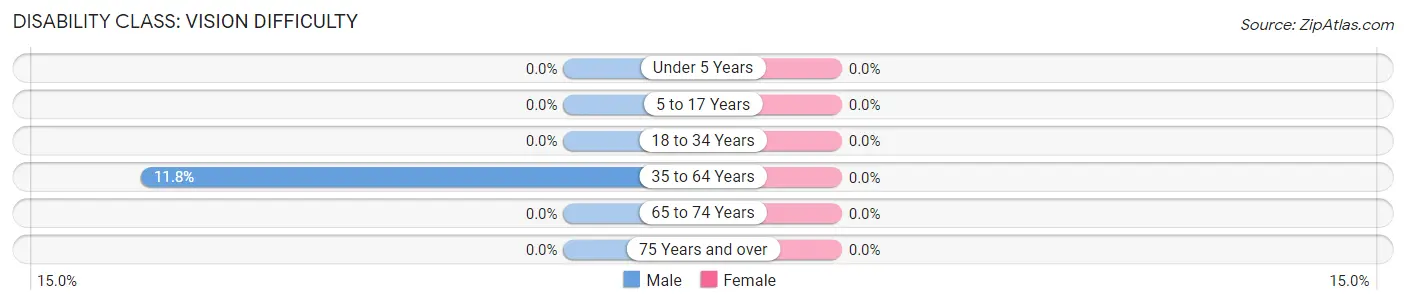
| Age Bracket | Male | Female |
| Under 5 Years | 0 (0.0%) | 0 (0.0%) |
| 5 to 17 Years | 0 (0.0%) | 0 (0.0%) |
| 18 to 34 Years | 0 (0.0%) | 0 (0.0%) |
| 35 to 64 Years | 6 (11.8%) | 0 (0.0%) |
| 65 to 74 Years | 0 (0.0%) | 0 (0.0%) |
| 75 Years and over | 0 (0.0%) | 0 (0.0%) |
Disability Class: Cognitive Difficulty
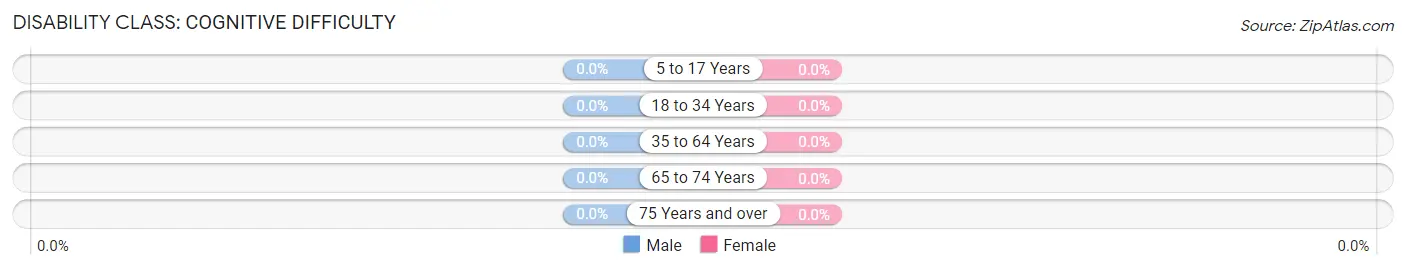
| Age Bracket | Male | Female |
| 5 to 17 Years | 0 (0.0%) | 0 (0.0%) |
| 18 to 34 Years | 0 (0.0%) | 0 (0.0%) |
| 35 to 64 Years | 0 (0.0%) | 0 (0.0%) |
| 65 to 74 Years | 0 (0.0%) | 0 (0.0%) |
| 75 Years and over | 0 (0.0%) | 0 (0.0%) |
Disability Class: Ambulatory Difficulty
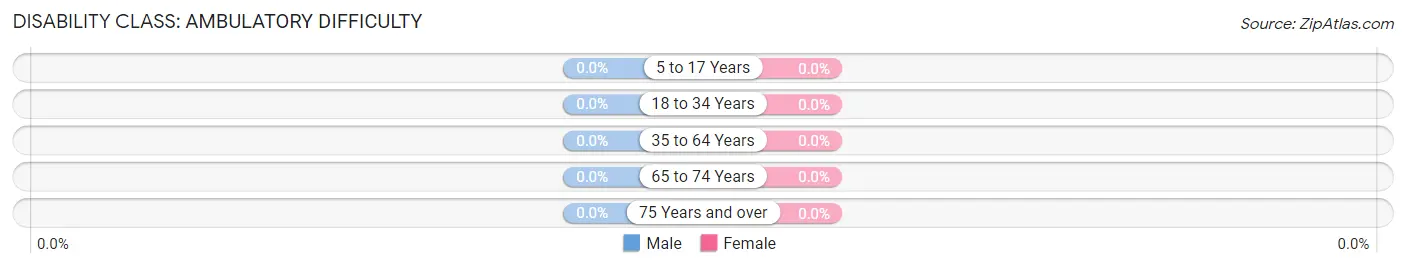
| Age Bracket | Male | Female |
| 5 to 17 Years | 0 (0.0%) | 0 (0.0%) |
| 18 to 34 Years | 0 (0.0%) | 0 (0.0%) |
| 35 to 64 Years | 0 (0.0%) | 0 (0.0%) |
| 65 to 74 Years | 0 (0.0%) | 0 (0.0%) |
| 75 Years and over | 0 (0.0%) | 0 (0.0%) |
Disability Class: Self-Care Difficulty
| Age Bracket | Male | Female |
| 5 to 17 Years | 0 (0.0%) | 0 (0.0%) |
| 18 to 34 Years | 0 (0.0%) | 0 (0.0%) |
| 35 to 64 Years | 0 (0.0%) | 0 (0.0%) |
| 65 to 74 Years | 0 (0.0%) | 0 (0.0%) |
| 75 Years and over | 0 (0.0%) | 0 (0.0%) |
Technology Access in Mosquito Lake
Computing Device Access in Mosquito Lake
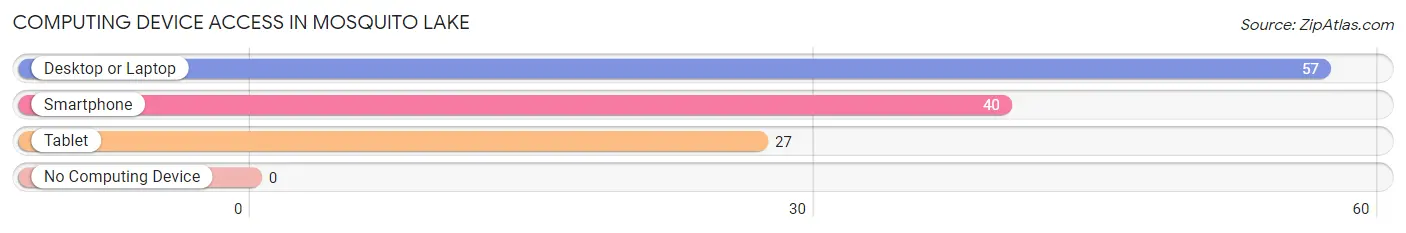
| Device Type | # Households | % Households |
| Desktop or Laptop | 57 | 70.4% |
| Smartphone | 40 | 49.4% |
| Tablet | 27 | 33.3% |
| No Computing Device | 0 | 0.0% |
| Total | 81 | 100.0% |
Internet Access in Mosquito Lake
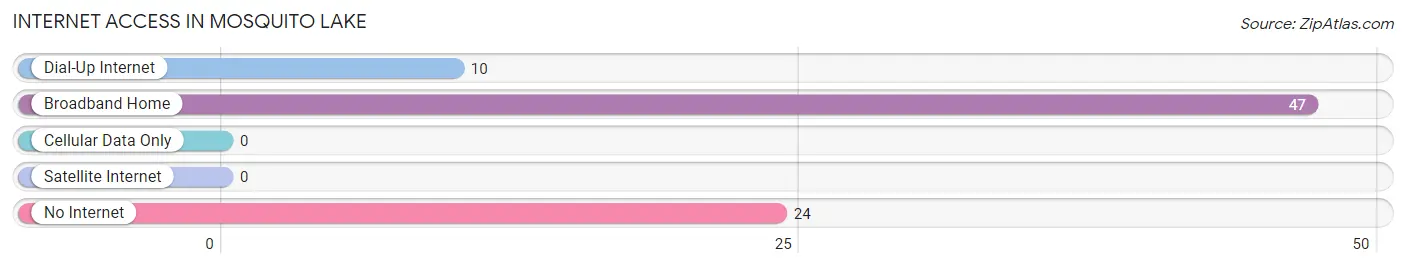
| Internet Type | # Households | % Households |
| Dial-Up Internet | 10 | 12.3% |
| Broadband Home | 47 | 58.0% |
| Cellular Data Only | 0 | 0.0% |
| Satellite Internet | 0 | 0.0% |
| No Internet | 24 | 29.6% |
| Total | 81 | 100.0% |
Mosquito Lake Summary
Mosquito Lake is a small lake located in the Yukon-Kuskokwim Delta region of Alaska. It is located approximately 30 miles east of Bethel, Alaska and is part of the Yukon Delta National Wildlife Refuge. The lake is approximately 4 miles long and 1 mile wide and is surrounded by wetlands, tundra, and boreal forest. The lake is home to a variety of fish species, including Arctic char, Arctic grayling, and northern pike.
History
The area around Mosquito Lake has been inhabited by the Yup'ik people for thousands of years. The Yup'ik people have a long history of subsistence fishing and hunting in the area. The lake was first documented by Europeans in 1867, when the U.S. Army Corps of Engineers surveyed the area. The lake was named after the large number of mosquitoes that inhabit the area.
Geography
Mosquito Lake is located in the Yukon-Kuskokwim Delta region of Alaska. The lake is approximately 4 miles long and 1 mile wide and is surrounded by wetlands, tundra, and boreal forest. The lake is fed by several small streams and is connected to the Kuskokwim River by a small channel. The lake is shallow, with an average depth of only 3 feet.
Economy
The economy of the Mosquito Lake area is largely based on subsistence fishing and hunting. The Yup'ik people have a long history of subsistence fishing and hunting in the area. The lake is home to a variety of fish species, including Arctic char, Arctic grayling, and northern pike. The lake is also home to a variety of waterfowl, including ducks, geese, and swans.
Demographics
The population of the Mosquito Lake area is largely composed of Yup'ik people. The Yup'ik people have a long history of subsistence fishing and hunting in the area. The population of the area is estimated to be around 500 people. The majority of the population is located in the nearby village of Napaskiak, Alaska. The population of the area is largely rural and is composed of a mix of Native American and non-Native American people.
Conclusion
Mosquito Lake is a small lake located in the Yukon-Kuskokwim Delta region of Alaska. The lake is home to a variety of fish species, waterfowl, and other wildlife. The area around the lake has been inhabited by the Yup'ik people for thousands of years and the economy of the area is largely based on subsistence fishing and hunting. The population of the area is estimated to be around 500 people and is composed of a mix of Native American and non-Native American people.
Common Questions
What is Per Capita Income in Mosquito Lake?
Per Capita income in Mosquito Lake is $63,106.
What is the Median Family Income in Mosquito Lake?
Median Family Income in Mosquito Lake is $119,375.
What is the Median Household income in Mosquito Lake?
Median Household Income in Mosquito Lake is $96,719.
What is Inequality or Gini Index in Mosquito Lake?
Inequality or Gini Index in Mosquito Lake is 0.24.
What is the Total Population of Mosquito Lake?
Total Population of Mosquito Lake is 154.
What is the Total Male Population of Mosquito Lake?
Total Male Population of Mosquito Lake is 89.
What is the Total Female Population of Mosquito Lake?
Total Female Population of Mosquito Lake is 65.
What is the Ratio of Males per 100 Females in Mosquito Lake?
There are 136.92 Males per 100 Females in Mosquito Lake.
What is the Ratio of Females per 100 Males in Mosquito Lake?
There are 73.03 Females per 100 Males in Mosquito Lake.
What is the Median Population Age in Mosquito Lake?
Median Population Age in Mosquito Lake is 54.7 Years.
What is the Average Family Size in Mosquito Lake
Average Family Size in Mosquito Lake is 2.3 People.
What is the Average Household Size in Mosquito Lake
Average Household Size in Mosquito Lake is 1.9 People.
How Large is the Labor Force in Mosquito Lake?
There are 88 People in the Labor Forcein in Mosquito Lake.
What is the Percentage of People in the Labor Force in Mosquito Lake?
57.1% of People are in the Labor Force in Mosquito Lake.