Diamond Ridge, AK Map & Demographics
Diamond Ridge Map
Diamond Ridge Overview
$43,208
PER CAPITA INCOME
$109,167
AVG FAMILY INCOME
$91,923
AVG HOUSEHOLD INCOME
43.5%
WAGE / INCOME GAP [ % ]
56.5¢/ $1
WAGE / INCOME GAP [ $ ]
0.43
INEQUALITY / GINI INDEX
1,397
TOTAL POPULATION
663
MALE POPULATION
734
FEMALE POPULATION
90.33
MALES / 100 FEMALES
110.71
FEMALES / 100 MALES
40.2
MEDIAN AGE
3.4
AVG FAMILY SIZE
2.7
AVG HOUSEHOLD SIZE
608
LABOR FORCE [ PEOPLE ]
56.6%
PERCENT IN LABOR FORCE
2.3%
UNEMPLOYMENT RATE
Income in Diamond Ridge
Income Overview in Diamond Ridge
Per Capita Income in Diamond Ridge is $43,208, while median incomes of families and households are $109,167 and $91,923 respectively.
| Characteristic | Number | Measure |
| Per Capita Income | 1,397 | $43,208 |
| Median Family Income | 324 | $109,167 |
| Mean Family Income | 324 | $129,398 |
| Median Household Income | 524 | $91,923 |
| Mean Household Income | 524 | $110,207 |
| Income Deficit | 324 | $0 |
| Wage / Income Gap (%) | 1,397 | 43.52% |
| Wage / Income Gap ($) | 1,397 | 56.48¢ per $1 |
| Gini / Inequality Index | 1,397 | 0.43 |
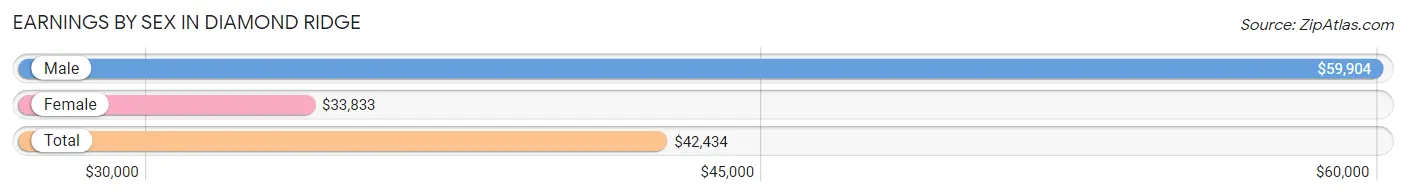
Earnings by Sex in Diamond Ridge
Average Earnings in Diamond Ridge are $42,434, $59,904 for men and $33,833 for women, a difference of 43.5%.
| Sex | Number | Average Earnings |
| Male | 349 (49.8%) | $59,904 |
| Female | 352 (50.2%) | $33,833 |
| Total | 701 (100.0%) | $42,434 |
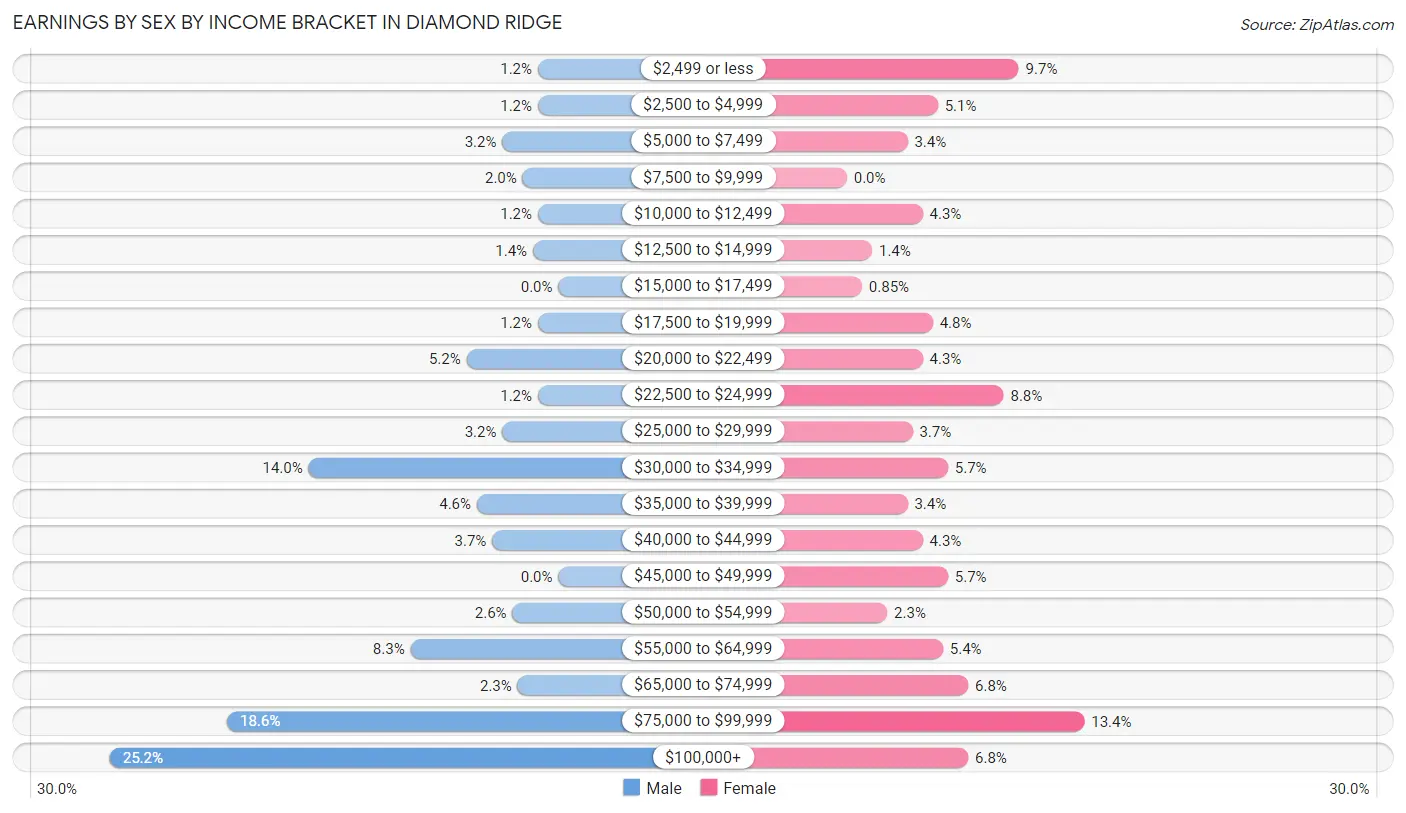
Earnings by Sex by Income Bracket in Diamond Ridge
The most common earnings brackets in Diamond Ridge are $100,000+ for men (88 | 25.2%) and $75,000 to $99,999 for women (47 | 13.4%).
| Income | Male | Female |
| $2,499 or less | 4 (1.1%) | 34 (9.7%) |
| $2,500 to $4,999 | 4 (1.1%) | 18 (5.1%) |
| $5,000 to $7,499 | 11 (3.2%) | 12 (3.4%) |
| $7,500 to $9,999 | 7 (2.0%) | 0 (0.0%) |
| $10,000 to $12,499 | 4 (1.1%) | 15 (4.3%) |
| $12,500 to $14,999 | 5 (1.4%) | 5 (1.4%) |
| $15,000 to $17,499 | 0 (0.0%) | 3 (0.9%) |
| $17,500 to $19,999 | 4 (1.1%) | 17 (4.8%) |
| $20,000 to $22,499 | 18 (5.2%) | 15 (4.3%) |
| $22,500 to $24,999 | 4 (1.1%) | 31 (8.8%) |
| $25,000 to $29,999 | 11 (3.2%) | 13 (3.7%) |
| $30,000 to $34,999 | 49 (14.0%) | 20 (5.7%) |
| $35,000 to $39,999 | 16 (4.6%) | 12 (3.4%) |
| $40,000 to $44,999 | 13 (3.7%) | 15 (4.3%) |
| $45,000 to $49,999 | 0 (0.0%) | 20 (5.7%) |
| $50,000 to $54,999 | 9 (2.6%) | 8 (2.3%) |
| $55,000 to $64,999 | 29 (8.3%) | 19 (5.4%) |
| $65,000 to $74,999 | 8 (2.3%) | 24 (6.8%) |
| $75,000 to $99,999 | 65 (18.6%) | 47 (13.4%) |
| $100,000+ | 88 (25.2%) | 24 (6.8%) |
| Total | 349 (100.0%) | 352 (100.0%) |
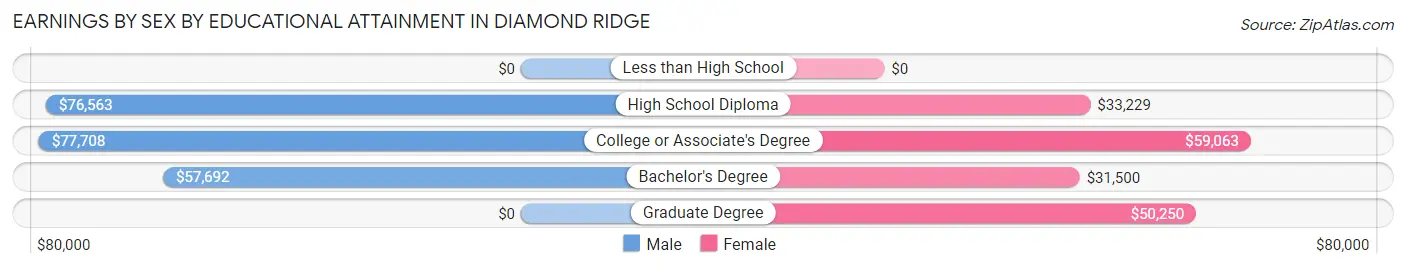
Earnings by Sex by Educational Attainment in Diamond Ridge
Average earnings in Diamond Ridge are $62,188 for men and $40,333 for women, a difference of 35.1%. Men with an educational attainment of college or associate's degree enjoy the highest average annual earnings of $77,708, while those with bachelor's degree education earn the least with $57,692. Women with an educational attainment of college or associate's degree earn the most with the average annual earnings of $59,063, while those with bachelor's degree education have the smallest earnings of $31,500.
| Educational Attainment | Male Income | Female Income |
| Less than High School | - | - |
| High School Diploma | $76,563 | $33,229 |
| College or Associate's Degree | $77,708 | $59,063 |
| Bachelor's Degree | $57,692 | $31,500 |
| Graduate Degree | - | - |
| Total | $62,188 | $40,333 |
Family Income in Diamond Ridge
Family Income Brackets in Diamond Ridge
According to the Diamond Ridge family income data, there are 94 families falling into the $100,000 to $149,999 income range, which is the most common income bracket and makes up 29.0% of all families. Conversely, the $10,000 to $14,999 income bracket is the least frequent group with only 4 families (1.2%) belonging to this category.
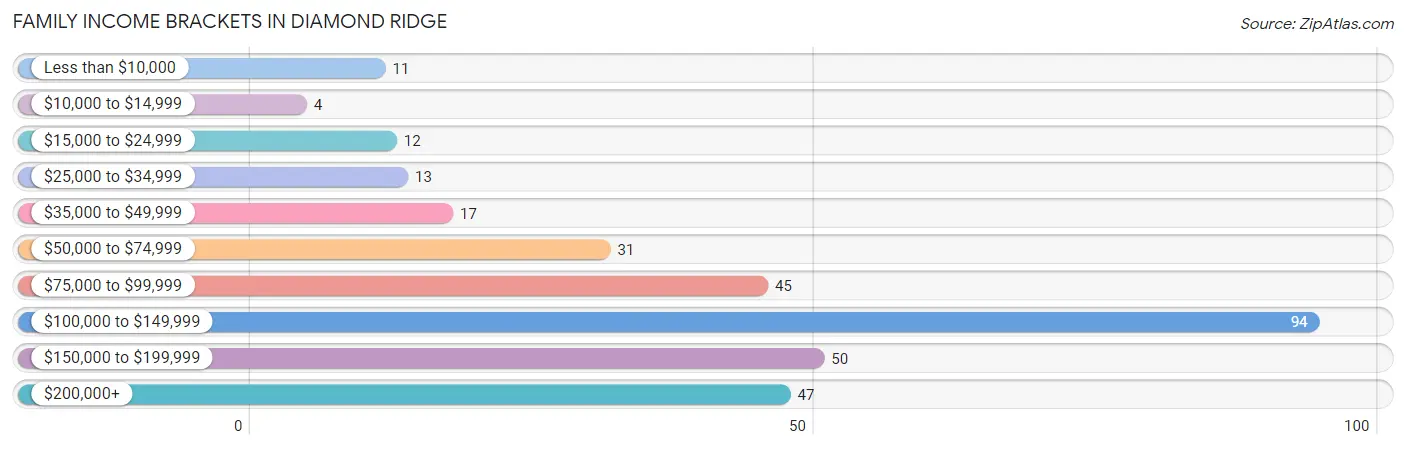
| Income Bracket | # Families | % Families |
| Less than $10,000 | 11 | 3.4% |
| $10,000 to $14,999 | 4 | 1.2% |
| $15,000 to $24,999 | 12 | 3.7% |
| $25,000 to $34,999 | 13 | 4.0% |
| $35,000 to $49,999 | 17 | 5.2% |
| $50,000 to $74,999 | 31 | 9.6% |
| $75,000 to $99,999 | 45 | 13.9% |
| $100,000 to $149,999 | 94 | 29.0% |
| $150,000 to $199,999 | 50 | 15.4% |
| $200,000+ | 47 | 14.5% |
Family Income by Famaliy Size in Diamond Ridge
5-person families (20 | 6.2%) account for the highest median family income in Diamond Ridge with $176,000 per family, while 2-person families (161 | 49.7%) have the highest median income of $45,875 per family member.
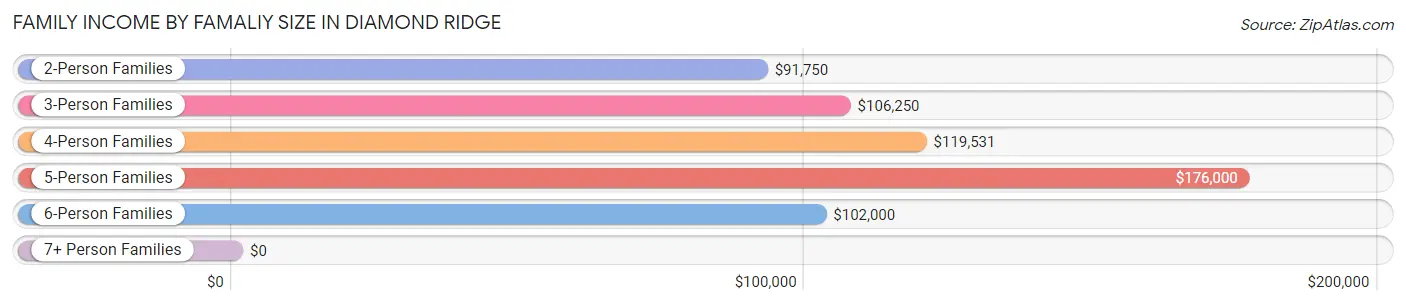
| Income Bracket | # Families | Median Income |
| 2-Person Families | 161 (49.7%) | $91,750 |
| 3-Person Families | 68 (21.0%) | $106,250 |
| 4-Person Families | 55 (17.0%) | $119,531 |
| 5-Person Families | 20 (6.2%) | $176,000 |
| 6-Person Families | 16 (4.9%) | $102,000 |
| 7+ Person Families | 4 (1.2%) | $0 |
| Total | 324 (100.0%) | $109,167 |
Family Income by Number of Earners in Diamond Ridge
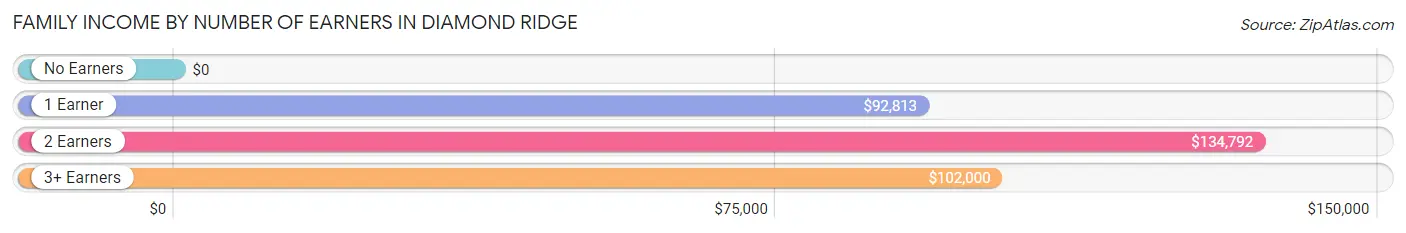
| Number of Earners | # Families | Median Income |
| No Earners | 55 (17.0%) | $0 |
| 1 Earner | 121 (37.3%) | $92,813 |
| 2 Earners | 132 (40.7%) | $134,792 |
| 3+ Earners | 16 (4.9%) | $102,000 |
| Total | 324 (100.0%) | $109,167 |
Household Income in Diamond Ridge
Household Income Brackets in Diamond Ridge
With 114 households falling in the category, the $100,000 to $149,999 income range is the most frequent in Diamond Ridge, accounting for 21.8% of all households. In contrast, only 11 households (2.1%) fall into the less than $10,000 income bracket, making it the least populous group.
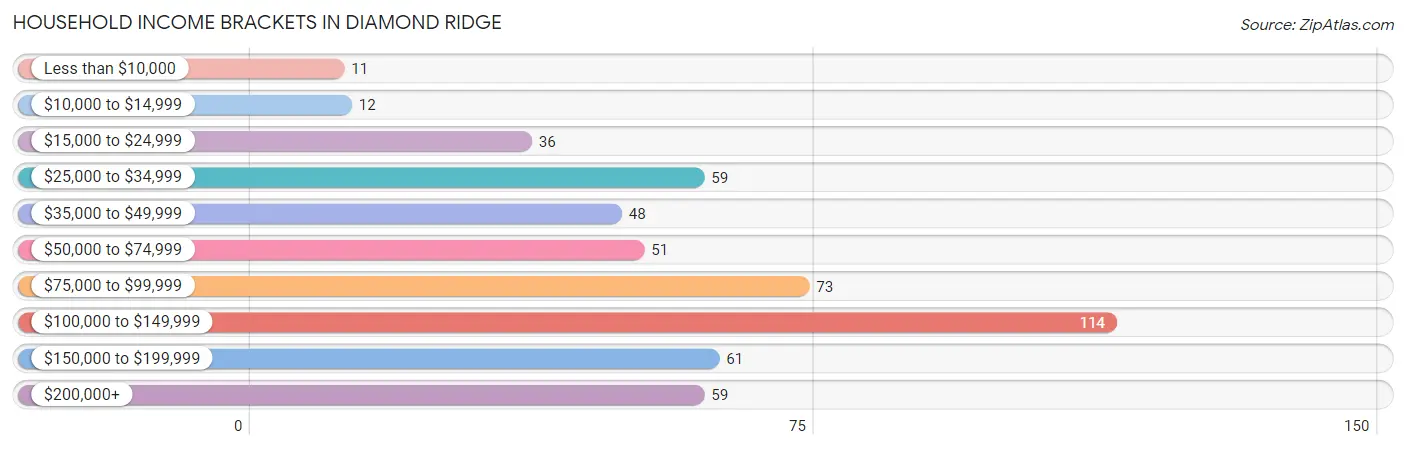
| Income Bracket | # Households | % Households |
| Less than $10,000 | 11 | 2.1% |
| $10,000 to $14,999 | 12 | 2.3% |
| $15,000 to $24,999 | 36 | 6.9% |
| $25,000 to $34,999 | 59 | 11.3% |
| $35,000 to $49,999 | 48 | 9.2% |
| $50,000 to $74,999 | 51 | 9.7% |
| $75,000 to $99,999 | 73 | 13.9% |
| $100,000 to $149,999 | 114 | 21.8% |
| $150,000 to $199,999 | 61 | 11.6% |
| $200,000+ | 59 | 11.3% |
Household Income by Householder Age in Diamond Ridge
The median household income in Diamond Ridge is $91,923, with the highest median household income of $105,625 found in the 45 to 64 years age bracket for the primary householder. A total of 212 households (40.5%) fall into this category. Meanwhile, the 15 to 24 years age bracket for the primary householder has the lowest median household income of $0, with 8 households (1.5%) in this group.
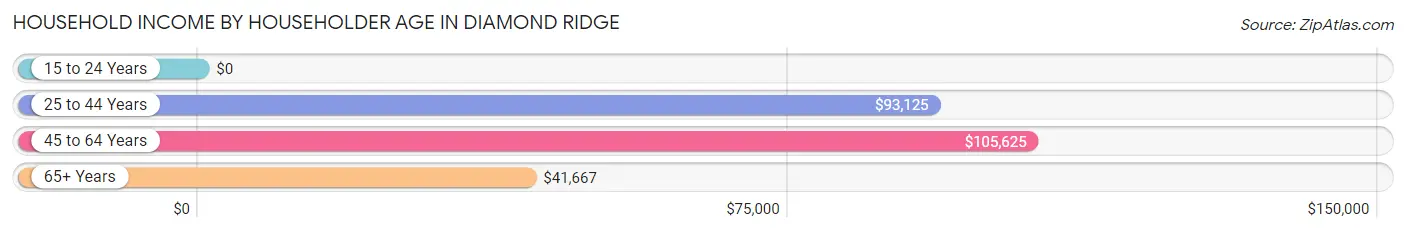
| Income Bracket | # Households | Median Income |
| 15 to 24 Years | 8 (1.5%) | $0 |
| 25 to 44 Years | 152 (29.0%) | $93,125 |
| 45 to 64 Years | 212 (40.5%) | $105,625 |
| 65+ Years | 152 (29.0%) | $41,667 |
| Total | 524 (100.0%) | $91,923 |
Poverty in Diamond Ridge
Income Below Poverty by Sex and Age in Diamond Ridge
With 4.6% poverty level for males and 7.0% for females among the residents of Diamond Ridge, 16 and 17 year old males and 75 year old and over females are the most vulnerable to poverty, with 4 males (33.3%) and 9 females (36.0%) in their respective age groups living below the poverty level.
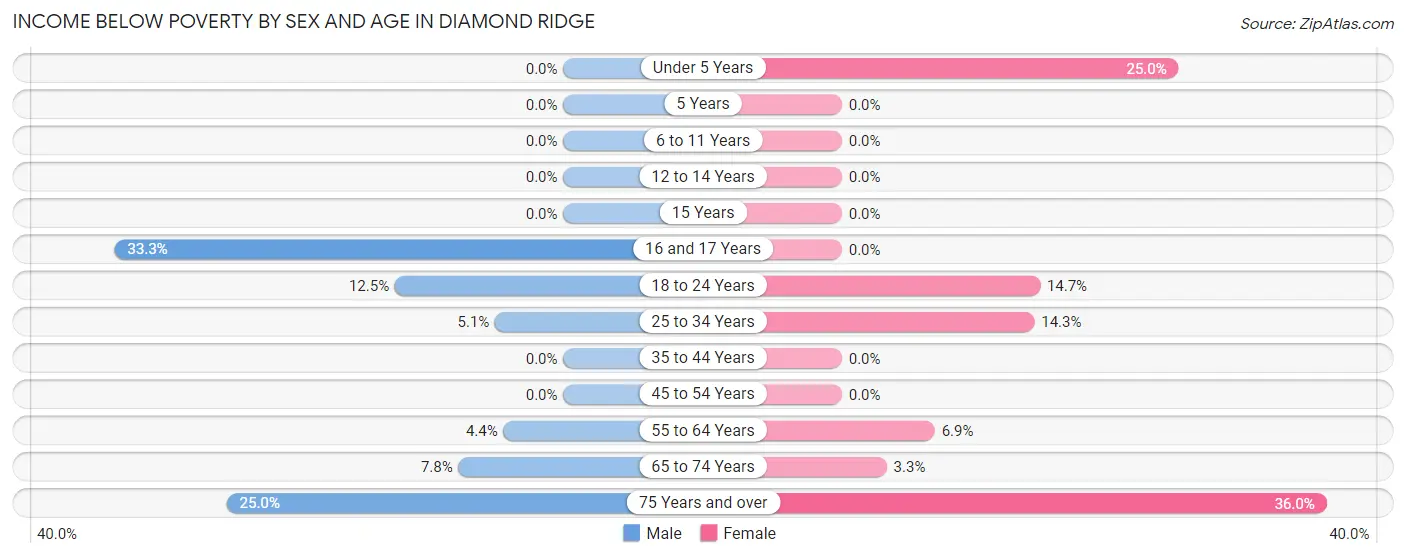
| Age Bracket | Male | Female |
| Under 5 Years | 0 (0.0%) | 10 (25.0%) |
| 5 Years | 0 (0.0%) | 0 (0.0%) |
| 6 to 11 Years | 0 (0.0%) | 0 (0.0%) |
| 12 to 14 Years | 0 (0.0%) | 0 (0.0%) |
| 15 Years | 0 (0.0%) | 0 (0.0%) |
| 16 and 17 Years | 4 (33.3%) | 0 (0.0%) |
| 18 to 24 Years | 7 (12.5%) | 5 (14.7%) |
| 25 to 34 Years | 4 (5.1%) | 14 (14.3%) |
| 35 to 44 Years | 0 (0.0%) | 0 (0.0%) |
| 45 to 54 Years | 0 (0.0%) | 0 (0.0%) |
| 55 to 64 Years | 4 (4.4%) | 10 (6.9%) |
| 65 to 74 Years | 7 (7.8%) | 3 (3.3%) |
| 75 Years and over | 4 (25.0%) | 9 (36.0%) |
| Total | 30 (4.6%) | 51 (7.0%) |
Income Above Poverty by Sex and Age in Diamond Ridge
According to the poverty statistics in Diamond Ridge, males aged under 5 years and females aged 5 years are the age groups that are most secure financially, with 100.0% of males and 100.0% of females in these age groups living above the poverty line.
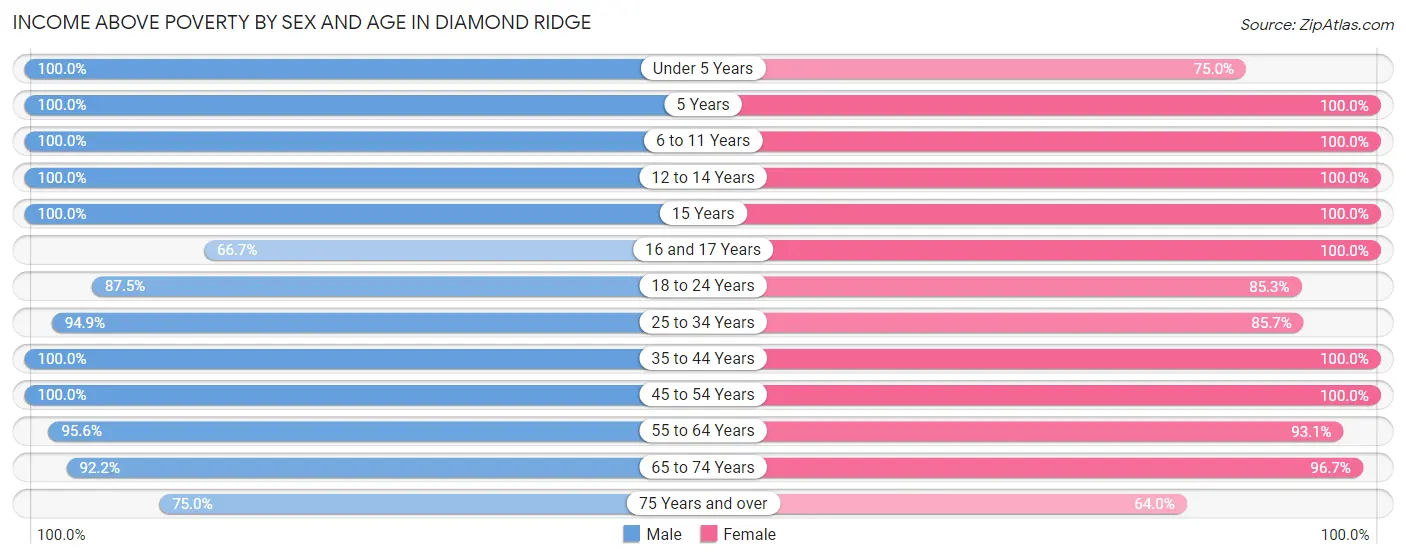
| Age Bracket | Male | Female |
| Under 5 Years | 50 (100.0%) | 30 (75.0%) |
| 5 Years | 9 (100.0%) | 9 (100.0%) |
| 6 to 11 Years | 69 (100.0%) | 35 (100.0%) |
| 12 to 14 Years | 36 (100.0%) | 59 (100.0%) |
| 15 Years | 1 (100.0%) | 10 (100.0%) |
| 16 and 17 Years | 8 (66.7%) | 26 (100.0%) |
| 18 to 24 Years | 49 (87.5%) | 29 (85.3%) |
| 25 to 34 Years | 75 (94.9%) | 84 (85.7%) |
| 35 to 44 Years | 64 (100.0%) | 111 (100.0%) |
| 45 to 54 Years | 86 (100.0%) | 52 (100.0%) |
| 55 to 64 Years | 86 (95.6%) | 135 (93.1%) |
| 65 to 74 Years | 83 (92.2%) | 87 (96.7%) |
| 75 Years and over | 12 (75.0%) | 16 (64.0%) |
| Total | 628 (95.4%) | 683 (93.0%) |
Income Below Poverty Among Married-Couple Families in Diamond Ridge
The poverty statistics for married-couple families in Diamond Ridge show that 2.5% or 7 of the total 280 families live below the poverty line. Families with no children have the highest poverty rate of 4.6%, comprising of 7 families. On the other hand, families with 1 or 2 children have the lowest poverty rate of 0.0%, which includes 0 families.
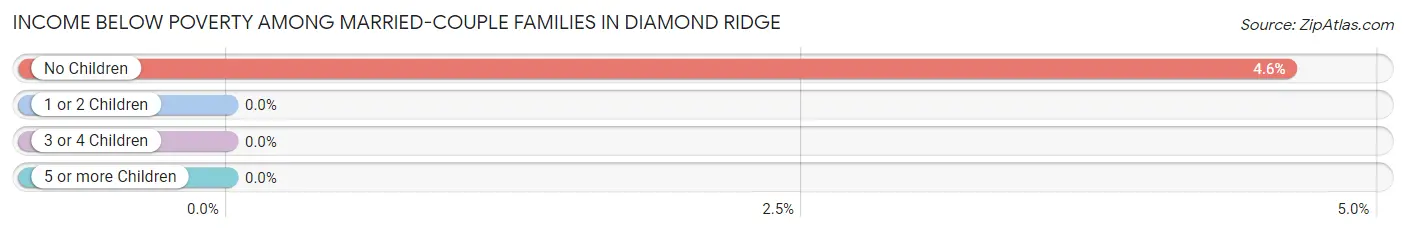
| Children | Above Poverty | Below Poverty |
| No Children | 145 (95.4%) | 7 (4.6%) |
| 1 or 2 Children | 91 (100.0%) | 0 (0.0%) |
| 3 or 4 Children | 33 (100.0%) | 0 (0.0%) |
| 5 or more Children | 4 (100.0%) | 0 (0.0%) |
| Total | 273 (97.5%) | 7 (2.5%) |
Income Below Poverty Among Single-Parent Households in Diamond Ridge
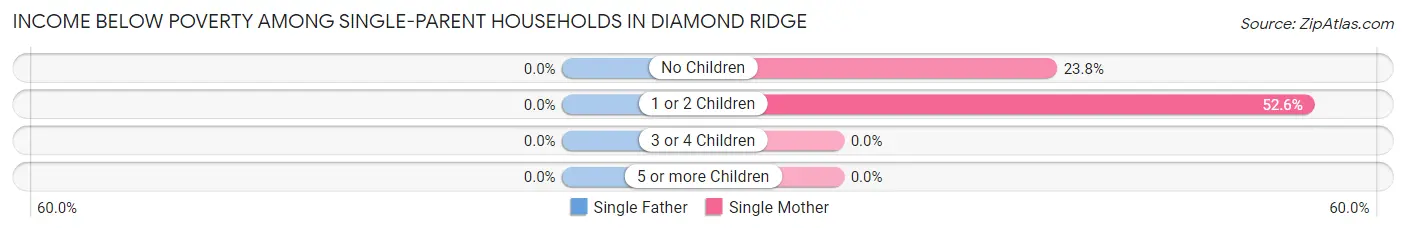
| Children | Single Father | Single Mother |
| No Children | 0 (0.0%) | 5 (23.8%) |
| 1 or 2 Children | 0 (0.0%) | 10 (52.6%) |
| 3 or 4 Children | 0 (0.0%) | 0 (0.0%) |
| 5 or more Children | 0 (0.0%) | 0 (0.0%) |
| Total | 0 (0.0%) | 15 (37.5%) |
Income Below Poverty Among Married-Couple vs Single-Parent Households in Diamond Ridge
The poverty data for Diamond Ridge shows that 7 of the married-couple family households (2.5%) and 15 of the single-parent households (34.1%) are living below the poverty level. Within the married-couple family households, those with no children have the highest poverty rate, with 7 households (4.6%) falling below the poverty line. Among the single-parent households, those with 1 or 2 children have the highest poverty rate, with 10 household (43.5%) living below poverty.
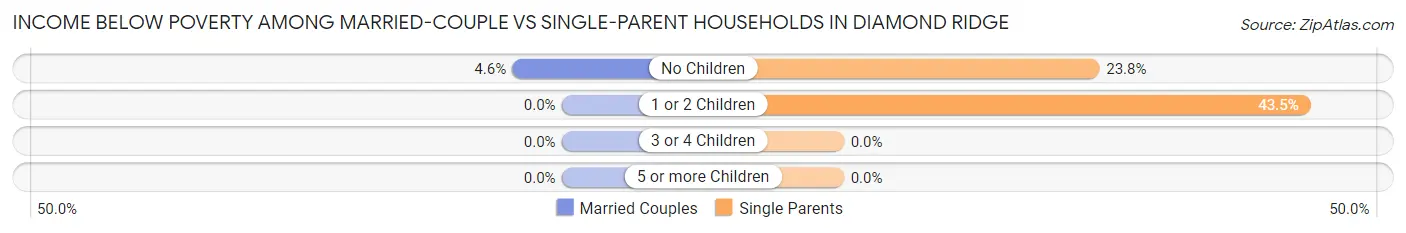
| Children | Married-Couple Families | Single-Parent Households |
| No Children | 7 (4.6%) | 5 (23.8%) |
| 1 or 2 Children | 0 (0.0%) | 10 (43.5%) |
| 3 or 4 Children | 0 (0.0%) | 0 (0.0%) |
| 5 or more Children | 0 (0.0%) | 0 (0.0%) |
| Total | 7 (2.5%) | 15 (34.1%) |
Race in Diamond Ridge
The most populous races in Diamond Ridge are White / Caucasian (1,241 | 88.8%), Two or more Races (87 | 6.2%), and Native / Alaskan (43 | 3.1%).
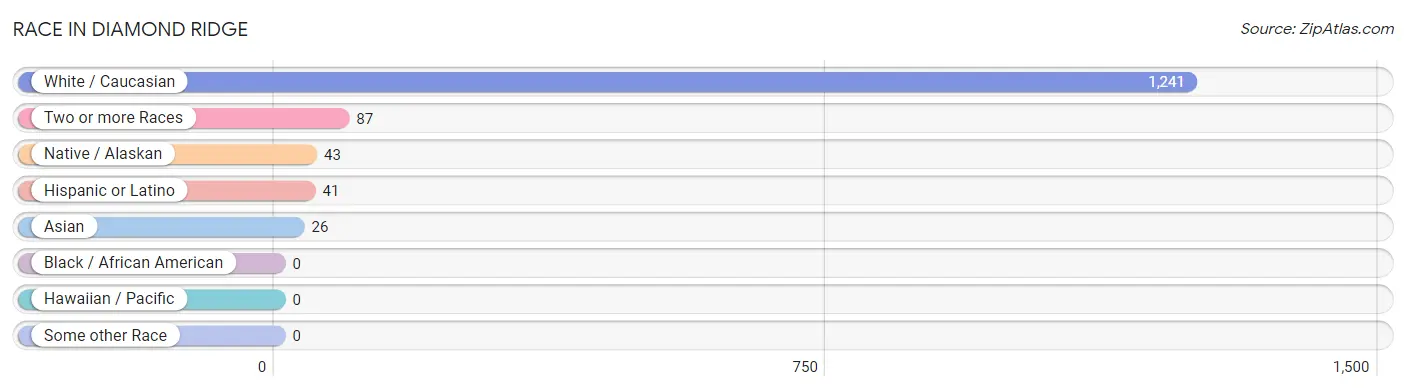
| Race | # Population | % Population |
| Asian | 26 | 1.9% |
| Black / African American | 0 | 0.0% |
| Hawaiian / Pacific | 0 | 0.0% |
| Hispanic or Latino | 41 | 2.9% |
| Native / Alaskan | 43 | 3.1% |
| White / Caucasian | 1,241 | 88.8% |
| Two or more Races | 87 | 6.2% |
| Some other Race | 0 | 0.0% |
| Total | 1,397 | 100.0% |
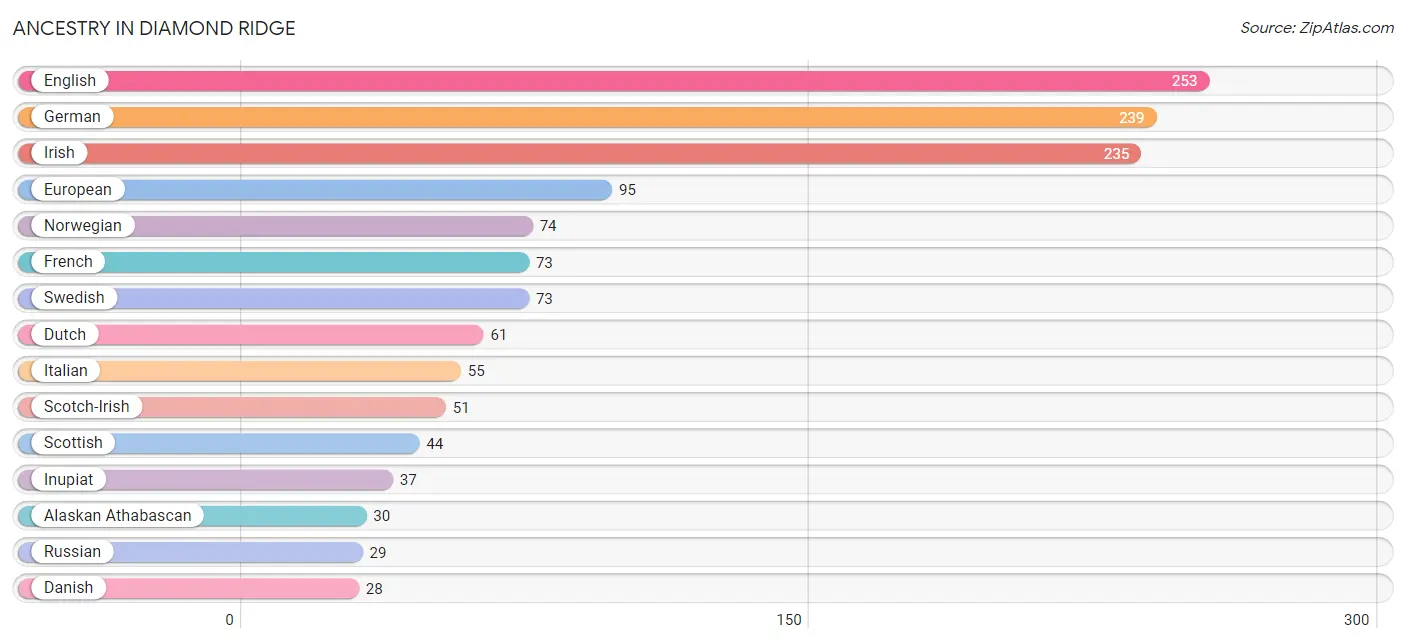
Ancestry in Diamond Ridge
The most populous ancestries reported in Diamond Ridge are English (253 | 18.1%), German (239 | 17.1%), Irish (235 | 16.8%), European (95 | 6.8%), and Norwegian (74 | 5.3%), together accounting for 64.1% of all Diamond Ridge residents.
| Ancestry | # Population | % Population |
| Alaska Native | 11 | 0.8% |
| Alaskan Athabascan | 30 | 2.1% |
| American | 26 | 1.9% |
| Austrian | 8 | 0.6% |
| Bhutanese | 2 | 0.1% |
| British | 4 | 0.3% |
| Cherokee | 21 | 1.5% |
| Czech | 17 | 1.2% |
| Danish | 28 | 2.0% |
| Dutch | 61 | 4.4% |
| Dutch West Indian | 5 | 0.4% |
| Eastern European | 11 | 0.8% |
| English | 253 | 18.1% |
| European | 95 | 6.8% |
| Finnish | 25 | 1.8% |
| French | 73 | 5.2% |
| French Canadian | 14 | 1.0% |
| German | 239 | 17.1% |
| Hungarian | 5 | 0.4% |
| Icelander | 6 | 0.4% |
| Inupiat | 37 | 2.6% |
| Irish | 235 | 16.8% |
| Italian | 55 | 3.9% |
| Korean | 26 | 1.9% |
| Mexican | 19 | 1.4% |
| Navajo | 2 | 0.1% |
| Northern European | 22 | 1.6% |
| Norwegian | 74 | 5.3% |
| Polish | 19 | 1.4% |
| Portuguese | 13 | 0.9% |
| Romanian | 4 | 0.3% |
| Russian | 29 | 2.1% |
| Scandinavian | 7 | 0.5% |
| Scotch-Irish | 51 | 3.6% |
| Scottish | 44 | 3.2% |
| Spaniard | 22 | 1.6% |
| Swedish | 73 | 5.2% |
| Welsh | 11 | 0.8% |
| Yaqui | 2 | 0.1% |
| Yup'ik | 5 | 0.4% | View All 40 Rows |
Immigrants in Diamond Ridge
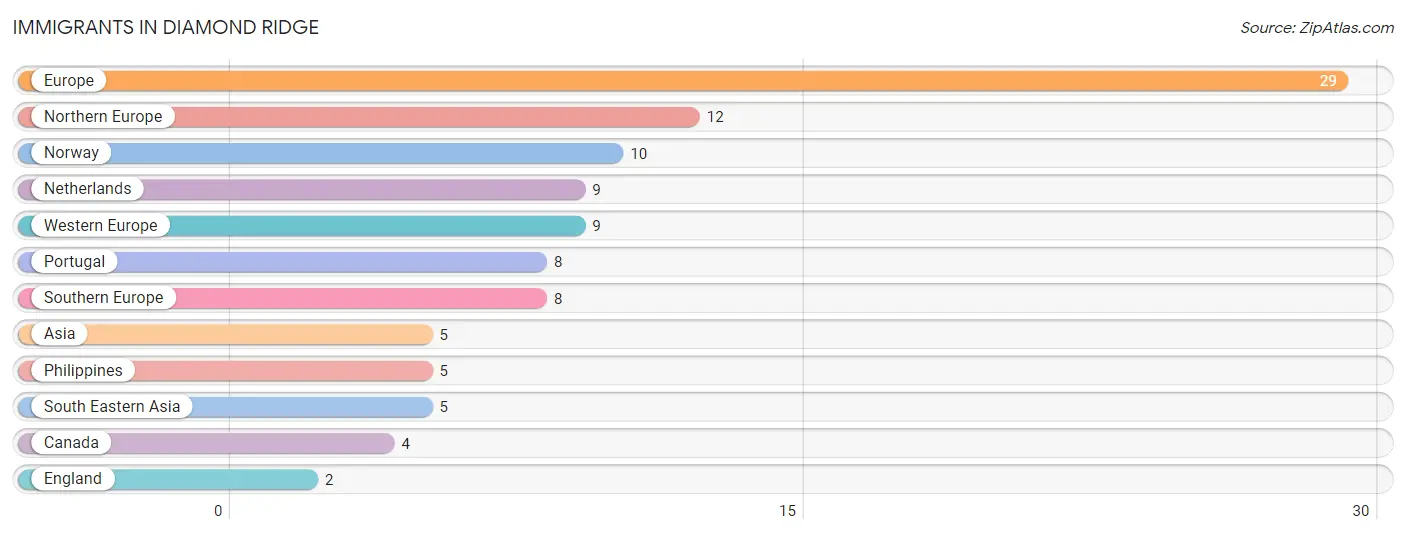
The most numerous immigrant groups reported in Diamond Ridge came from Europe (29 | 2.1%), Northern Europe (12 | 0.9%), Norway (10 | 0.7%), Netherlands (9 | 0.6%), and Western Europe (9 | 0.6%), together accounting for 4.9% of all Diamond Ridge residents.
| Immigration Origin | # Population | % Population |
| Asia | 5 | 0.4% |
| Canada | 4 | 0.3% |
| England | 2 | 0.1% |
| Europe | 29 | 2.1% |
| Netherlands | 9 | 0.6% |
| Northern Europe | 12 | 0.9% |
| Norway | 10 | 0.7% |
| Philippines | 5 | 0.4% |
| Portugal | 8 | 0.6% |
| South Eastern Asia | 5 | 0.4% |
| Southern Europe | 8 | 0.6% |
| Western Europe | 9 | 0.6% | View All 12 Rows |
Sex and Age in Diamond Ridge
Sex and Age in Diamond Ridge
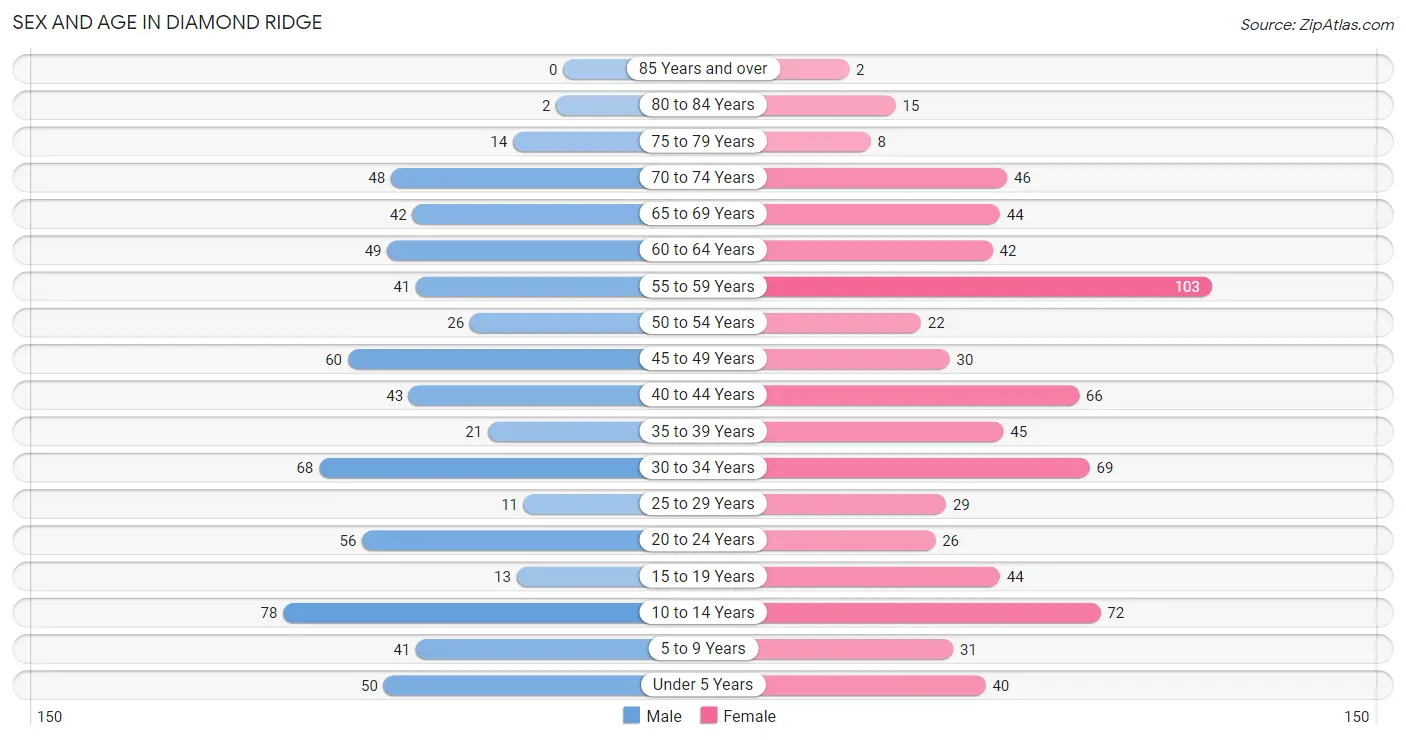
The most populous age groups in Diamond Ridge are 10 to 14 Years (78 | 11.8%) for men and 55 to 59 Years (103 | 14.0%) for women.
| Age Bracket | Male | Female |
| Under 5 Years | 50 (7.5%) | 40 (5.4%) |
| 5 to 9 Years | 41 (6.2%) | 31 (4.2%) |
| 10 to 14 Years | 78 (11.8%) | 72 (9.8%) |
| 15 to 19 Years | 13 (2.0%) | 44 (6.0%) |
| 20 to 24 Years | 56 (8.5%) | 26 (3.5%) |
| 25 to 29 Years | 11 (1.7%) | 29 (4.0%) |
| 30 to 34 Years | 68 (10.3%) | 69 (9.4%) |
| 35 to 39 Years | 21 (3.2%) | 45 (6.1%) |
| 40 to 44 Years | 43 (6.5%) | 66 (9.0%) |
| 45 to 49 Years | 60 (9.0%) | 30 (4.1%) |
| 50 to 54 Years | 26 (3.9%) | 22 (3.0%) |
| 55 to 59 Years | 41 (6.2%) | 103 (14.0%) |
| 60 to 64 Years | 49 (7.4%) | 42 (5.7%) |
| 65 to 69 Years | 42 (6.3%) | 44 (6.0%) |
| 70 to 74 Years | 48 (7.2%) | 46 (6.3%) |
| 75 to 79 Years | 14 (2.1%) | 8 (1.1%) |
| 80 to 84 Years | 2 (0.3%) | 15 (2.0%) |
| 85 Years and over | 0 (0.0%) | 2 (0.3%) |
| Total | 663 (100.0%) | 734 (100.0%) |
Families and Households in Diamond Ridge
Median Family Size in Diamond Ridge
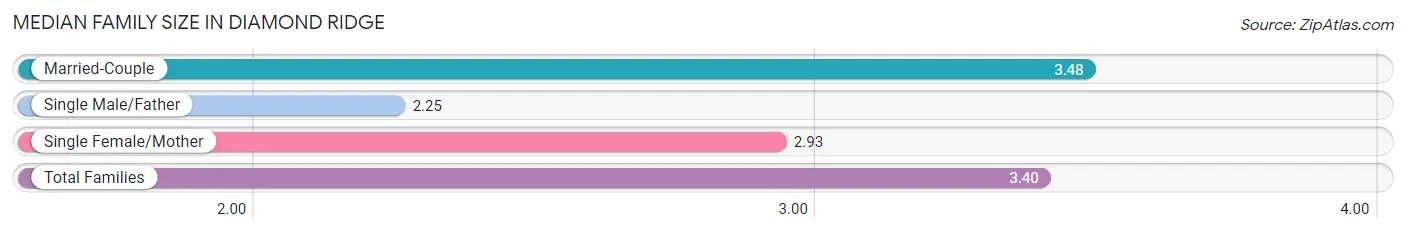
The median family size in Diamond Ridge is 3.40 persons per family, with married-couple families (280 | 86.4%) accounting for the largest median family size of 3.48 persons per family. On the other hand, single male/father families (4 | 1.2%) represent the smallest median family size with 2.25 persons per family.
| Family Type | # Families | Family Size |
| Married-Couple | 280 (86.4%) | 3.48 |
| Single Male/Father | 4 (1.2%) | 2.25 |
| Single Female/Mother | 40 (12.3%) | 2.93 |
| Total Families | 324 (100.0%) | 3.40 |
Median Household Size in Diamond Ridge
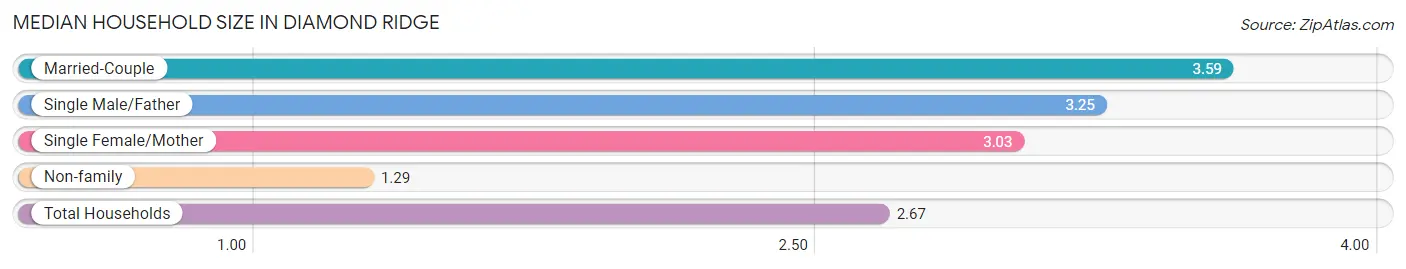
The median household size in Diamond Ridge is 2.67 persons per household, with married-couple households (280 | 53.4%) accounting for the largest median household size of 3.59 persons per household. non-family households (200 | 38.2%) represent the smallest median household size with 1.29 persons per household.
| Household Type | # Households | Household Size |
| Married-Couple | 280 (53.4%) | 3.59 |
| Single Male/Father | 4 (0.8%) | 3.25 |
| Single Female/Mother | 40 (7.6%) | 3.03 |
| Non-family | 200 (38.2%) | 1.29 |
| Total Households | 524 (100.0%) | 2.67 |
Household Size by Marriage Status in Diamond Ridge
Out of a total of 524 households in Diamond Ridge, 324 (61.8%) are family households, while 200 (38.2%) are nonfamily households. The most numerous type of family households are 2-person households, comprising 154, and the most common type of nonfamily households are 1-person households, comprising 160.
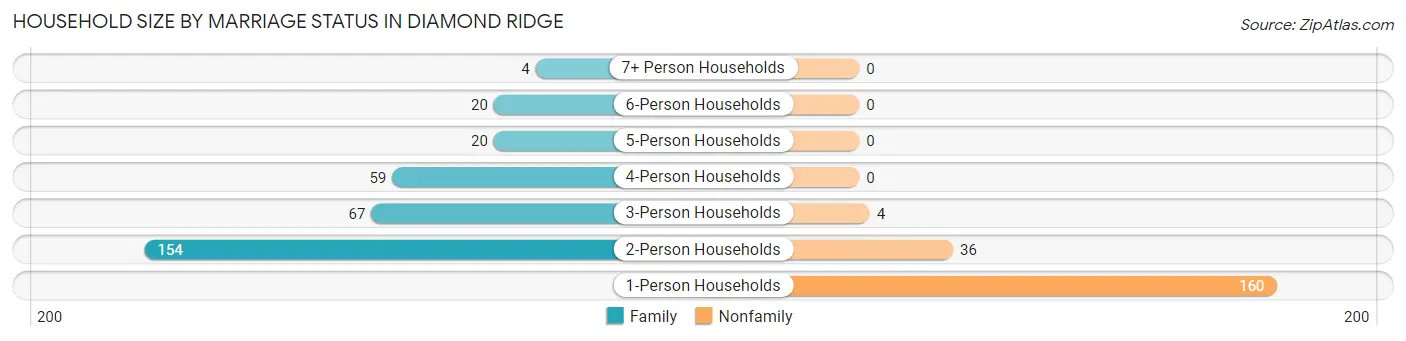
| Household Size | Family Households | Nonfamily Households |
| 1-Person Households | - | 160 (30.5%) |
| 2-Person Households | 154 (29.4%) | 36 (6.9%) |
| 3-Person Households | 67 (12.8%) | 4 (0.8%) |
| 4-Person Households | 59 (11.3%) | 0 (0.0%) |
| 5-Person Households | 20 (3.8%) | 0 (0.0%) |
| 6-Person Households | 20 (3.8%) | 0 (0.0%) |
| 7+ Person Households | 4 (0.8%) | 0 (0.0%) |
| Total | 324 (61.8%) | 200 (38.2%) |
Female Fertility in Diamond Ridge
Fertility by Age in Diamond Ridge
Average fertility rate in Diamond Ridge is 32.0 births per 1,000 women. Women in the age bracket of 20 to 34 years have the highest fertility rate with 48.0 births per 1,000 women. Women in the age bracket of 20 to 34 years acount for 60.0% of all women with births.
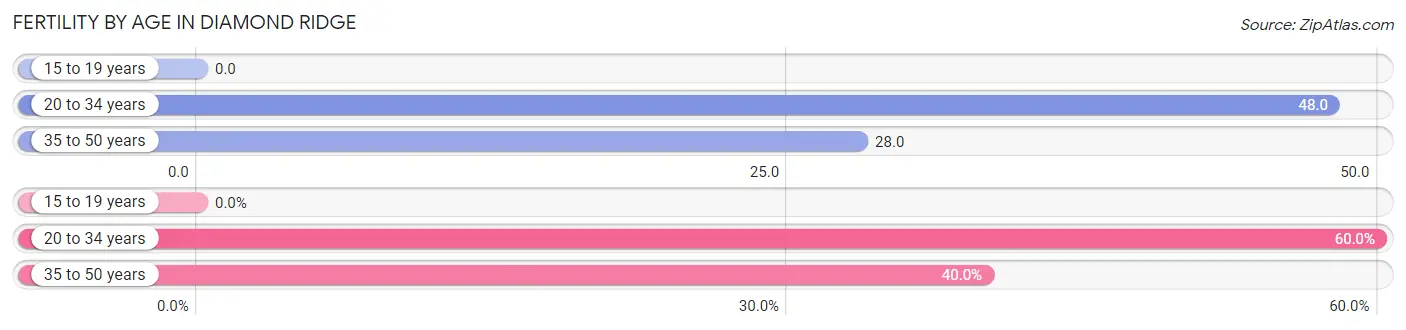
| Age Bracket | Women with Births | Births / 1,000 Women |
| 15 to 19 years | 0 (0.0%) | 0.0 |
| 20 to 34 years | 6 (60.0%) | 48.0 |
| 35 to 50 years | 4 (40.0%) | 28.0 |
| Total | 10 (100.0%) | 32.0 |
Fertility by Age by Marriage Status in Diamond Ridge
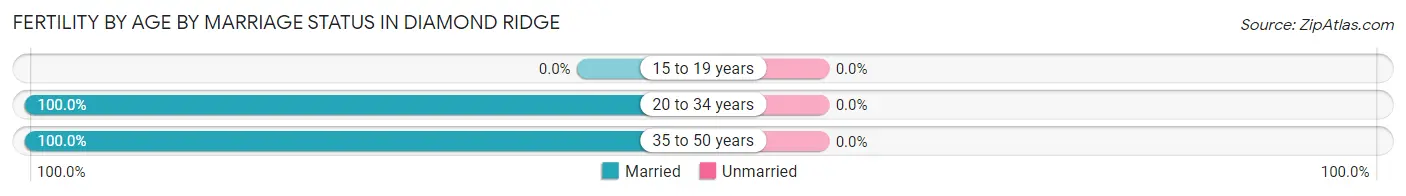
| Age Bracket | Married | Unmarried |
| 15 to 19 years | 0 (0.0%) | 0 (0.0%) |
| 20 to 34 years | 6 (100.0%) | 0 (0.0%) |
| 35 to 50 years | 4 (100.0%) | 0 (0.0%) |
| Total | 10 (100.0%) | 0 (0.0%) |
Fertility by Education in Diamond Ridge
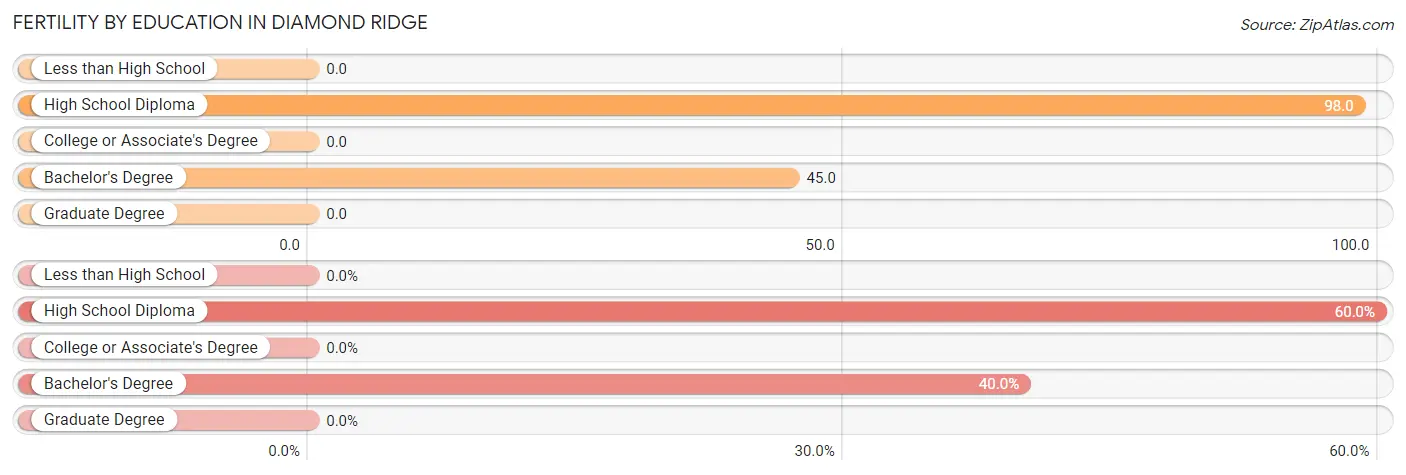
| Educational Attainment | Women with Births | Births / 1,000 Women |
| Less than High School | 0 (0.0%) | 0.0 |
| High School Diploma | 6 (60.0%) | 98.0 |
| College or Associate's Degree | 0 (0.0%) | 0.0 |
| Bachelor's Degree | 4 (40.0%) | 45.0 |
| Graduate Degree | 0 (0.0%) | 0.0 |
| Total | 10 (100.0%) | 32.0 |
Fertility by Education by Marriage Status in Diamond Ridge
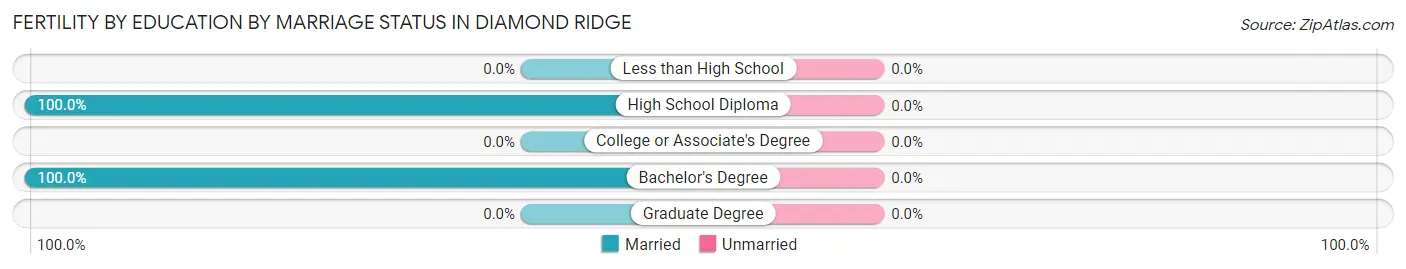
| Educational Attainment | Married | Unmarried |
| Less than High School | 0 (0.0%) | 0 (0.0%) |
| High School Diploma | 6 (100.0%) | 0 (0.0%) |
| College or Associate's Degree | 0 (0.0%) | 0 (0.0%) |
| Bachelor's Degree | 4 (100.0%) | 0 (0.0%) |
| Graduate Degree | 0 (0.0%) | 0 (0.0%) |
| Total | 10 (100.0%) | 0 (0.0%) |
Employment Characteristics in Diamond Ridge
Employment by Class of Employer in Diamond Ridge
Among the 577 employed individuals in Diamond Ridge, private company employees (236 | 40.9%), local government employees (93 | 16.1%), and not-for-profit organizations (87 | 15.1%) make up the most common classes of employment.
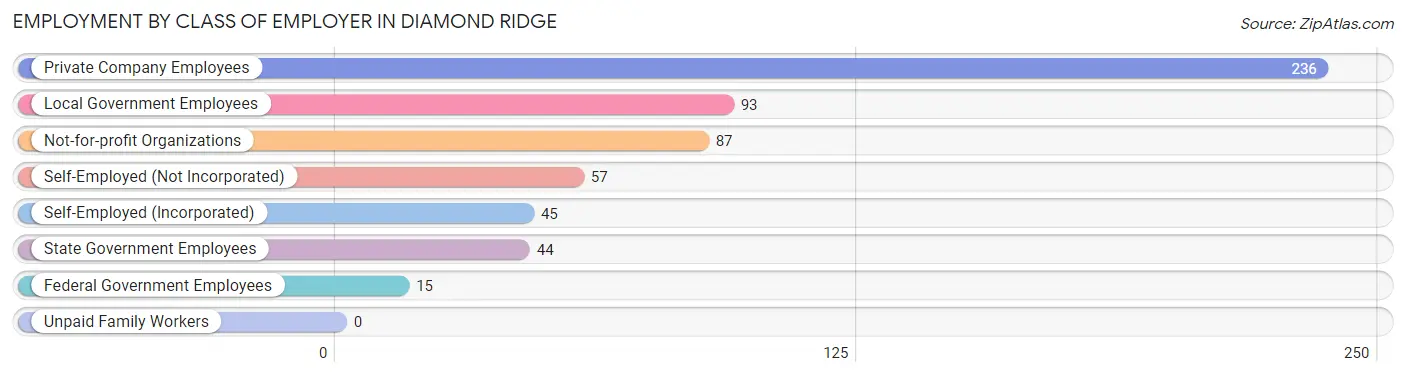
| Employer Class | # Employees | % Employees |
| Private Company Employees | 236 | 40.9% |
| Self-Employed (Incorporated) | 45 | 7.8% |
| Self-Employed (Not Incorporated) | 57 | 9.9% |
| Not-for-profit Organizations | 87 | 15.1% |
| Local Government Employees | 93 | 16.1% |
| State Government Employees | 44 | 7.6% |
| Federal Government Employees | 15 | 2.6% |
| Unpaid Family Workers | 0 | 0.0% |
| Total | 577 | 100.0% |
Employment Status by Age in Diamond Ridge
According to the labor force statistics for Diamond Ridge, out of the total population over 16 years of age (1,074), 56.6% or 608 individuals are in the labor force, with 2.3% or 14 of them unemployed. The age group with the highest labor force participation rate is 25 to 29 years, with 85.0% or 34 individuals in the labor force. Within the labor force, the 55 to 59 years age range has the highest percentage of unemployed individuals, with 6.1% or 4 of them being unemployed.
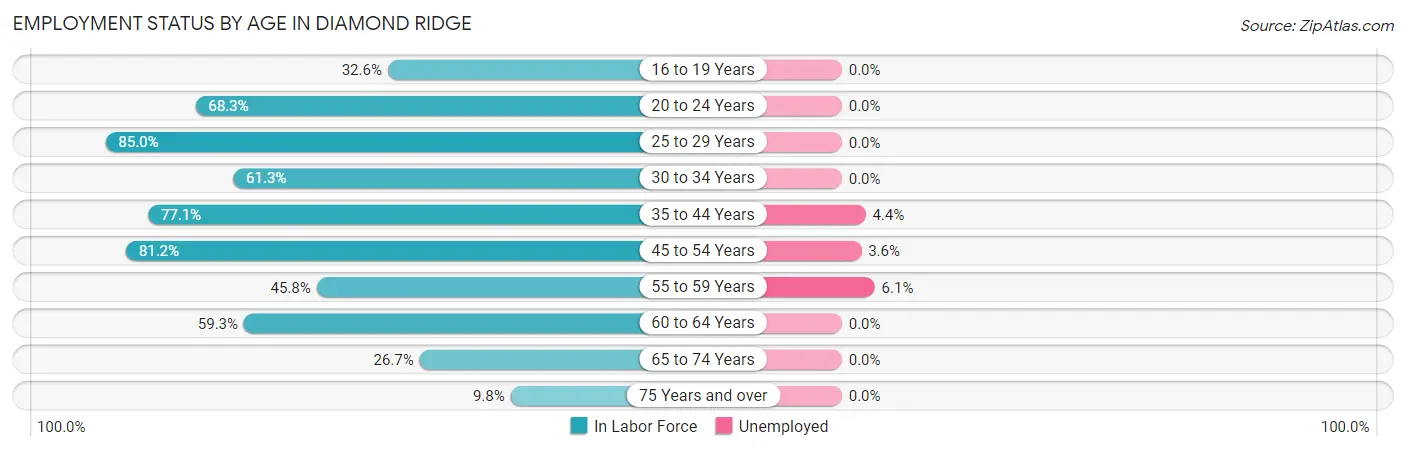
| Age Bracket | In Labor Force | Unemployed |
| 16 to 19 Years | 15 (32.6%) | 0 (0.0%) |
| 20 to 24 Years | 56 (68.3%) | 0 (0.0%) |
| 25 to 29 Years | 34 (85.0%) | 0 (0.0%) |
| 30 to 34 Years | 84 (61.3%) | 0 (0.0%) |
| 35 to 44 Years | 135 (77.1%) | 6 (4.4%) |
| 45 to 54 Years | 112 (81.2%) | 4 (3.6%) |
| 55 to 59 Years | 66 (45.8%) | 4 (6.1%) |
| 60 to 64 Years | 54 (59.3%) | 0 (0.0%) |
| 65 to 74 Years | 48 (26.7%) | 0 (0.0%) |
| 75 Years and over | 4 (9.8%) | 0 (0.0%) |
| Total | 608 (56.6%) | 14 (2.3%) |
Employment Status by Educational Attainment in Diamond Ridge
According to labor force statistics for Diamond Ridge, 66.9% of individuals (485) out of the total population between 25 and 64 years of age (725) are in the labor force, with 2.9% or 14 of them being unemployed. The group with the highest labor force participation rate are those with the educational attainment of college / associate degree, with 71.7% or 167 individuals in the labor force. Within the labor force, individuals with bachelor's degree or higher education have the highest percentage of unemployment, with 5.0% or 10 of them being unemployed.
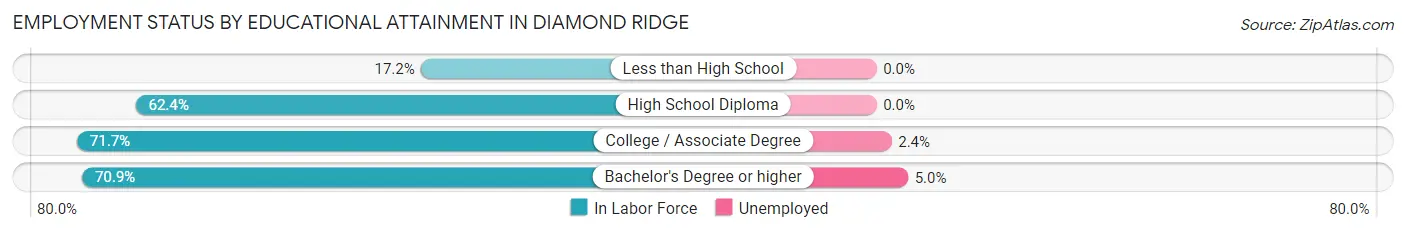
| Educational Attainment | In Labor Force | Unemployed |
| Less than High School | 5 (17.2%) | 0 (0.0%) |
| High School Diploma | 111 (62.4%) | 0 (0.0%) |
| College / Associate Degree | 167 (71.7%) | 6 (2.4%) |
| Bachelor's Degree or higher | 202 (70.9%) | 14 (5.0%) |
| Total | 485 (66.9%) | 21 (2.9%) |
Employment Occupations by Sex in Diamond Ridge
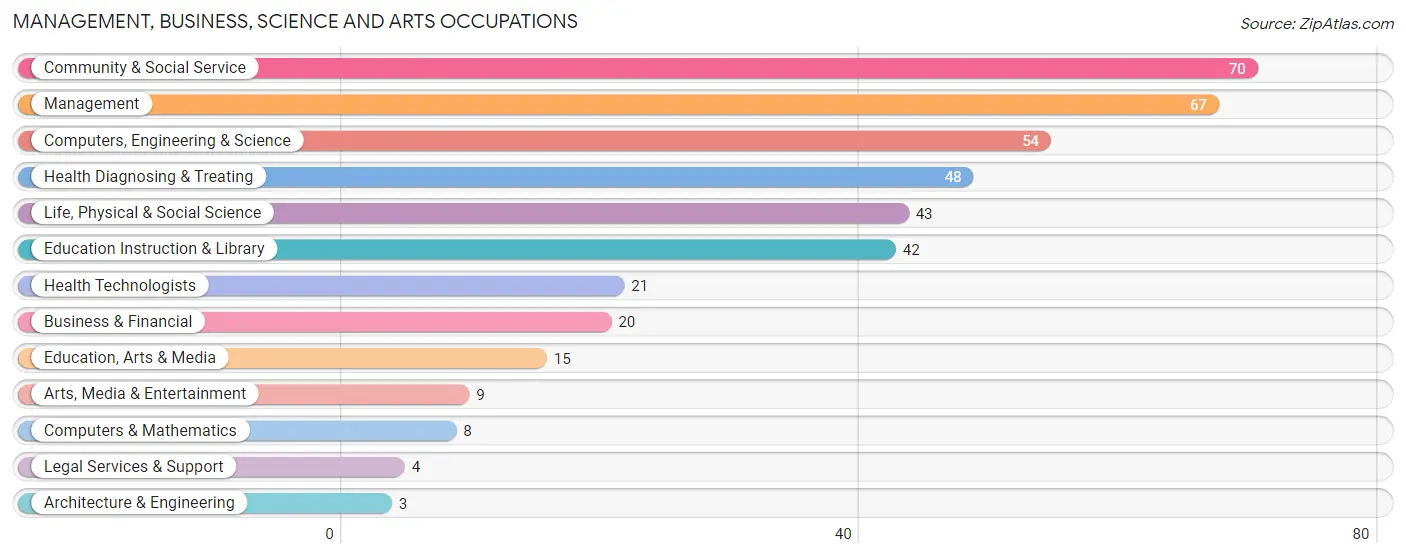
Management, Business, Science and Arts Occupations
The most common Management, Business, Science and Arts occupations in Diamond Ridge are Community & Social Service (70 | 11.8%), Management (67 | 11.3%), Computers, Engineering & Science (54 | 9.1%), Health Diagnosing & Treating (48 | 8.1%), and Life, Physical & Social Science (43 | 7.2%).
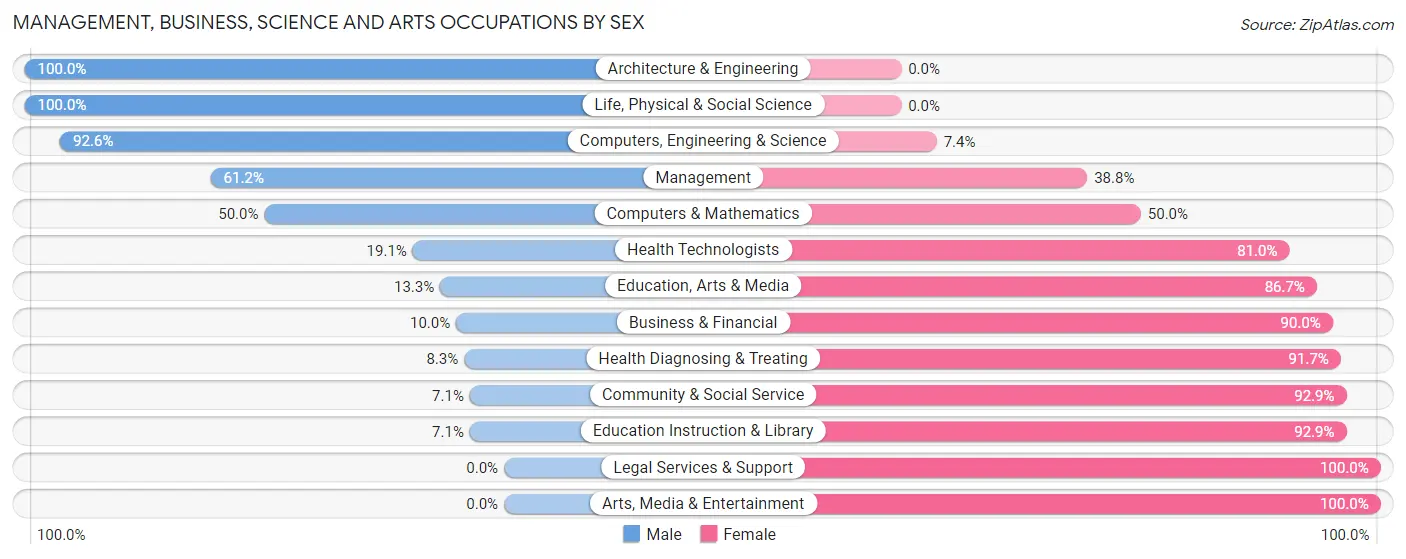
Management, Business, Science and Arts Occupations by Sex
Within the Management, Business, Science and Arts occupations in Diamond Ridge, the most male-oriented occupations are Architecture & Engineering (100.0%), Life, Physical & Social Science (100.0%), and Computers, Engineering & Science (92.6%), while the most female-oriented occupations are Legal Services & Support (100.0%), Arts, Media & Entertainment (100.0%), and Community & Social Service (92.9%).
| Occupation | Male | Female |
| Management | 41 (61.2%) | 26 (38.8%) |
| Business & Financial | 2 (10.0%) | 18 (90.0%) |
| Computers, Engineering & Science | 50 (92.6%) | 4 (7.4%) |
| Computers & Mathematics | 4 (50.0%) | 4 (50.0%) |
| Architecture & Engineering | 3 (100.0%) | 0 (0.0%) |
| Life, Physical & Social Science | 43 (100.0%) | 0 (0.0%) |
| Community & Social Service | 5 (7.1%) | 65 (92.9%) |
| Education, Arts & Media | 2 (13.3%) | 13 (86.7%) |
| Legal Services & Support | 0 (0.0%) | 4 (100.0%) |
| Education Instruction & Library | 3 (7.1%) | 39 (92.9%) |
| Arts, Media & Entertainment | 0 (0.0%) | 9 (100.0%) |
| Health Diagnosing & Treating | 4 (8.3%) | 44 (91.7%) |
| Health Technologists | 4 (19.1%) | 17 (80.9%) |
| Total (Category) | 102 (39.4%) | 157 (60.6%) |
| Total (Overall) | 318 (53.5%) | 276 (46.5%) |
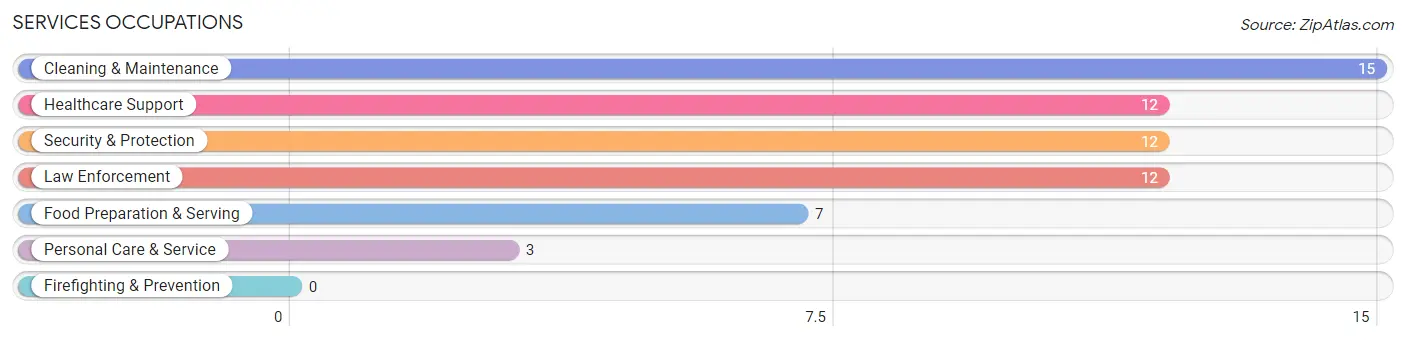
Services Occupations
The most common Services occupations in Diamond Ridge are Cleaning & Maintenance (15 | 2.5%), Healthcare Support (12 | 2.0%), Security & Protection (12 | 2.0%), Law Enforcement (12 | 2.0%), and Food Preparation & Serving (7 | 1.2%).
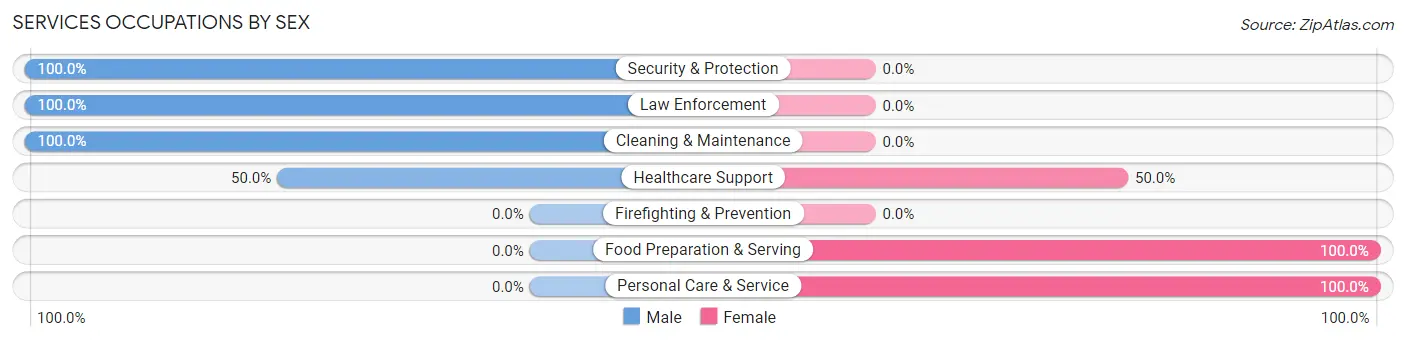
Services Occupations by Sex
Within the Services occupations in Diamond Ridge, the most male-oriented occupations are Security & Protection (100.0%), Law Enforcement (100.0%), and Cleaning & Maintenance (100.0%), while the most female-oriented occupations are Food Preparation & Serving (100.0%), Personal Care & Service (100.0%), and Healthcare Support (50.0%).
| Occupation | Male | Female |
| Healthcare Support | 6 (50.0%) | 6 (50.0%) |
| Security & Protection | 12 (100.0%) | 0 (0.0%) |
| Firefighting & Prevention | 0 (0.0%) | 0 (0.0%) |
| Law Enforcement | 12 (100.0%) | 0 (0.0%) |
| Food Preparation & Serving | 0 (0.0%) | 7 (100.0%) |
| Cleaning & Maintenance | 15 (100.0%) | 0 (0.0%) |
| Personal Care & Service | 0 (0.0%) | 3 (100.0%) |
| Total (Category) | 33 (67.3%) | 16 (32.7%) |
| Total (Overall) | 318 (53.5%) | 276 (46.5%) |
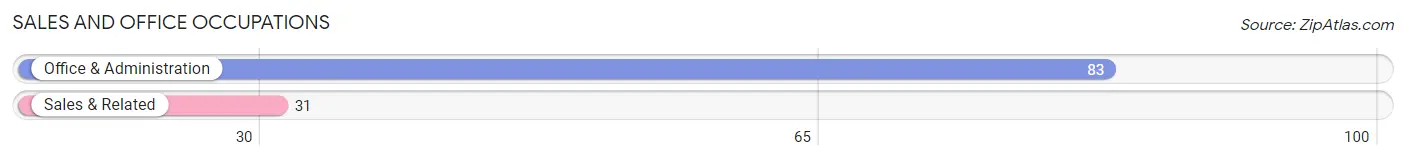
Sales and Office Occupations
The most common Sales and Office occupations in Diamond Ridge are Office & Administration (83 | 14.0%), and Sales & Related (31 | 5.2%).
Sales and Office Occupations by Sex
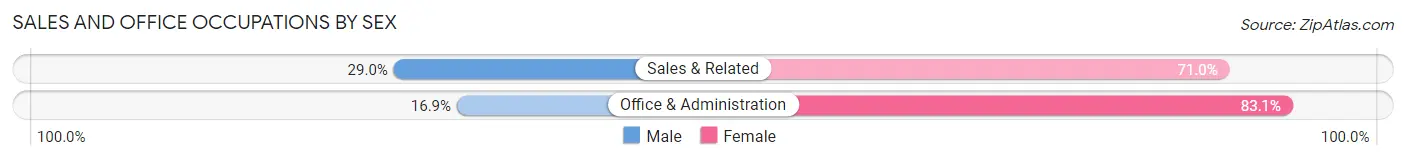
| Occupation | Male | Female |
| Sales & Related | 9 (29.0%) | 22 (71.0%) |
| Office & Administration | 14 (16.9%) | 69 (83.1%) |
| Total (Category) | 23 (20.2%) | 91 (79.8%) |
| Total (Overall) | 318 (53.5%) | 276 (46.5%) |
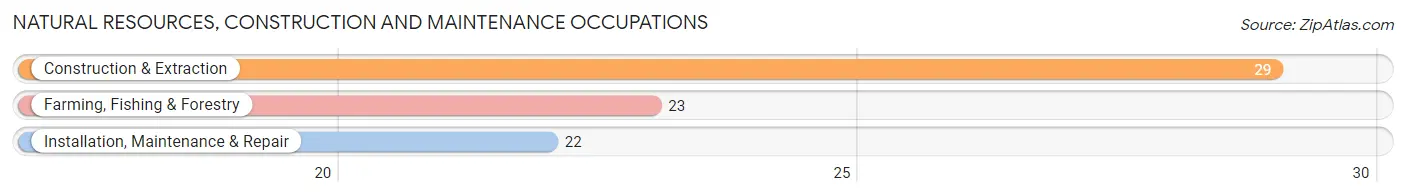
Natural Resources, Construction and Maintenance Occupations
The most common Natural Resources, Construction and Maintenance occupations in Diamond Ridge are Construction & Extraction (29 | 4.9%), Farming, Fishing & Forestry (23 | 3.9%), and Installation, Maintenance & Repair (22 | 3.7%).
Natural Resources, Construction and Maintenance Occupations by Sex
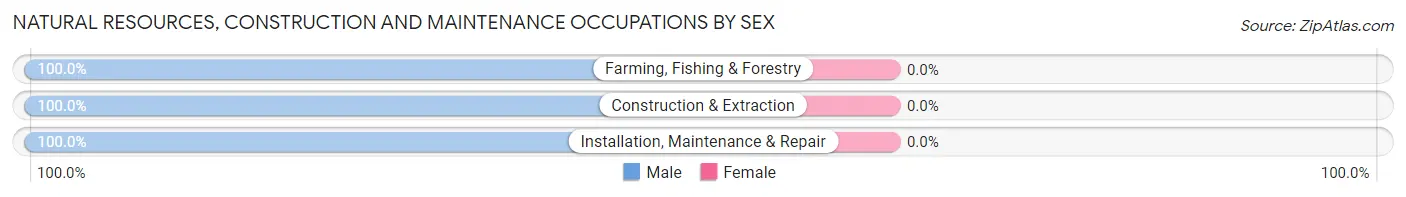
| Occupation | Male | Female |
| Farming, Fishing & Forestry | 23 (100.0%) | 0 (0.0%) |
| Construction & Extraction | 29 (100.0%) | 0 (0.0%) |
| Installation, Maintenance & Repair | 22 (100.0%) | 0 (0.0%) |
| Total (Category) | 74 (100.0%) | 0 (0.0%) |
| Total (Overall) | 318 (53.5%) | 276 (46.5%) |
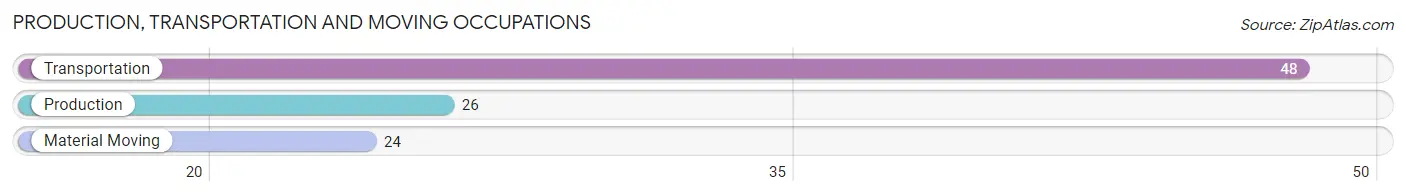
Production, Transportation and Moving Occupations
The most common Production, Transportation and Moving occupations in Diamond Ridge are Transportation (48 | 8.1%), Production (26 | 4.4%), and Material Moving (24 | 4.0%).
Production, Transportation and Moving Occupations by Sex
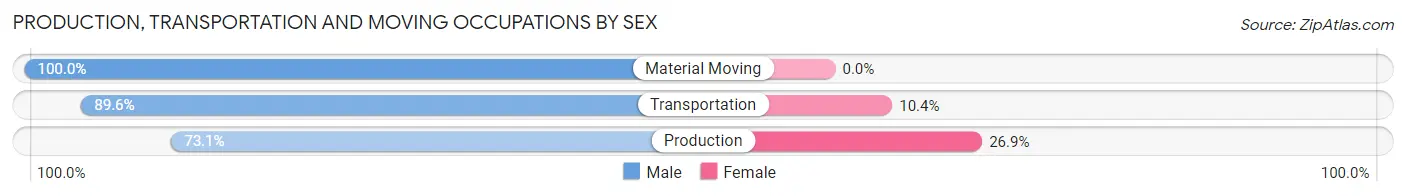
| Occupation | Male | Female |
| Production | 19 (73.1%) | 7 (26.9%) |
| Transportation | 43 (89.6%) | 5 (10.4%) |
| Material Moving | 24 (100.0%) | 0 (0.0%) |
| Total (Category) | 86 (87.8%) | 12 (12.2%) |
| Total (Overall) | 318 (53.5%) | 276 (46.5%) |
Employment Industries by Sex in Diamond Ridge
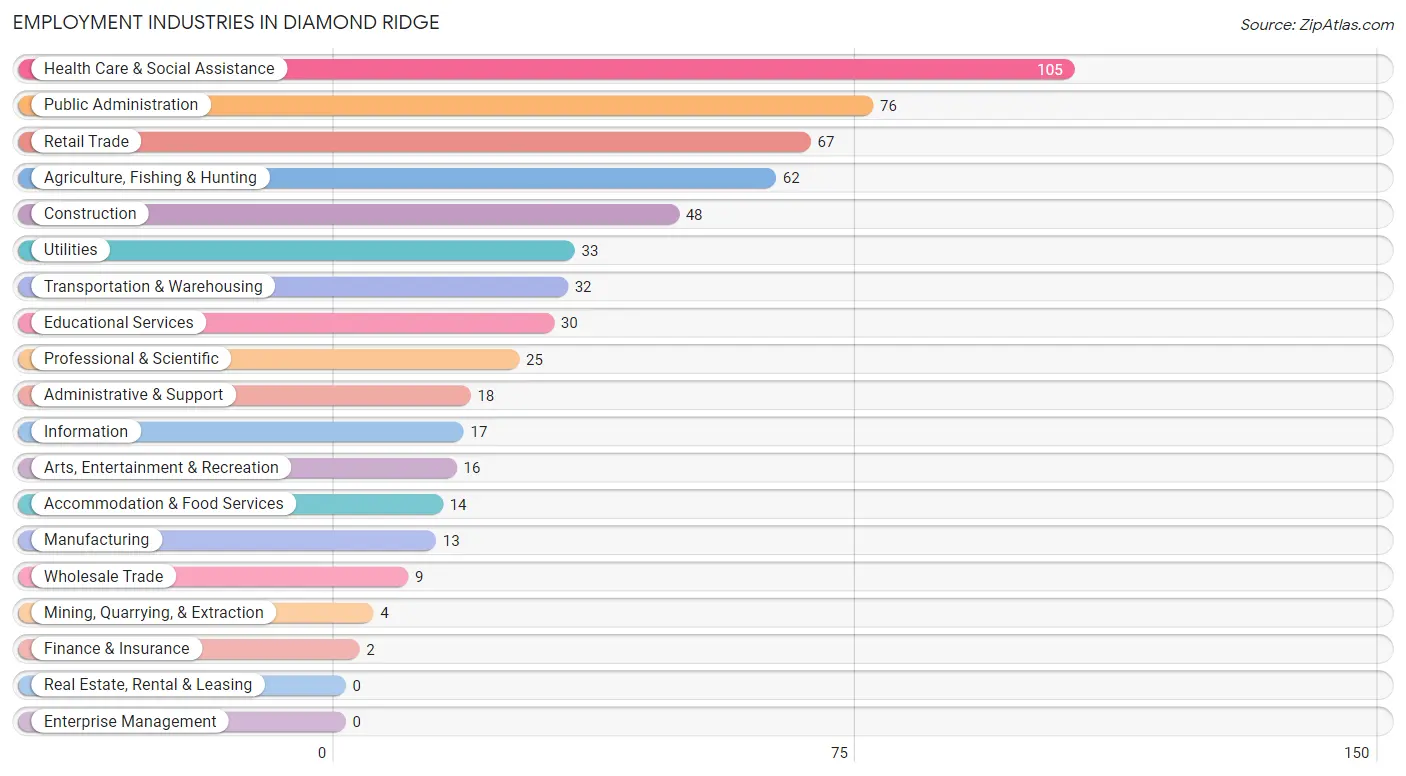
Employment Industries in Diamond Ridge
The major employment industries in Diamond Ridge include Health Care & Social Assistance (105 | 17.7%), Public Administration (76 | 12.8%), Retail Trade (67 | 11.3%), Agriculture, Fishing & Hunting (62 | 10.4%), and Construction (48 | 8.1%).
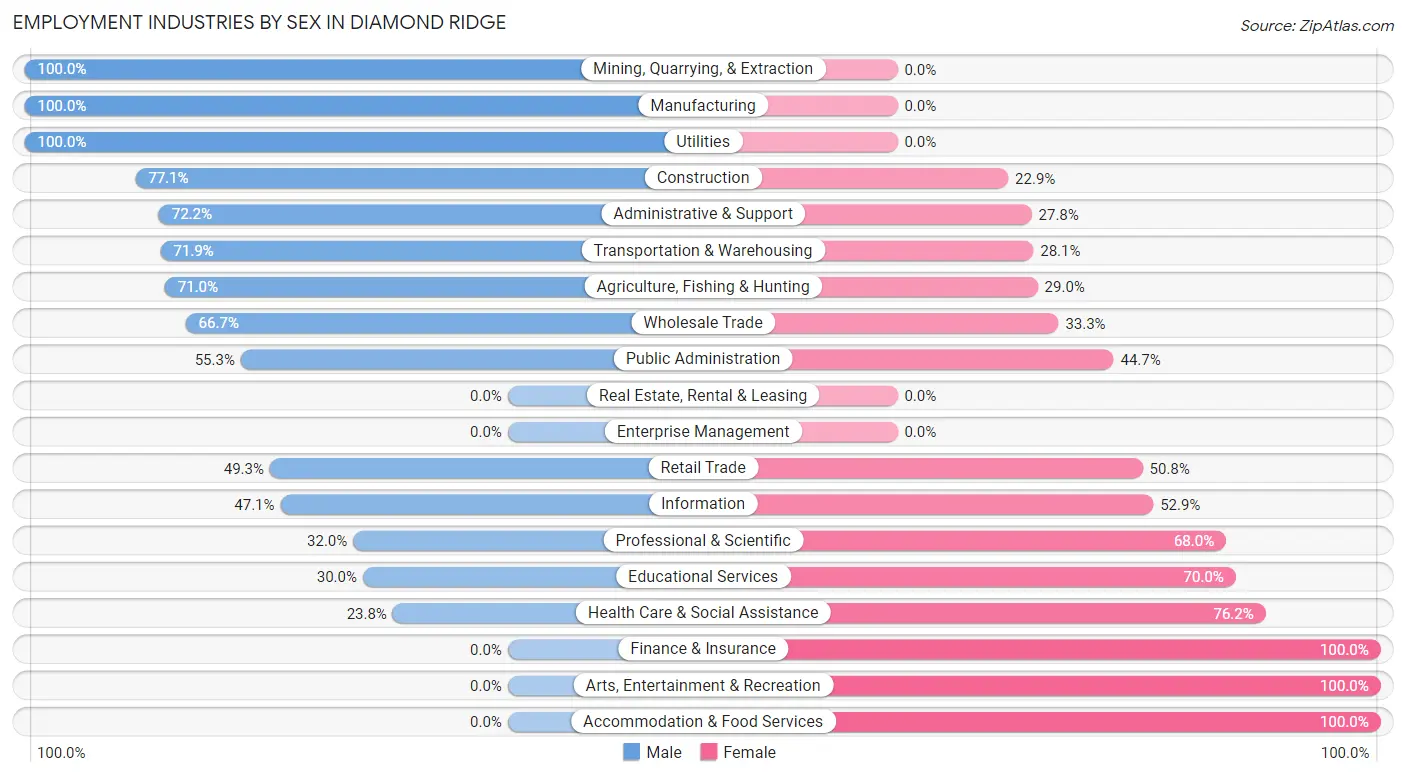
Employment Industries by Sex in Diamond Ridge
The Diamond Ridge industries that see more men than women are Mining, Quarrying, & Extraction (100.0%), Manufacturing (100.0%), and Utilities (100.0%), whereas the industries that tend to have a higher number of women are Finance & Insurance (100.0%), Arts, Entertainment & Recreation (100.0%), and Accommodation & Food Services (100.0%).
| Industry | Male | Female |
| Agriculture, Fishing & Hunting | 44 (71.0%) | 18 (29.0%) |
| Mining, Quarrying, & Extraction | 4 (100.0%) | 0 (0.0%) |
| Construction | 37 (77.1%) | 11 (22.9%) |
| Manufacturing | 13 (100.0%) | 0 (0.0%) |
| Wholesale Trade | 6 (66.7%) | 3 (33.3%) |
| Retail Trade | 33 (49.2%) | 34 (50.7%) |
| Transportation & Warehousing | 23 (71.9%) | 9 (28.1%) |
| Utilities | 33 (100.0%) | 0 (0.0%) |
| Information | 8 (47.1%) | 9 (52.9%) |
| Finance & Insurance | 0 (0.0%) | 2 (100.0%) |
| Real Estate, Rental & Leasing | 0 (0.0%) | 0 (0.0%) |
| Professional & Scientific | 8 (32.0%) | 17 (68.0%) |
| Enterprise Management | 0 (0.0%) | 0 (0.0%) |
| Administrative & Support | 13 (72.2%) | 5 (27.8%) |
| Educational Services | 9 (30.0%) | 21 (70.0%) |
| Health Care & Social Assistance | 25 (23.8%) | 80 (76.2%) |
| Arts, Entertainment & Recreation | 0 (0.0%) | 16 (100.0%) |
| Accommodation & Food Services | 0 (0.0%) | 14 (100.0%) |
| Public Administration | 42 (55.3%) | 34 (44.7%) |
| Total | 318 (53.5%) | 276 (46.5%) |
Education in Diamond Ridge
School Enrollment in Diamond Ridge
The most common levels of schooling among the 352 students in Diamond Ridge are middle school (101 | 28.7%), high school (75 | 21.3%), and elementary school (68 | 19.3%).
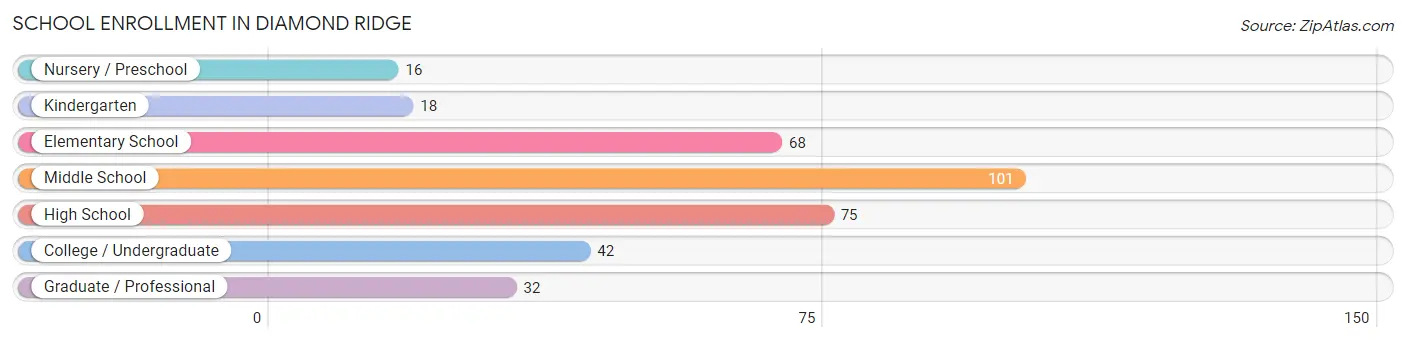
| School Level | # Students | % Students |
| Nursery / Preschool | 16 | 4.5% |
| Kindergarten | 18 | 5.1% |
| Elementary School | 68 | 19.3% |
| Middle School | 101 | 28.7% |
| High School | 75 | 21.3% |
| College / Undergraduate | 42 | 11.9% |
| Graduate / Professional | 32 | 9.1% |
| Total | 352 | 100.0% |
School Enrollment by Age by Funding Source in Diamond Ridge
Out of a total of 352 students who are enrolled in schools in Diamond Ridge, 36 (10.2%) attend a private institution, while the remaining 316 (89.8%) are enrolled in public schools. The age group of 3 to 4 year olds has the highest likelihood of being enrolled in private schools, with 6 (54.5% in the age bracket) enrolled. Conversely, the age group of 15 to 17 year olds has the lowest likelihood of being enrolled in a private school, with 49 (100.0% in the age bracket) attending a public institution.
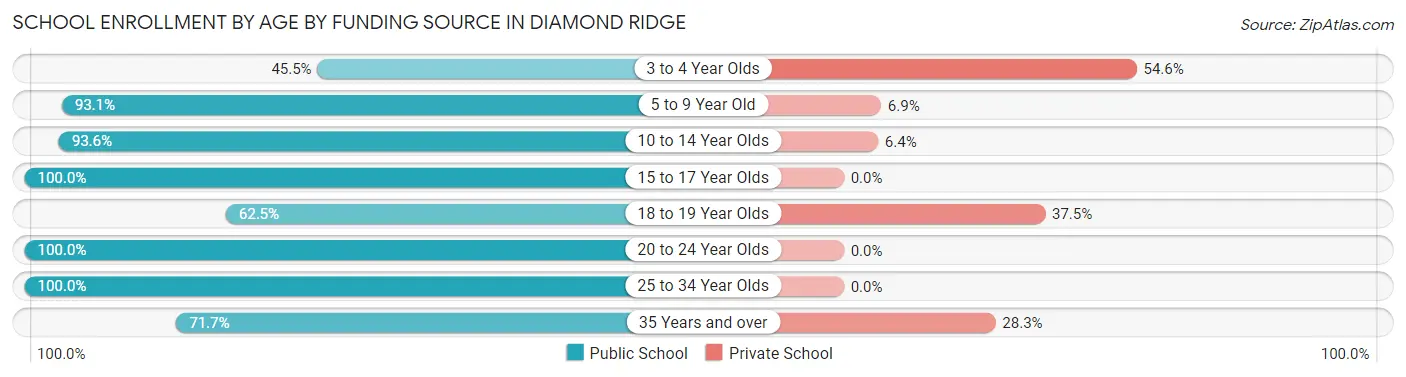
| Age Bracket | Public School | Private School |
| 3 to 4 Year Olds | 5 (45.5%) | 6 (54.5%) |
| 5 to 9 Year Old | 67 (93.1%) | 5 (6.9%) |
| 10 to 14 Year Olds | 132 (93.6%) | 9 (6.4%) |
| 15 to 17 Year Olds | 49 (100.0%) | 0 (0.0%) |
| 18 to 19 Year Olds | 5 (62.5%) | 3 (37.5%) |
| 20 to 24 Year Olds | 10 (100.0%) | 0 (0.0%) |
| 25 to 34 Year Olds | 15 (100.0%) | 0 (0.0%) |
| 35 Years and over | 33 (71.7%) | 13 (28.3%) |
| Total | 316 (89.8%) | 36 (10.2%) |
Educational Attainment by Field of Study in Diamond Ridge
Bio, nature & agricultural (95 | 21.2%), education (56 | 12.5%), visual & performing arts (39 | 8.7%), science & technology (38 | 8.5%), and business (34 | 7.6%) are the most common fields of study among 448 individuals in Diamond Ridge who have obtained a bachelor's degree or higher.
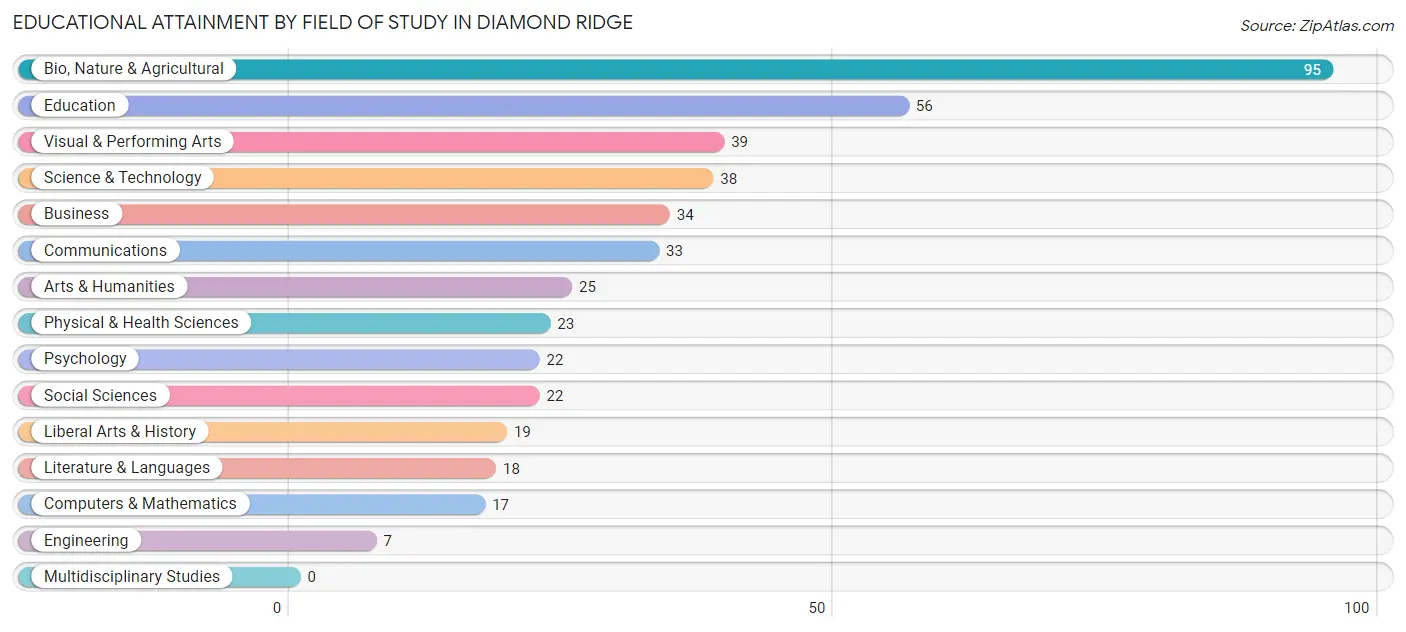
| Field of Study | # Graduates | % Graduates |
| Computers & Mathematics | 17 | 3.8% |
| Bio, Nature & Agricultural | 95 | 21.2% |
| Physical & Health Sciences | 23 | 5.1% |
| Psychology | 22 | 4.9% |
| Social Sciences | 22 | 4.9% |
| Engineering | 7 | 1.6% |
| Multidisciplinary Studies | 0 | 0.0% |
| Science & Technology | 38 | 8.5% |
| Business | 34 | 7.6% |
| Education | 56 | 12.5% |
| Literature & Languages | 18 | 4.0% |
| Liberal Arts & History | 19 | 4.2% |
| Visual & Performing Arts | 39 | 8.7% |
| Communications | 33 | 7.4% |
| Arts & Humanities | 25 | 5.6% |
| Total | 448 | 100.0% |
Transportation & Commute in Diamond Ridge
Vehicle Availability by Sex in Diamond Ridge
The most prevalent vehicle ownership categories in Diamond Ridge are males with 2 vehicles (127, accounting for 40.8%) and females with 2 vehicles (122, making up 47.7%).
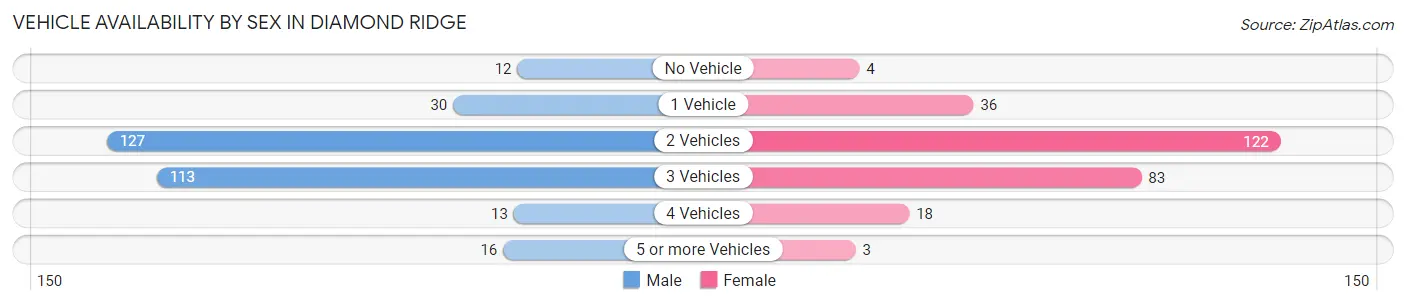
| Vehicles Available | Male | Female |
| No Vehicle | 12 (3.9%) | 4 (1.5%) |
| 1 Vehicle | 30 (9.7%) | 36 (13.5%) |
| 2 Vehicles | 127 (40.8%) | 122 (45.9%) |
| 3 Vehicles | 113 (36.3%) | 83 (31.2%) |
| 4 Vehicles | 13 (4.2%) | 18 (6.8%) |
| 5 or more Vehicles | 16 (5.1%) | 3 (1.1%) |
| Total | 311 (100.0%) | 266 (100.0%) |
Commute Time in Diamond Ridge
The most frequently occuring commute durations in Diamond Ridge are 10 to 14 minutes (171 commuters, 34.0%), 15 to 19 minutes (108 commuters, 21.5%), and 20 to 24 minutes (82 commuters, 16.3%).
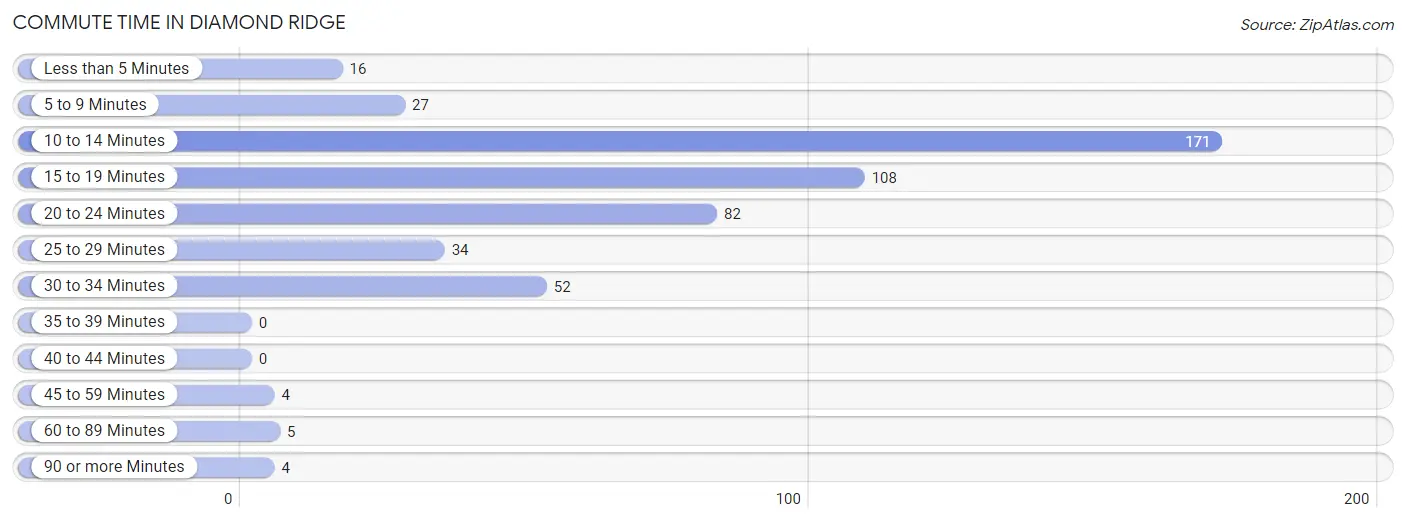
| Commute Time | # Commuters | % Commuters |
| Less than 5 Minutes | 16 | 3.2% |
| 5 to 9 Minutes | 27 | 5.4% |
| 10 to 14 Minutes | 171 | 34.0% |
| 15 to 19 Minutes | 108 | 21.5% |
| 20 to 24 Minutes | 82 | 16.3% |
| 25 to 29 Minutes | 34 | 6.8% |
| 30 to 34 Minutes | 52 | 10.3% |
| 35 to 39 Minutes | 0 | 0.0% |
| 40 to 44 Minutes | 0 | 0.0% |
| 45 to 59 Minutes | 4 | 0.8% |
| 60 to 89 Minutes | 5 | 1.0% |
| 90 or more Minutes | 4 | 0.8% |
Commute Time by Sex in Diamond Ridge
The most common commute times in Diamond Ridge are 10 to 14 minutes (88 commuters, 31.9%) for males and 10 to 14 minutes (83 commuters, 36.6%) for females.
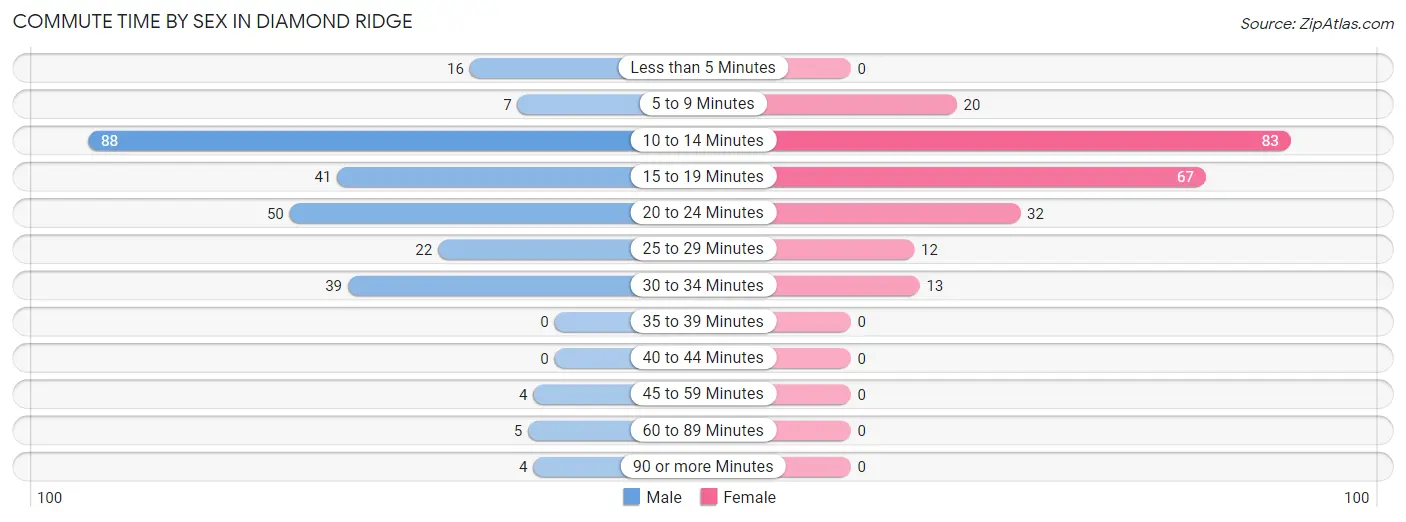
| Commute Time | Male | Female |
| Less than 5 Minutes | 16 (5.8%) | 0 (0.0%) |
| 5 to 9 Minutes | 7 (2.5%) | 20 (8.8%) |
| 10 to 14 Minutes | 88 (31.9%) | 83 (36.6%) |
| 15 to 19 Minutes | 41 (14.9%) | 67 (29.5%) |
| 20 to 24 Minutes | 50 (18.1%) | 32 (14.1%) |
| 25 to 29 Minutes | 22 (8.0%) | 12 (5.3%) |
| 30 to 34 Minutes | 39 (14.1%) | 13 (5.7%) |
| 35 to 39 Minutes | 0 (0.0%) | 0 (0.0%) |
| 40 to 44 Minutes | 0 (0.0%) | 0 (0.0%) |
| 45 to 59 Minutes | 4 (1.5%) | 0 (0.0%) |
| 60 to 89 Minutes | 5 (1.8%) | 0 (0.0%) |
| 90 or more Minutes | 4 (1.5%) | 0 (0.0%) |
Time of Departure to Work by Sex in Diamond Ridge
The most frequent times of departure to work in Diamond Ridge are 8:00 AM to 8:29 AM (63, 22.8%) for males and 7:30 AM to 7:59 AM (52, 22.9%) for females.
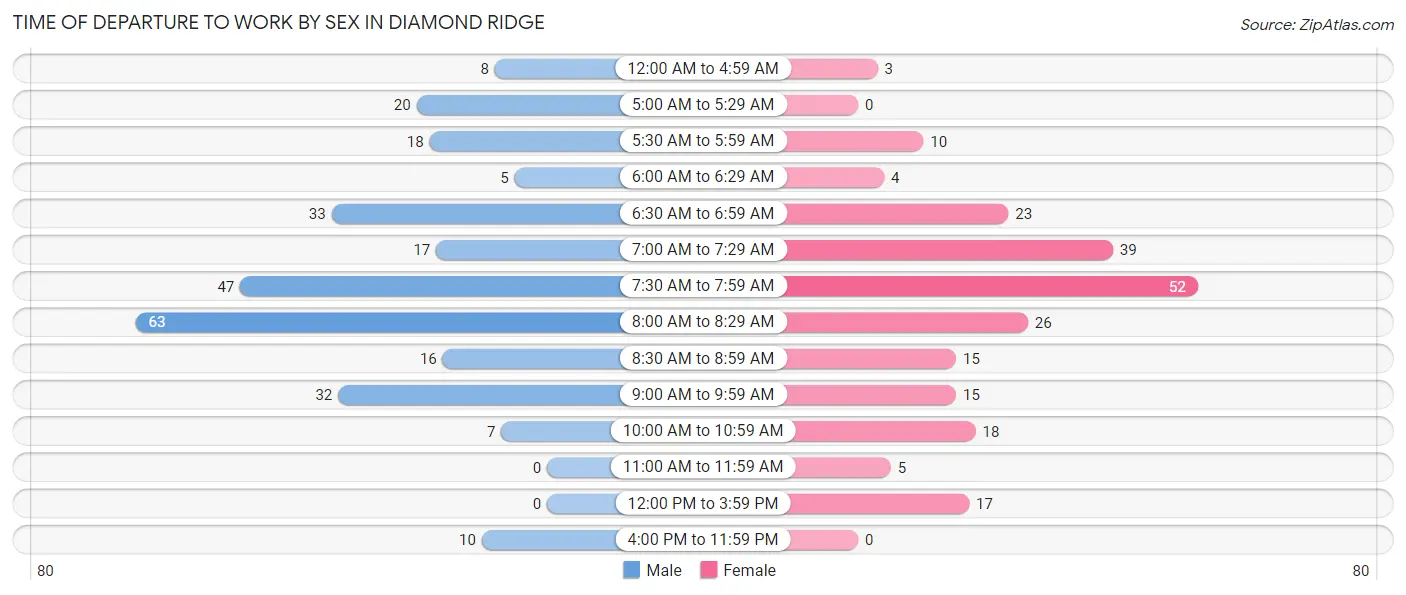
| Time of Departure | Male | Female |
| 12:00 AM to 4:59 AM | 8 (2.9%) | 3 (1.3%) |
| 5:00 AM to 5:29 AM | 20 (7.2%) | 0 (0.0%) |
| 5:30 AM to 5:59 AM | 18 (6.5%) | 10 (4.4%) |
| 6:00 AM to 6:29 AM | 5 (1.8%) | 4 (1.8%) |
| 6:30 AM to 6:59 AM | 33 (12.0%) | 23 (10.1%) |
| 7:00 AM to 7:29 AM | 17 (6.2%) | 39 (17.2%) |
| 7:30 AM to 7:59 AM | 47 (17.0%) | 52 (22.9%) |
| 8:00 AM to 8:29 AM | 63 (22.8%) | 26 (11.5%) |
| 8:30 AM to 8:59 AM | 16 (5.8%) | 15 (6.6%) |
| 9:00 AM to 9:59 AM | 32 (11.6%) | 15 (6.6%) |
| 10:00 AM to 10:59 AM | 7 (2.5%) | 18 (7.9%) |
| 11:00 AM to 11:59 AM | 0 (0.0%) | 5 (2.2%) |
| 12:00 PM to 3:59 PM | 0 (0.0%) | 17 (7.5%) |
| 4:00 PM to 11:59 PM | 10 (3.6%) | 0 (0.0%) |
| Total | 276 (100.0%) | 227 (100.0%) |
Housing Occupancy in Diamond Ridge
Occupancy by Ownership in Diamond Ridge
Of the total 524 dwellings in Diamond Ridge, owner-occupied units account for 482 (92.0%), while renter-occupied units make up 42 (8.0%).
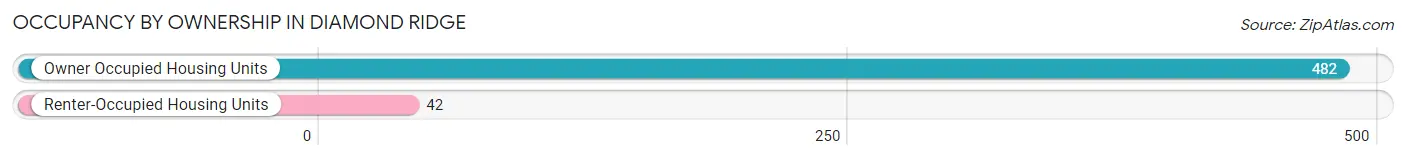
| Occupancy | # Housing Units | % Housing Units |
| Owner Occupied Housing Units | 482 | 92.0% |
| Renter-Occupied Housing Units | 42 | 8.0% |
| Total Occupied Housing Units | 524 | 100.0% |
Occupancy by Household Size in Diamond Ridge
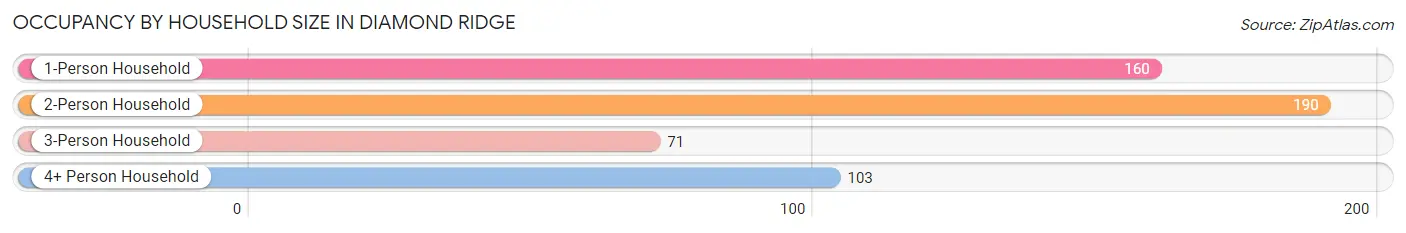
| Household Size | # Housing Units | % Housing Units |
| 1-Person Household | 160 | 30.5% |
| 2-Person Household | 190 | 36.3% |
| 3-Person Household | 71 | 13.6% |
| 4+ Person Household | 103 | 19.7% |
| Total Housing Units | 524 | 100.0% |
Occupancy by Ownership by Household Size in Diamond Ridge
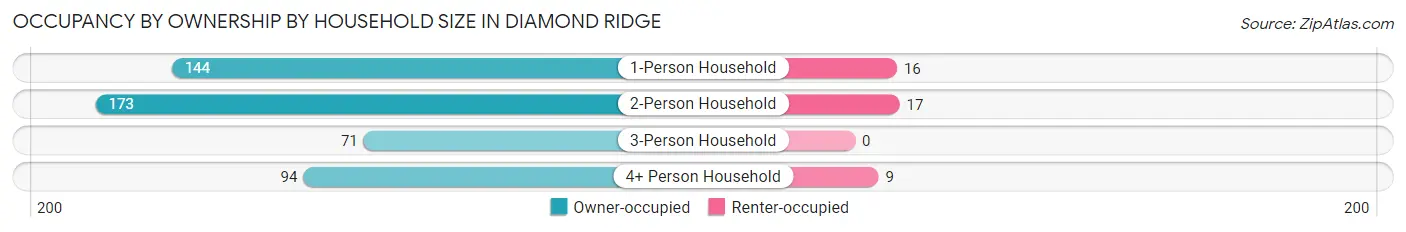
| Household Size | Owner-occupied | Renter-occupied |
| 1-Person Household | 144 (90.0%) | 16 (10.0%) |
| 2-Person Household | 173 (91.0%) | 17 (8.9%) |
| 3-Person Household | 71 (100.0%) | 0 (0.0%) |
| 4+ Person Household | 94 (91.3%) | 9 (8.7%) |
| Total Housing Units | 482 (92.0%) | 42 (8.0%) |
Occupancy by Educational Attainment in Diamond Ridge
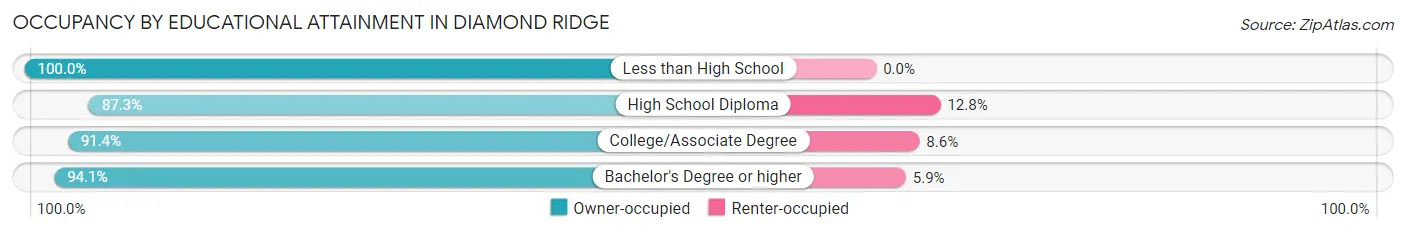
| Household Size | Owner-occupied | Renter-occupied |
| Less than High School | 9 (100.0%) | 0 (0.0%) |
| High School Diploma | 89 (87.3%) | 13 (12.8%) |
| College/Associate Degree | 160 (91.4%) | 15 (8.6%) |
| Bachelor's Degree or higher | 224 (94.1%) | 14 (5.9%) |
Occupancy by Age of Householder in Diamond Ridge
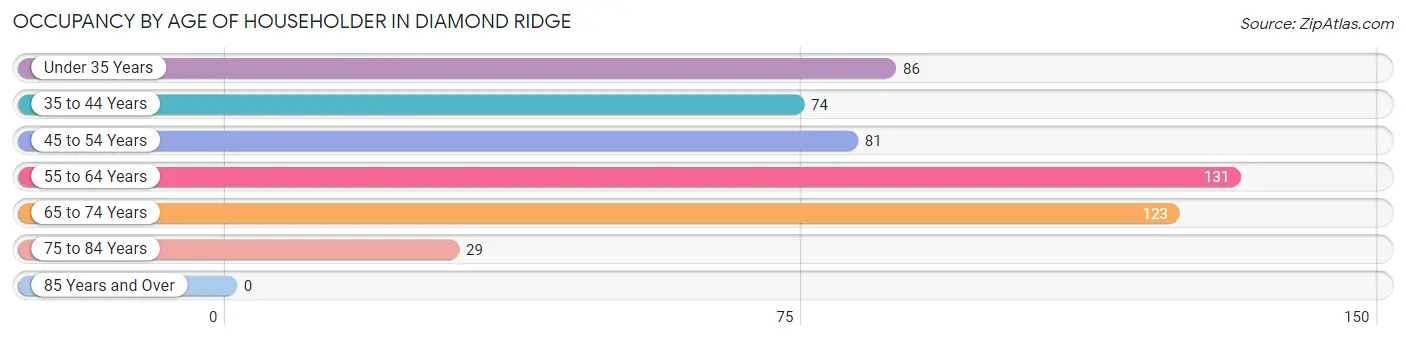
| Age Bracket | # Households | % Households |
| Under 35 Years | 86 | 16.4% |
| 35 to 44 Years | 74 | 14.1% |
| 45 to 54 Years | 81 | 15.5% |
| 55 to 64 Years | 131 | 25.0% |
| 65 to 74 Years | 123 | 23.5% |
| 75 to 84 Years | 29 | 5.5% |
| 85 Years and Over | 0 | 0.0% |
| Total | 524 | 100.0% |
Housing Finances in Diamond Ridge
Median Income by Occupancy in Diamond Ridge
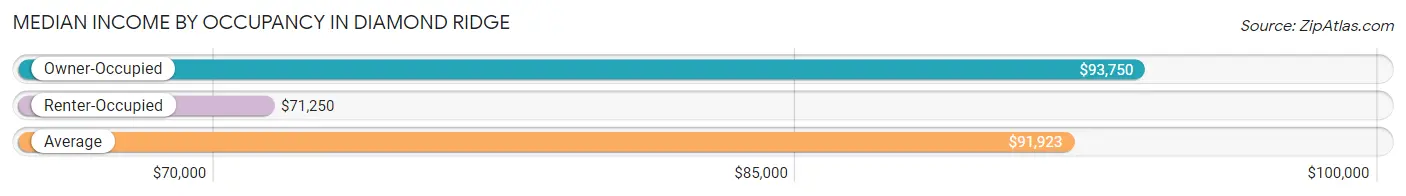
| Occupancy Type | # Households | Median Income |
| Owner-Occupied | 482 (92.0%) | $93,750 |
| Renter-Occupied | 42 (8.0%) | $71,250 |
| Average | 524 (100.0%) | $91,923 |
Occupancy by Householder Income Bracket in Diamond Ridge
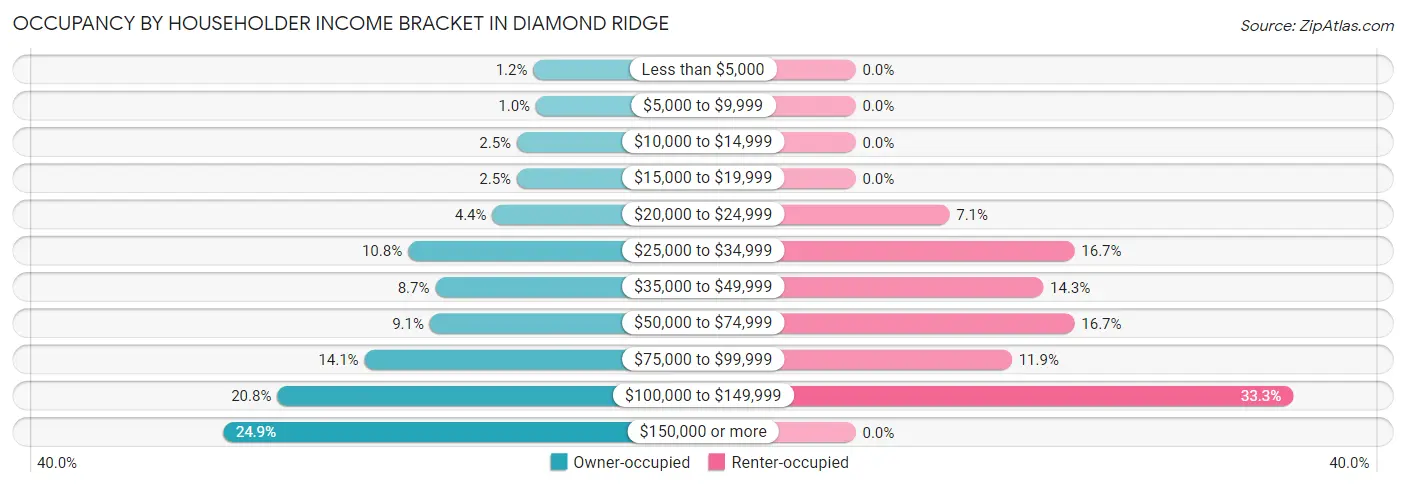
| Income Bracket | Owner-occupied | Renter-occupied |
| Less than $5,000 | 6 (1.2%) | 0 (0.0%) |
| $5,000 to $9,999 | 5 (1.0%) | 0 (0.0%) |
| $10,000 to $14,999 | 12 (2.5%) | 0 (0.0%) |
| $15,000 to $19,999 | 12 (2.5%) | 0 (0.0%) |
| $20,000 to $24,999 | 21 (4.4%) | 3 (7.1%) |
| $25,000 to $34,999 | 52 (10.8%) | 7 (16.7%) |
| $35,000 to $49,999 | 42 (8.7%) | 6 (14.3%) |
| $50,000 to $74,999 | 44 (9.1%) | 7 (16.7%) |
| $75,000 to $99,999 | 68 (14.1%) | 5 (11.9%) |
| $100,000 to $149,999 | 100 (20.7%) | 14 (33.3%) |
| $150,000 or more | 120 (24.9%) | 0 (0.0%) |
| Total | 482 (100.0%) | 42 (100.0%) |
Monthly Housing Cost Tiers in Diamond Ridge
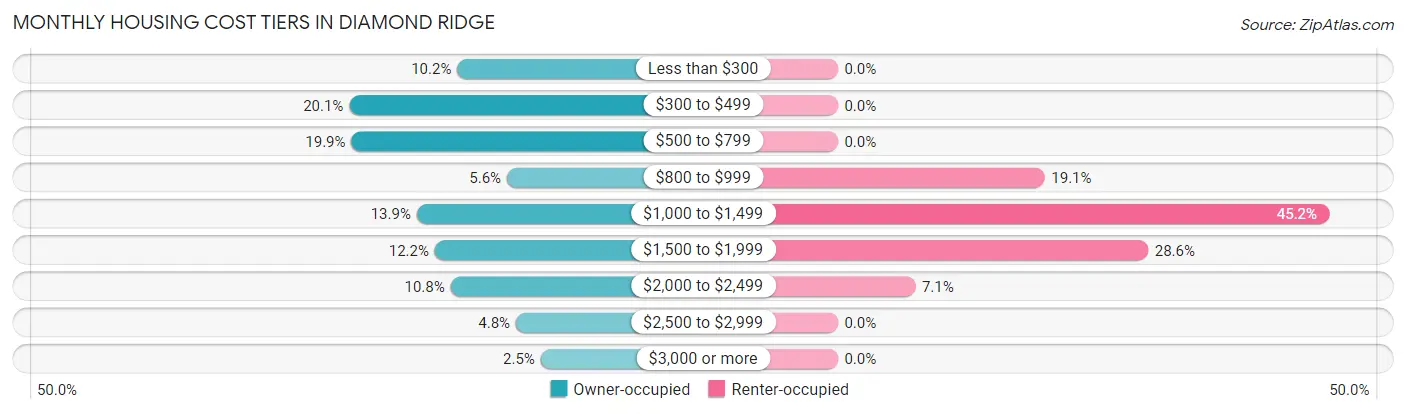
| Monthly Cost | Owner-occupied | Renter-occupied |
| Less than $300 | 49 (10.2%) | 0 (0.0%) |
| $300 to $499 | 97 (20.1%) | 0 (0.0%) |
| $500 to $799 | 96 (19.9%) | 0 (0.0%) |
| $800 to $999 | 27 (5.6%) | 8 (19.1%) |
| $1,000 to $1,499 | 67 (13.9%) | 19 (45.2%) |
| $1,500 to $1,999 | 59 (12.2%) | 12 (28.6%) |
| $2,000 to $2,499 | 52 (10.8%) | 3 (7.1%) |
| $2,500 to $2,999 | 23 (4.8%) | 0 (0.0%) |
| $3,000 or more | 12 (2.5%) | 0 (0.0%) |
| Total | 482 (100.0%) | 42 (100.0%) |
Physical Housing Characteristics in Diamond Ridge
Housing Structures in Diamond Ridge
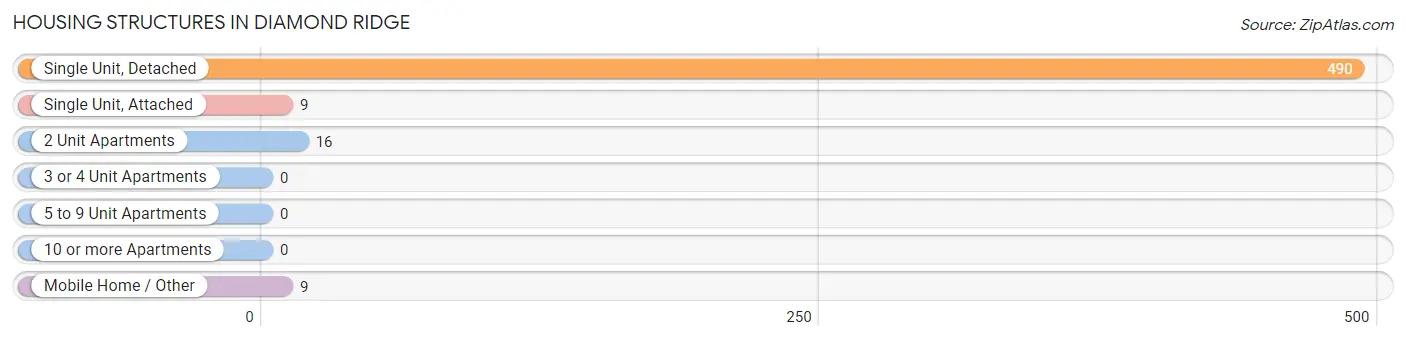
| Structure Type | # Housing Units | % Housing Units |
| Single Unit, Detached | 490 | 93.5% |
| Single Unit, Attached | 9 | 1.7% |
| 2 Unit Apartments | 16 | 3.0% |
| 3 or 4 Unit Apartments | 0 | 0.0% |
| 5 to 9 Unit Apartments | 0 | 0.0% |
| 10 or more Apartments | 0 | 0.0% |
| Mobile Home / Other | 9 | 1.7% |
| Total | 524 | 100.0% |
Housing Structures by Occupancy in Diamond Ridge
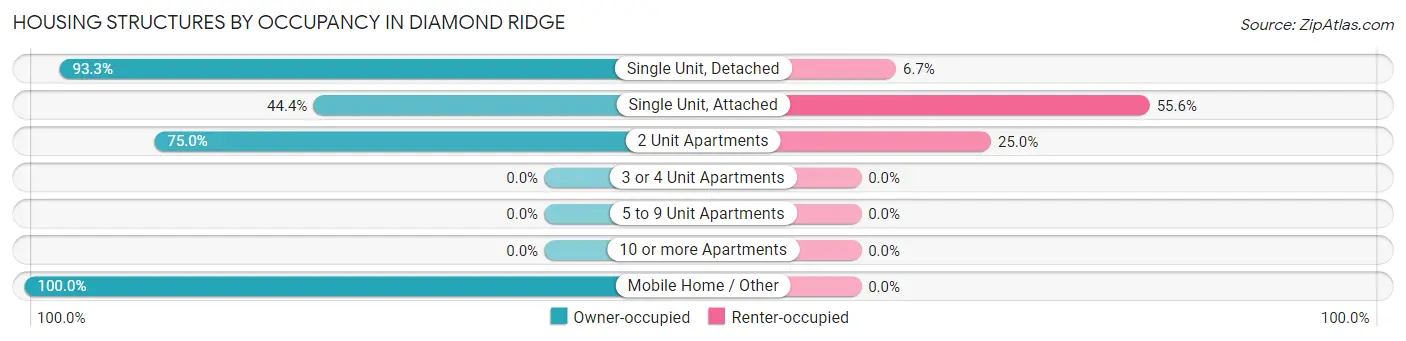
| Structure Type | Owner-occupied | Renter-occupied |
| Single Unit, Detached | 457 (93.3%) | 33 (6.7%) |
| Single Unit, Attached | 4 (44.4%) | 5 (55.6%) |
| 2 Unit Apartments | 12 (75.0%) | 4 (25.0%) |
| 3 or 4 Unit Apartments | 0 (0.0%) | 0 (0.0%) |
| 5 to 9 Unit Apartments | 0 (0.0%) | 0 (0.0%) |
| 10 or more Apartments | 0 (0.0%) | 0 (0.0%) |
| Mobile Home / Other | 9 (100.0%) | 0 (0.0%) |
| Total | 482 (92.0%) | 42 (8.0%) |
Housing Structures by Number of Rooms in Diamond Ridge
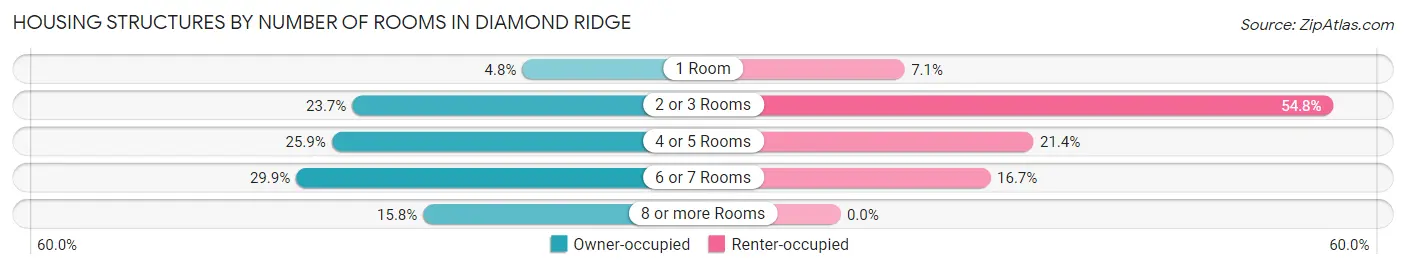
| Number of Rooms | Owner-occupied | Renter-occupied |
| 1 Room | 23 (4.8%) | 3 (7.1%) |
| 2 or 3 Rooms | 114 (23.6%) | 23 (54.8%) |
| 4 or 5 Rooms | 125 (25.9%) | 9 (21.4%) |
| 6 or 7 Rooms | 144 (29.9%) | 7 (16.7%) |
| 8 or more Rooms | 76 (15.8%) | 0 (0.0%) |
| Total | 482 (100.0%) | 42 (100.0%) |
Housing Structure by Heating Type in Diamond Ridge
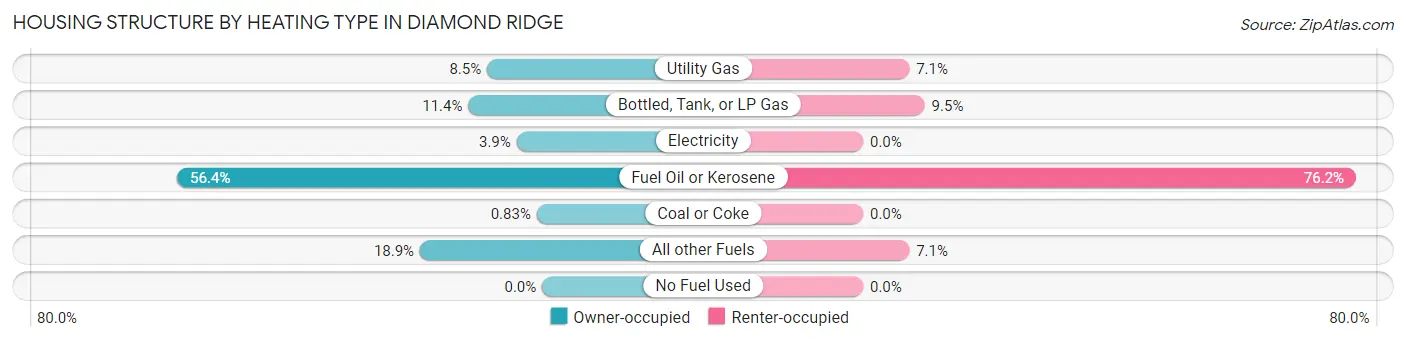
| Heating Type | Owner-occupied | Renter-occupied |
| Utility Gas | 41 (8.5%) | 3 (7.1%) |
| Bottled, Tank, or LP Gas | 55 (11.4%) | 4 (9.5%) |
| Electricity | 19 (3.9%) | 0 (0.0%) |
| Fuel Oil or Kerosene | 272 (56.4%) | 32 (76.2%) |
| Coal or Coke | 4 (0.8%) | 0 (0.0%) |
| All other Fuels | 91 (18.9%) | 3 (7.1%) |
| No Fuel Used | 0 (0.0%) | 0 (0.0%) |
| Total | 482 (100.0%) | 42 (100.0%) |
Household Vehicle Usage in Diamond Ridge
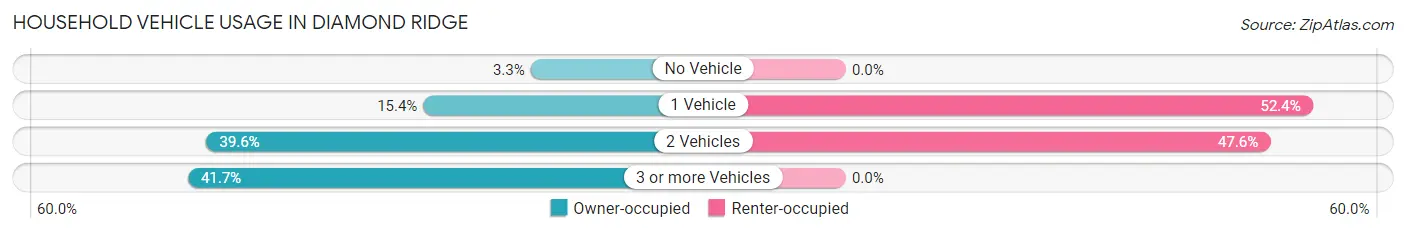
| Vehicles per Household | Owner-occupied | Renter-occupied |
| No Vehicle | 16 (3.3%) | 0 (0.0%) |
| 1 Vehicle | 74 (15.3%) | 22 (52.4%) |
| 2 Vehicles | 191 (39.6%) | 20 (47.6%) |
| 3 or more Vehicles | 201 (41.7%) | 0 (0.0%) |
| Total | 482 (100.0%) | 42 (100.0%) |
Real Estate & Mortgages in Diamond Ridge
Real Estate and Mortgage Overview in Diamond Ridge
| Characteristic | Without Mortgage | With Mortgage |
| Housing Units | 268 | 214 |
| Median Property Value | $258,300 | $330,600 |
| Median Household Income | $88,750 | $52 |
| Monthly Housing Costs | $486 | $12 |
| Real Estate Taxes | $2,170 | $18 |
Property Value by Mortgage Status in Diamond Ridge
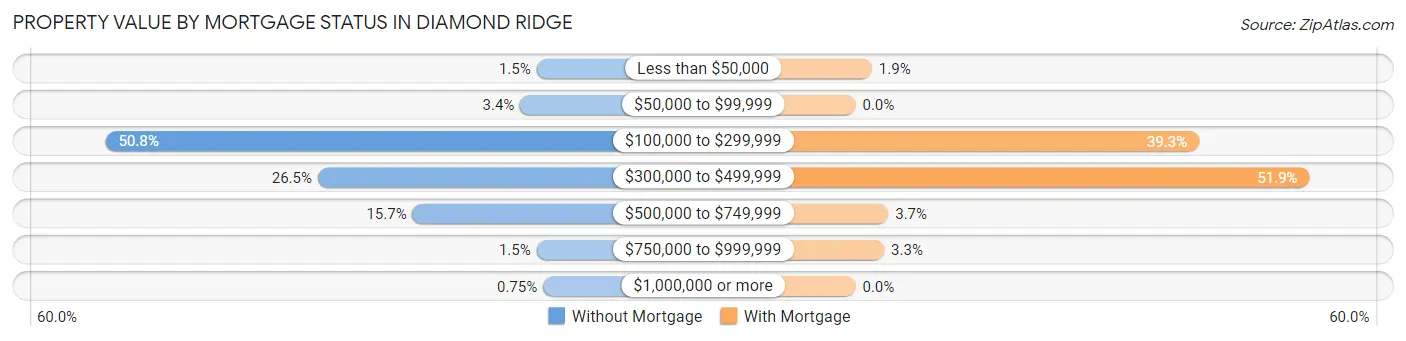
| Property Value | Without Mortgage | With Mortgage |
| Less than $50,000 | 4 (1.5%) | 4 (1.9%) |
| $50,000 to $99,999 | 9 (3.4%) | 0 (0.0%) |
| $100,000 to $299,999 | 136 (50.7%) | 84 (39.3%) |
| $300,000 to $499,999 | 71 (26.5%) | 111 (51.9%) |
| $500,000 to $749,999 | 42 (15.7%) | 8 (3.7%) |
| $750,000 to $999,999 | 4 (1.5%) | 7 (3.3%) |
| $1,000,000 or more | 2 (0.7%) | 0 (0.0%) |
| Total | 268 (100.0%) | 214 (100.0%) |
Household Income by Mortgage Status in Diamond Ridge
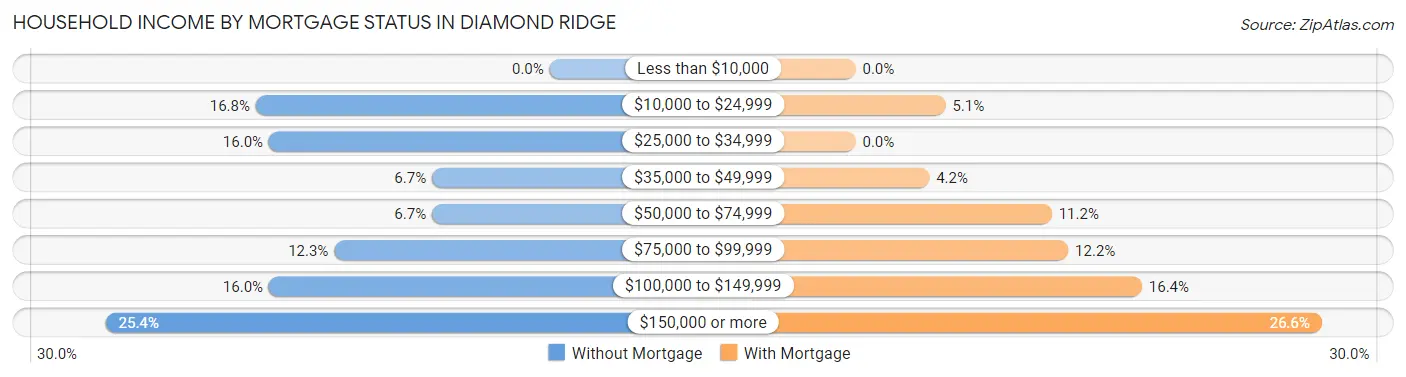
| Household Income | Without Mortgage | With Mortgage |
| Less than $10,000 | 0 (0.0%) | 0 (0.0%) |
| $10,000 to $24,999 | 45 (16.8%) | 11 (5.1%) |
| $25,000 to $34,999 | 43 (16.0%) | 0 (0.0%) |
| $35,000 to $49,999 | 18 (6.7%) | 9 (4.2%) |
| $50,000 to $74,999 | 18 (6.7%) | 24 (11.2%) |
| $75,000 to $99,999 | 33 (12.3%) | 26 (12.1%) |
| $100,000 to $149,999 | 43 (16.0%) | 35 (16.4%) |
| $150,000 or more | 68 (25.4%) | 57 (26.6%) |
| Total | 268 (100.0%) | 214 (100.0%) |
Property Value to Household Income Ratio in Diamond Ridge
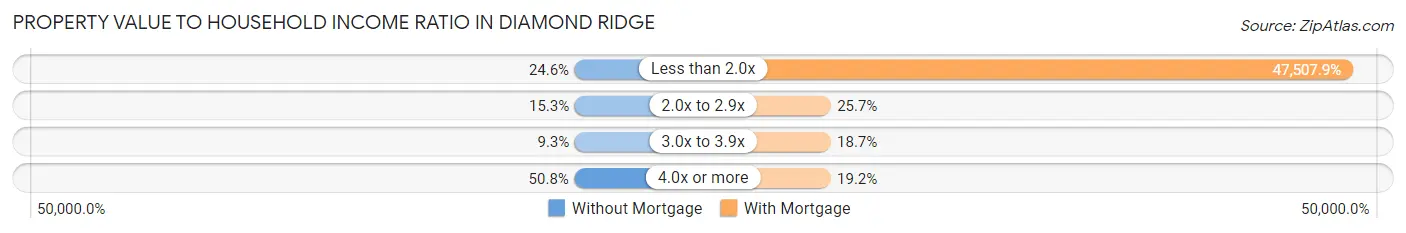
| Value-to-Income Ratio | Without Mortgage | With Mortgage |
| Less than 2.0x | 66 (24.6%) | 101,667 (47,507.9%) |
| 2.0x to 2.9x | 41 (15.3%) | 55 (25.7%) |
| 3.0x to 3.9x | 25 (9.3%) | 40 (18.7%) |
| 4.0x or more | 136 (50.7%) | 41 (19.2%) |
| Total | 268 (100.0%) | 214 (100.0%) |
Real Estate Taxes by Mortgage Status in Diamond Ridge
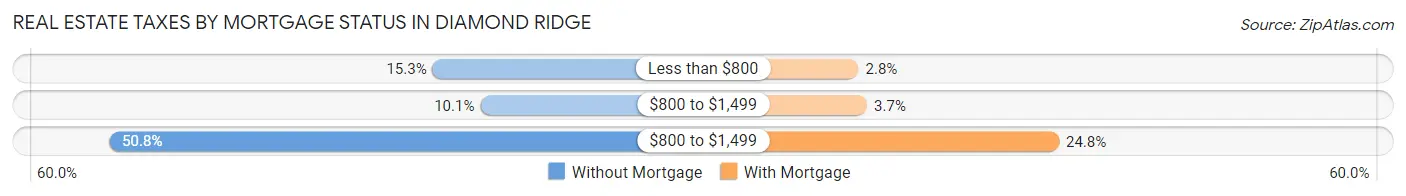
| Property Taxes | Without Mortgage | With Mortgage |
| Less than $800 | 41 (15.3%) | 6 (2.8%) |
| $800 to $1,499 | 27 (10.1%) | 8 (3.7%) |
| $800 to $1,499 | 136 (50.7%) | 53 (24.8%) |
| Total | 268 (100.0%) | 214 (100.0%) |
Health & Disability in Diamond Ridge
Health Insurance Coverage by Age in Diamond Ridge
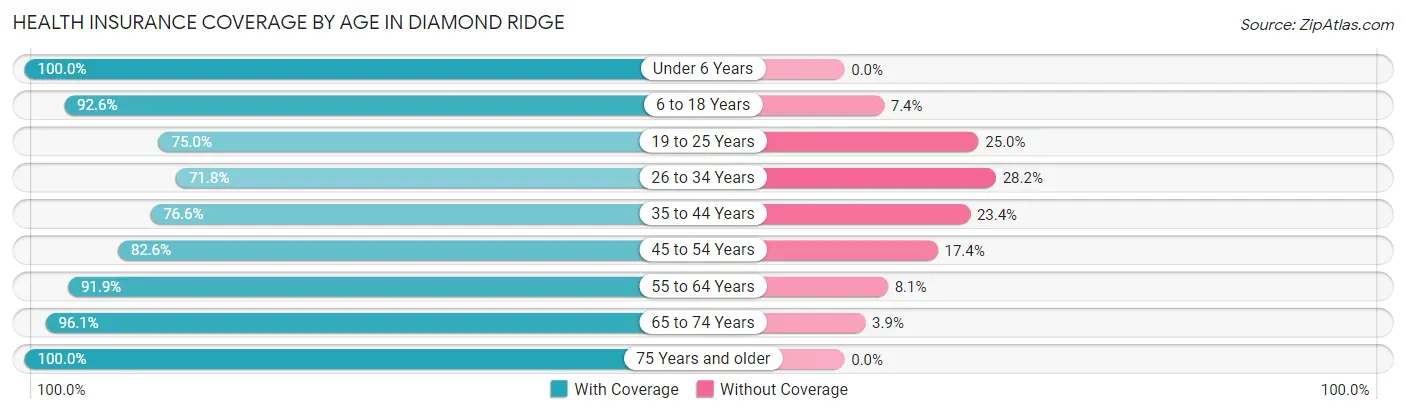
| Age Bracket | With Coverage | Without Coverage |
| Under 6 Years | 108 (100.0%) | 0 (0.0%) |
| 6 to 18 Years | 239 (92.6%) | 19 (7.4%) |
| 19 to 25 Years | 69 (75.0%) | 23 (25.0%) |
| 26 to 34 Years | 122 (71.8%) | 48 (28.2%) |
| 35 to 44 Years | 134 (76.6%) | 41 (23.4%) |
| 45 to 54 Years | 114 (82.6%) | 24 (17.4%) |
| 55 to 64 Years | 216 (91.9%) | 19 (8.1%) |
| 65 to 74 Years | 173 (96.1%) | 7 (3.9%) |
| 75 Years and older | 41 (100.0%) | 0 (0.0%) |
| Total | 1,216 (87.0%) | 181 (13.0%) |
Health Insurance Coverage by Citizenship Status in Diamond Ridge
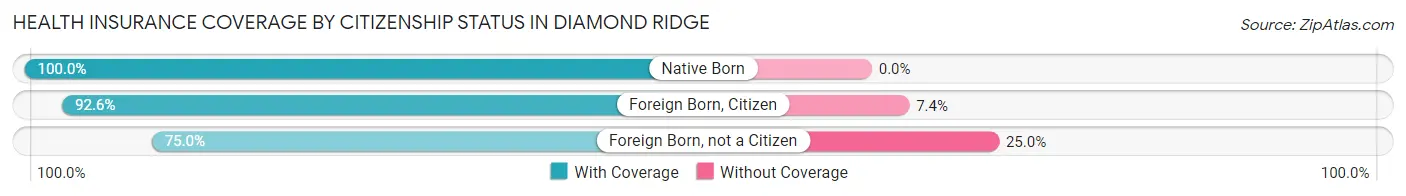
| Citizenship Status | With Coverage | Without Coverage |
| Native Born | 108 (100.0%) | 0 (0.0%) |
| Foreign Born, Citizen | 239 (92.6%) | 19 (7.4%) |
| Foreign Born, not a Citizen | 69 (75.0%) | 23 (25.0%) |
Health Insurance Coverage by Household Income in Diamond Ridge
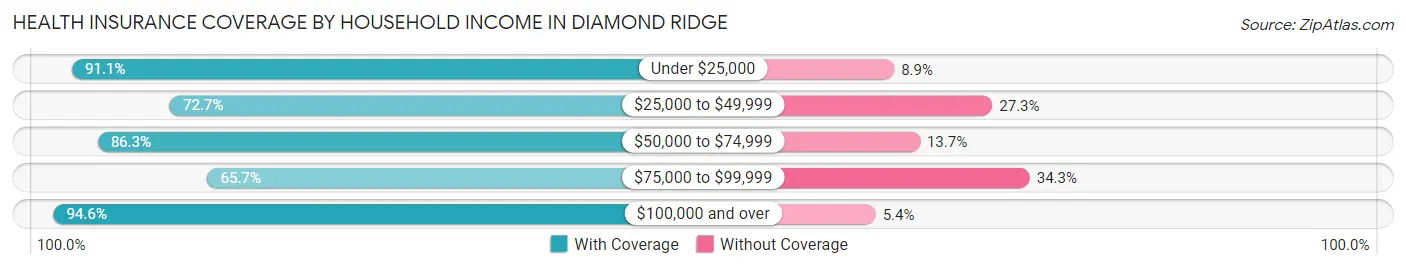
| Household Income | With Coverage | Without Coverage |
| Under $25,000 | 82 (91.1%) | 8 (8.9%) |
| $25,000 to $49,999 | 104 (72.7%) | 39 (27.3%) |
| $50,000 to $74,999 | 107 (86.3%) | 17 (13.7%) |
| $75,000 to $99,999 | 138 (65.7%) | 72 (34.3%) |
| $100,000 and over | 785 (94.6%) | 45 (5.4%) |
Public vs Private Health Insurance Coverage by Age in Diamond Ridge
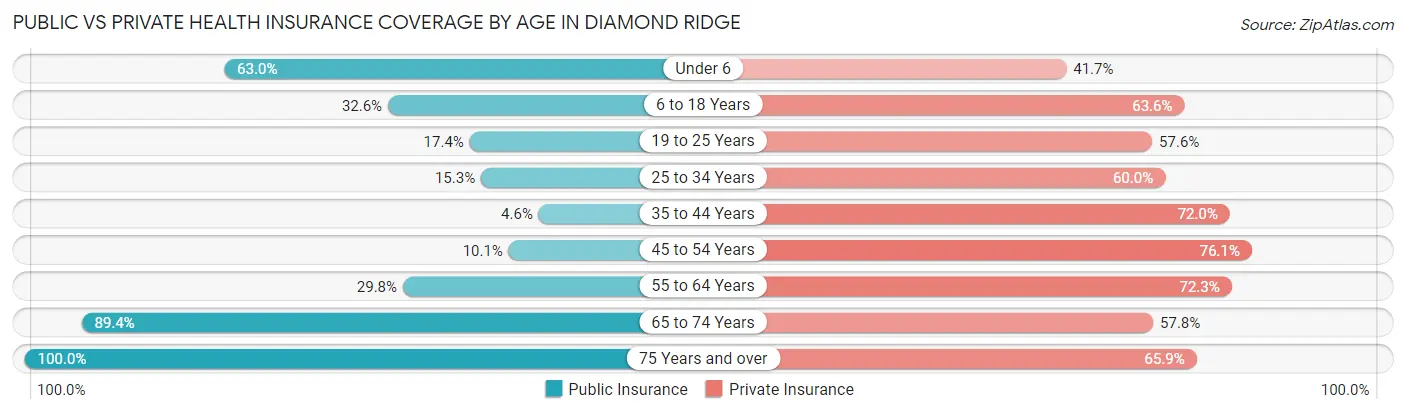
| Age Bracket | Public Insurance | Private Insurance |
| Under 6 | 68 (63.0%) | 45 (41.7%) |
| 6 to 18 Years | 84 (32.6%) | 164 (63.6%) |
| 19 to 25 Years | 16 (17.4%) | 53 (57.6%) |
| 25 to 34 Years | 26 (15.3%) | 102 (60.0%) |
| 35 to 44 Years | 8 (4.6%) | 126 (72.0%) |
| 45 to 54 Years | 14 (10.1%) | 105 (76.1%) |
| 55 to 64 Years | 70 (29.8%) | 170 (72.3%) |
| 65 to 74 Years | 161 (89.4%) | 104 (57.8%) |
| 75 Years and over | 41 (100.0%) | 27 (65.8%) |
| Total | 488 (34.9%) | 896 (64.1%) |
Disability Status by Sex by Age in Diamond Ridge
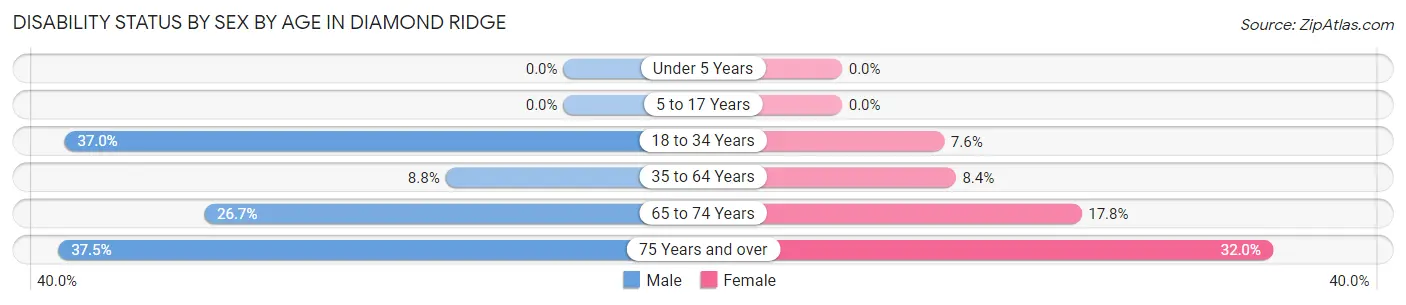
| Age Bracket | Male | Female |
| Under 5 Years | 0 (0.0%) | 0 (0.0%) |
| 5 to 17 Years | 0 (0.0%) | 0 (0.0%) |
| 18 to 34 Years | 50 (37.0%) | 10 (7.6%) |
| 35 to 64 Years | 21 (8.7%) | 26 (8.4%) |
| 65 to 74 Years | 24 (26.7%) | 16 (17.8%) |
| 75 Years and over | 6 (37.5%) | 8 (32.0%) |
Disability Class by Sex by Age in Diamond Ridge
Disability Class: Hearing Difficulty
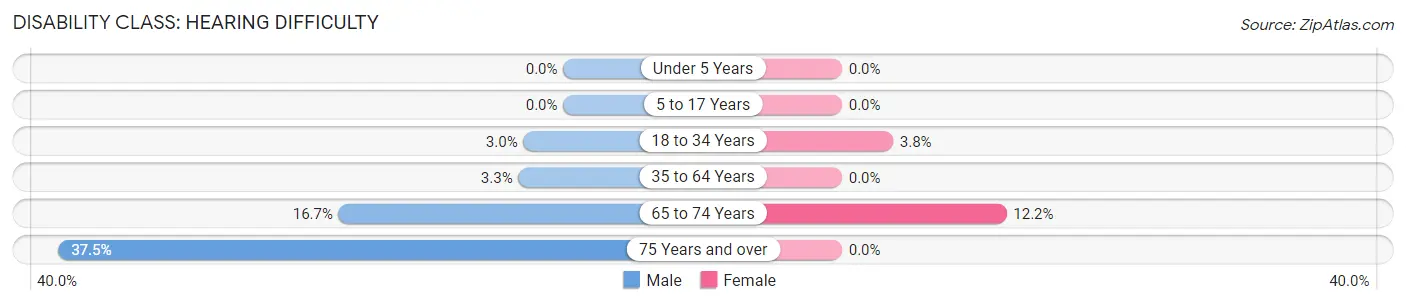
| Age Bracket | Male | Female |
| Under 5 Years | 0 (0.0%) | 0 (0.0%) |
| 5 to 17 Years | 0 (0.0%) | 0 (0.0%) |
| 18 to 34 Years | 4 (3.0%) | 5 (3.8%) |
| 35 to 64 Years | 8 (3.3%) | 0 (0.0%) |
| 65 to 74 Years | 15 (16.7%) | 11 (12.2%) |
| 75 Years and over | 6 (37.5%) | 0 (0.0%) |
Disability Class: Vision Difficulty
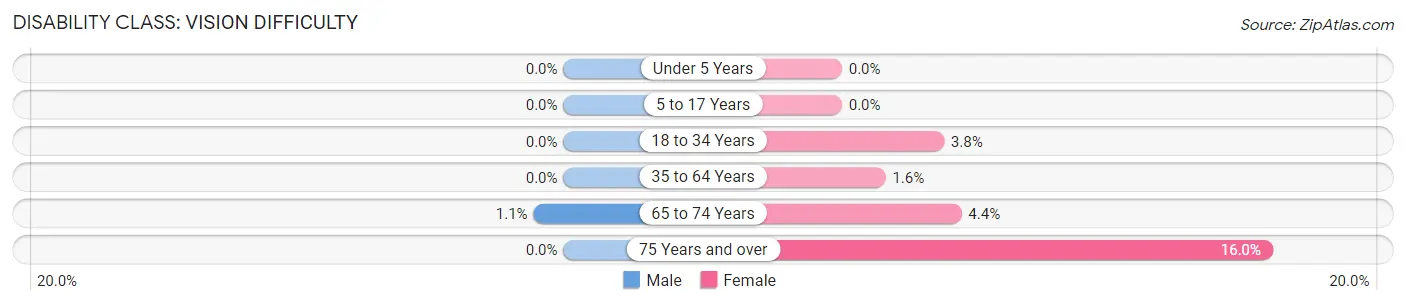
| Age Bracket | Male | Female |
| Under 5 Years | 0 (0.0%) | 0 (0.0%) |
| 5 to 17 Years | 0 (0.0%) | 0 (0.0%) |
| 18 to 34 Years | 0 (0.0%) | 5 (3.8%) |
| 35 to 64 Years | 0 (0.0%) | 5 (1.6%) |
| 65 to 74 Years | 1 (1.1%) | 4 (4.4%) |
| 75 Years and over | 0 (0.0%) | 4 (16.0%) |
Disability Class: Cognitive Difficulty
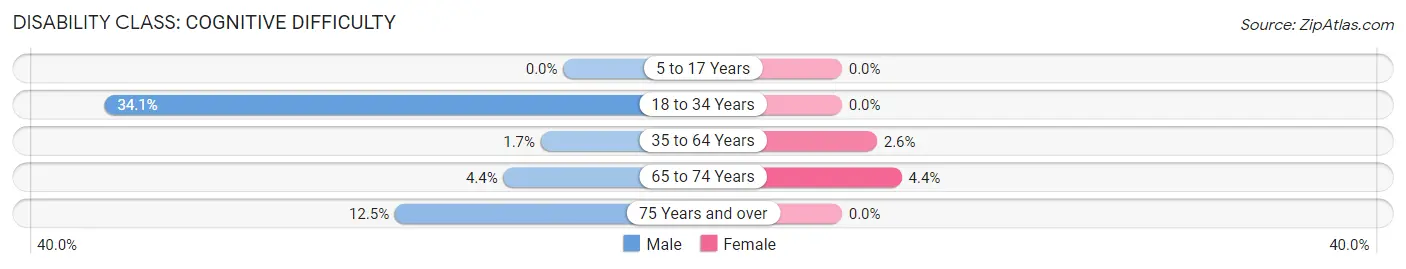
| Age Bracket | Male | Female |
| 5 to 17 Years | 0 (0.0%) | 0 (0.0%) |
| 18 to 34 Years | 46 (34.1%) | 0 (0.0%) |
| 35 to 64 Years | 4 (1.7%) | 8 (2.6%) |
| 65 to 74 Years | 4 (4.4%) | 4 (4.4%) |
| 75 Years and over | 2 (12.5%) | 0 (0.0%) |
Disability Class: Ambulatory Difficulty
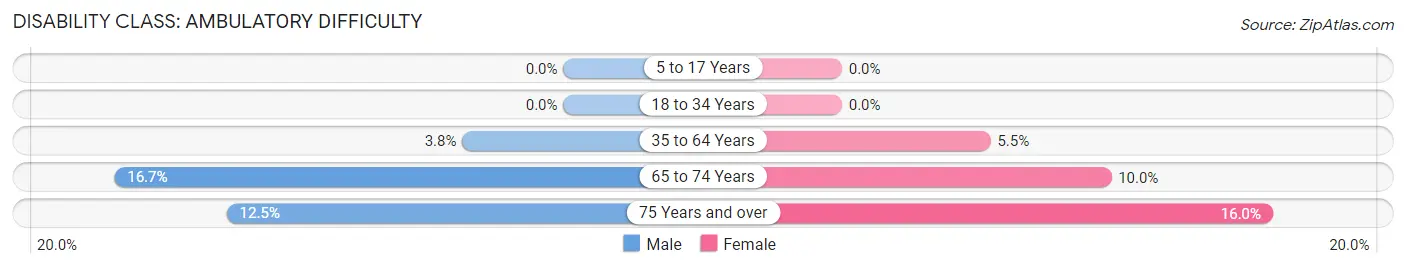
| Age Bracket | Male | Female |
| 5 to 17 Years | 0 (0.0%) | 0 (0.0%) |
| 18 to 34 Years | 0 (0.0%) | 0 (0.0%) |
| 35 to 64 Years | 9 (3.7%) | 17 (5.5%) |
| 65 to 74 Years | 15 (16.7%) | 9 (10.0%) |
| 75 Years and over | 2 (12.5%) | 4 (16.0%) |
Disability Class: Self-Care Difficulty
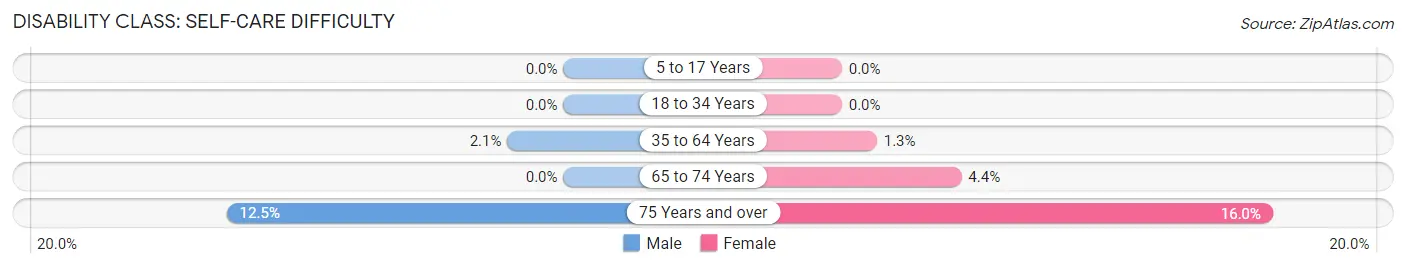
| Age Bracket | Male | Female |
| 5 to 17 Years | 0 (0.0%) | 0 (0.0%) |
| 18 to 34 Years | 0 (0.0%) | 0 (0.0%) |
| 35 to 64 Years | 5 (2.1%) | 4 (1.3%) |
| 65 to 74 Years | 0 (0.0%) | 4 (4.4%) |
| 75 Years and over | 2 (12.5%) | 4 (16.0%) |
Technology Access in Diamond Ridge
Computing Device Access in Diamond Ridge
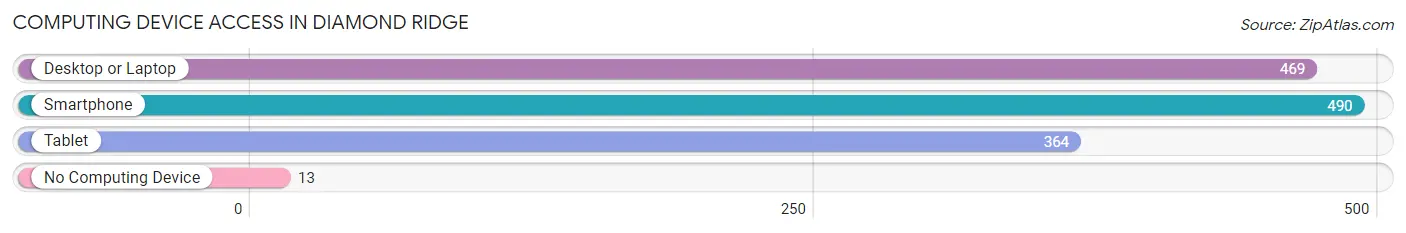
| Device Type | # Households | % Households |
| Desktop or Laptop | 469 | 89.5% |
| Smartphone | 490 | 93.5% |
| Tablet | 364 | 69.5% |
| No Computing Device | 13 | 2.5% |
| Total | 524 | 100.0% |
Internet Access in Diamond Ridge
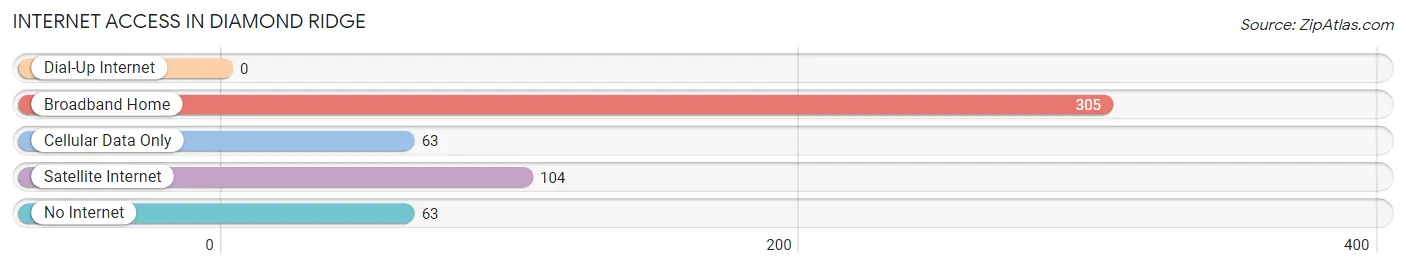
| Internet Type | # Households | % Households |
| Dial-Up Internet | 0 | 0.0% |
| Broadband Home | 305 | 58.2% |
| Cellular Data Only | 63 | 12.0% |
| Satellite Internet | 104 | 19.9% |
| No Internet | 63 | 12.0% |
| Total | 524 | 100.0% |
Diamond Ridge Summary
Ridge, Alaska is a small unincorporated community located in the Matanuska-Susitna Borough of Alaska. It is situated on the south side of the Susitna River, approximately 25 miles northeast of Anchorage. The community is located in the Chugach Mountains and is surrounded by the Chugach National Forest. The population of Diamond Ridge was estimated to be around 200 people in 2020.
History
Diamond Ridge was first settled in the late 1800s by miners who were searching for gold in the area. The miners named the area Diamond Ridge due to the abundance of quartz crystals found in the area. The miners built a small settlement and a post office was established in the area in 1902.
In the early 1900s, the area was used for logging and mining. The area was also used for recreational activities such as hunting and fishing. In the 1950s, the area was developed for residential use and the population began to grow.
Geography
Diamond Ridge is located in the Matanuska-Susitna Borough of Alaska. It is situated on the south side of the Susitna River, approximately 25 miles northeast of Anchorage. The community is located in the Chugach Mountains and is surrounded by the Chugach National Forest. The area is known for its scenic beauty and is a popular destination for outdoor activities such as hiking, camping, and fishing.
Economy
The economy of Diamond Ridge is largely based on tourism and recreation. The area is known for its scenic beauty and is a popular destination for outdoor activities such as hiking, camping, and fishing. The area is also home to several small businesses, including restaurants, lodging, and retail stores.
Demographics
The population of Diamond Ridge was estimated to be around 200 people in 2020. The racial makeup of the community is predominantly white, with a small percentage of Native American and Asian residents. The median household income in the area is around $50,000. The median age of residents is around 40 years old. The majority of residents are employed in the tourism and recreation industry.
Conclusion
Diamond Ridge, Alaska is a small unincorporated community located in the Matanuska-Susitna Borough of Alaska. It is situated on the south side of the Susitna River, approximately 25 miles northeast of Anchorage. The community is located in the Chugach Mountains and is surrounded by the Chugach National Forest. The area is known for its scenic beauty and is a popular destination for outdoor activities such as hiking, camping, and fishing. The economy of Diamond Ridge is largely based on tourism and recreation. The population of Diamond Ridge was estimated to be around 200 people in 2020. The racial makeup of the community is predominantly white, with a small percentage of Native American and Asian residents. The median household income in the area is around $50,000. The majority of residents are employed in the tourism and recreation industry.
Common Questions
What is Per Capita Income in Diamond Ridge?
Per Capita income in Diamond Ridge is $43,208.
What is the Median Family Income in Diamond Ridge?
Median Family Income in Diamond Ridge is $109,167.
What is the Median Household income in Diamond Ridge?
Median Household Income in Diamond Ridge is $91,923.
What is Income or Wage Gap in Diamond Ridge?
Income or Wage Gap in Diamond Ridge is 43.5%.
Women in Diamond Ridge earn 56.5 cents for every dollar earned by a man.
What is Inequality or Gini Index in Diamond Ridge?
Inequality or Gini Index in Diamond Ridge is 0.43.
What is the Total Population of Diamond Ridge?
Total Population of Diamond Ridge is 1,397.
What is the Total Male Population of Diamond Ridge?
Total Male Population of Diamond Ridge is 663.
What is the Total Female Population of Diamond Ridge?
Total Female Population of Diamond Ridge is 734.
What is the Ratio of Males per 100 Females in Diamond Ridge?
There are 90.33 Males per 100 Females in Diamond Ridge.
What is the Ratio of Females per 100 Males in Diamond Ridge?
There are 110.71 Females per 100 Males in Diamond Ridge.
What is the Median Population Age in Diamond Ridge?
Median Population Age in Diamond Ridge is 40.2 Years.
What is the Average Family Size in Diamond Ridge
Average Family Size in Diamond Ridge is 3.4 People.
What is the Average Household Size in Diamond Ridge
Average Household Size in Diamond Ridge is 2.7 People.
How Large is the Labor Force in Diamond Ridge?
There are 608 People in the Labor Forcein in Diamond Ridge.
What is the Percentage of People in the Labor Force in Diamond Ridge?
56.6% of People are in the Labor Force in Diamond Ridge.
What is the Unemployment Rate in Diamond Ridge?
Unemployment Rate in Diamond Ridge is 2.3%.