Wiota, WI Map & Demographics
Wiota Map
Wiota Overview
$35,112
PER CAPITA INCOME
$87,813
AVG FAMILY INCOME
$59,643
AVG HOUSEHOLD INCOME
26.1%
WAGE / INCOME GAP [ % ]
73.9¢/ $1
WAGE / INCOME GAP [ $ ]
0.36
INEQUALITY / GINI INDEX
83
TOTAL POPULATION
37
MALE POPULATION
46
FEMALE POPULATION
80.43
MALES / 100 FEMALES
124.32
FEMALES / 100 MALES
59.2
MEDIAN AGE
2.8
AVG FAMILY SIZE
2.3
AVG HOUSEHOLD SIZE
29
LABOR FORCE [ PEOPLE ]
40.3%
PERCENT IN LABOR FORCE
Income in Wiota
Income Overview in Wiota
Per Capita Income in Wiota is $35,112, while median incomes of families and households are $87,813 and $59,643 respectively.
| Characteristic | Number | Measure |
| Per Capita Income | 83 | $35,112 |
| Median Family Income | 25 | $87,813 |
| Mean Family Income | 25 | $73,296 |
| Median Household Income | 36 | $59,643 |
| Mean Household Income | 36 | $75,542 |
| Income Deficit | 25 | $0 |
| Wage / Income Gap (%) | 83 | 26.08% |
| Wage / Income Gap ($) | 83 | 73.92¢ per $1 |
| Gini / Inequality Index | 83 | 0.36 |
Earnings by Sex in Wiota
Average Earnings in Wiota are $59,286, $78,750 for men and $58,214 for women, a difference of 26.1%.
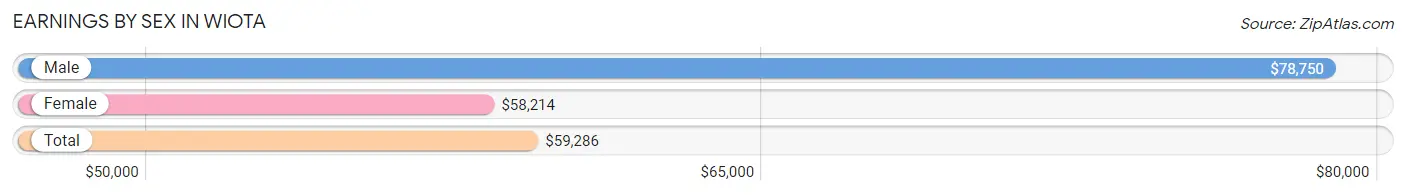
| Sex | Number | Average Earnings |
| Male | 16 (53.3%) | $78,750 |
| Female | 14 (46.7%) | $58,214 |
| Total | 30 (100.0%) | $59,286 |
Earnings by Sex by Income Bracket in Wiota
The most common earnings brackets in Wiota are $75,000 to $99,999 for men (9 | 56.2%) and $55,000 to $64,999 for women (9 | 64.3%).
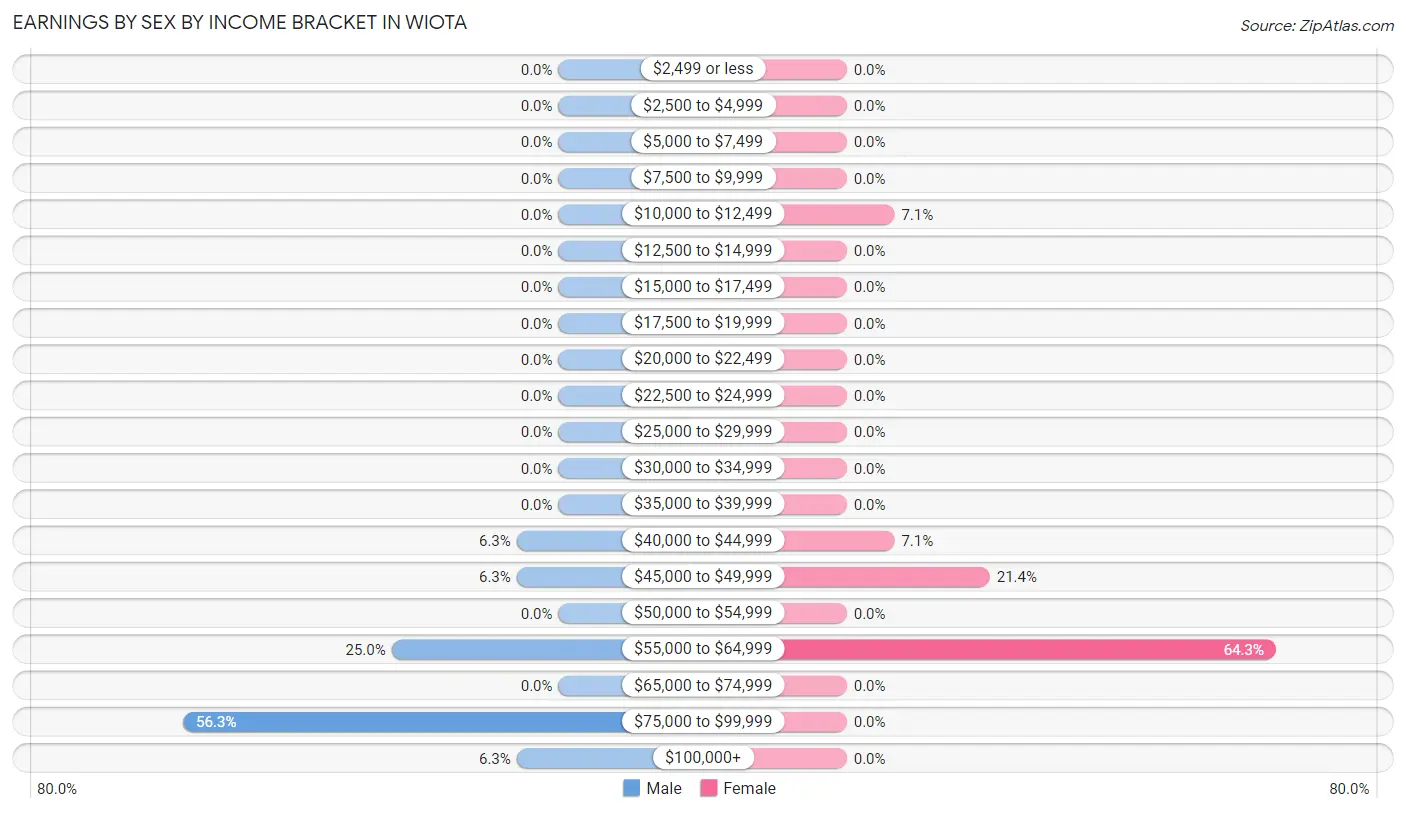
| Income | Male | Female |
| $2,499 or less | 0 (0.0%) | 0 (0.0%) |
| $2,500 to $4,999 | 0 (0.0%) | 0 (0.0%) |
| $5,000 to $7,499 | 0 (0.0%) | 0 (0.0%) |
| $7,500 to $9,999 | 0 (0.0%) | 0 (0.0%) |
| $10,000 to $12,499 | 0 (0.0%) | 1 (7.1%) |
| $12,500 to $14,999 | 0 (0.0%) | 0 (0.0%) |
| $15,000 to $17,499 | 0 (0.0%) | 0 (0.0%) |
| $17,500 to $19,999 | 0 (0.0%) | 0 (0.0%) |
| $20,000 to $22,499 | 0 (0.0%) | 0 (0.0%) |
| $22,500 to $24,999 | 0 (0.0%) | 0 (0.0%) |
| $25,000 to $29,999 | 0 (0.0%) | 0 (0.0%) |
| $30,000 to $34,999 | 0 (0.0%) | 0 (0.0%) |
| $35,000 to $39,999 | 0 (0.0%) | 0 (0.0%) |
| $40,000 to $44,999 | 1 (6.2%) | 1 (7.1%) |
| $45,000 to $49,999 | 1 (6.2%) | 3 (21.4%) |
| $50,000 to $54,999 | 0 (0.0%) | 0 (0.0%) |
| $55,000 to $64,999 | 4 (25.0%) | 9 (64.3%) |
| $65,000 to $74,999 | 0 (0.0%) | 0 (0.0%) |
| $75,000 to $99,999 | 9 (56.2%) | 0 (0.0%) |
| $100,000+ | 1 (6.2%) | 0 (0.0%) |
| Total | 16 (100.0%) | 14 (100.0%) |
Earnings by Sex by Educational Attainment in Wiota
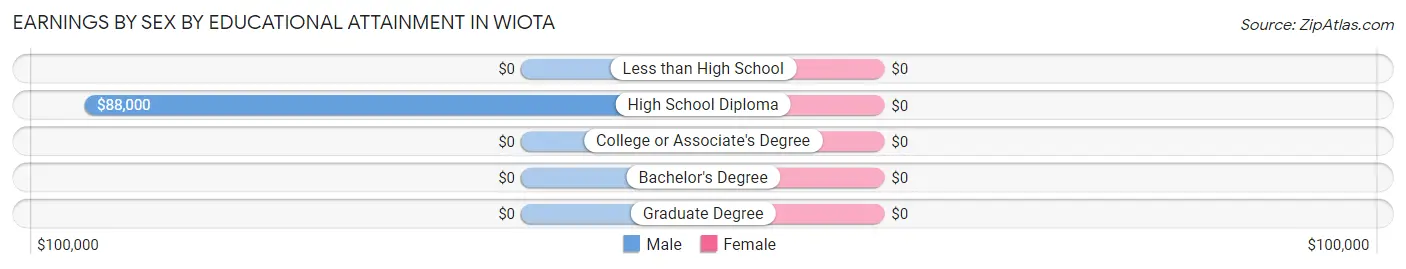
| Educational Attainment | Male Income | Female Income |
| Less than High School | - | - |
| High School Diploma | $88,000 | $0 |
| College or Associate's Degree | - | - |
| Bachelor's Degree | - | - |
| Graduate Degree | - | - |
| Total | $79,063 | $58,393 |
Family Income in Wiota
Family Income Brackets in Wiota
According to the Wiota family income data, there are 7 families falling into the $100,000 to $149,999 income range, which is the most common income bracket and makes up 28.0% of all families.
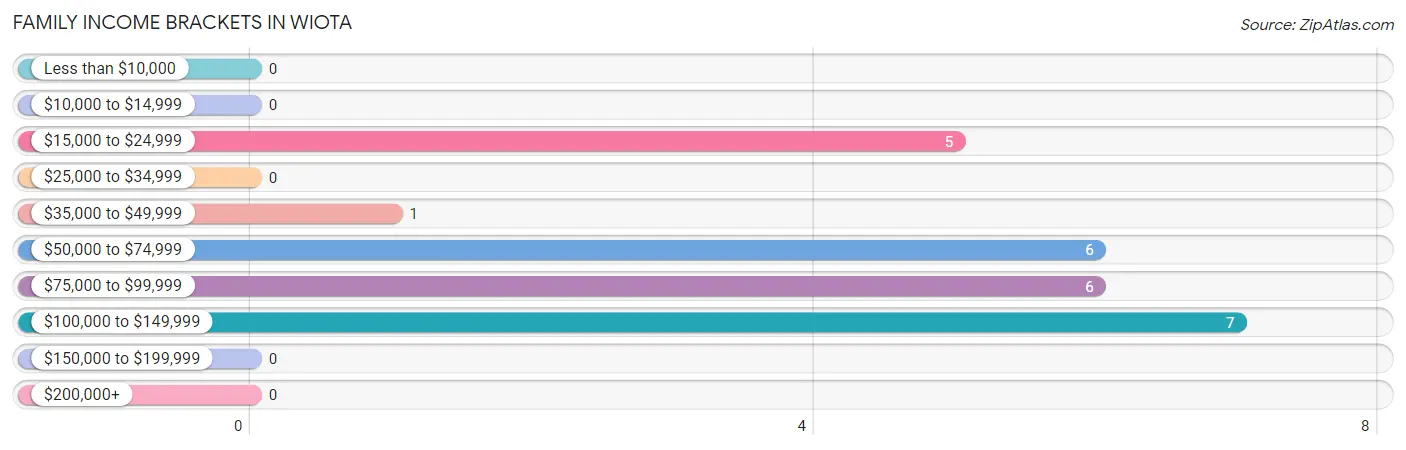
| Income Bracket | # Families | % Families |
| Less than $10,000 | 0 | 0.0% |
| $10,000 to $14,999 | 0 | 0.0% |
| $15,000 to $24,999 | 5 | 20.0% |
| $25,000 to $34,999 | 0 | 0.0% |
| $35,000 to $49,999 | 1 | 4.0% |
| $50,000 to $74,999 | 6 | 24.0% |
| $75,000 to $99,999 | 6 | 24.0% |
| $100,000 to $149,999 | 7 | 28.0% |
| $150,000 to $199,999 | 0 | 0.0% |
| $200,000+ | 0 | 0.0% |
Family Income by Famaliy Size in Wiota
2-person families (16 | 64.0%) account for the highest median family income in Wiota with $59,167 per family, while 2-person families (16 | 64.0%) have the highest median income of $29,584 per family member.
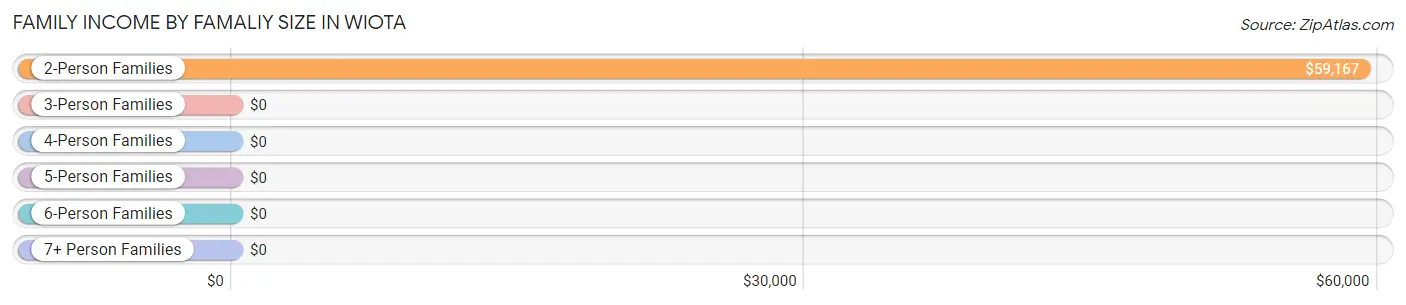
| Income Bracket | # Families | Median Income |
| 2-Person Families | 16 (64.0%) | $59,167 |
| 3-Person Families | 5 (20.0%) | $0 |
| 4-Person Families | 0 (0.0%) | $0 |
| 5-Person Families | 4 (16.0%) | $0 |
| 6-Person Families | 0 (0.0%) | $0 |
| 7+ Person Families | 0 (0.0%) | $0 |
| Total | 25 (100.0%) | $87,813 |
Family Income by Number of Earners in Wiota
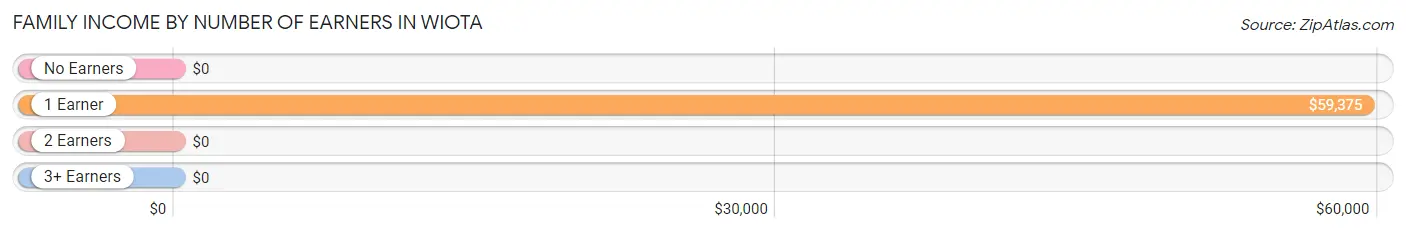
| Number of Earners | # Families | Median Income |
| No Earners | 10 (40.0%) | $0 |
| 1 Earner | 11 (44.0%) | $59,375 |
| 2 Earners | 4 (16.0%) | $0 |
| 3+ Earners | 0 (0.0%) | $0 |
| Total | 25 (100.0%) | $87,813 |
Household Income in Wiota
Household Income Brackets in Wiota
With 9 households falling in the category, the $50,000 to $74,999 income range is the most frequent in Wiota, accounting for 25.0% of all households.
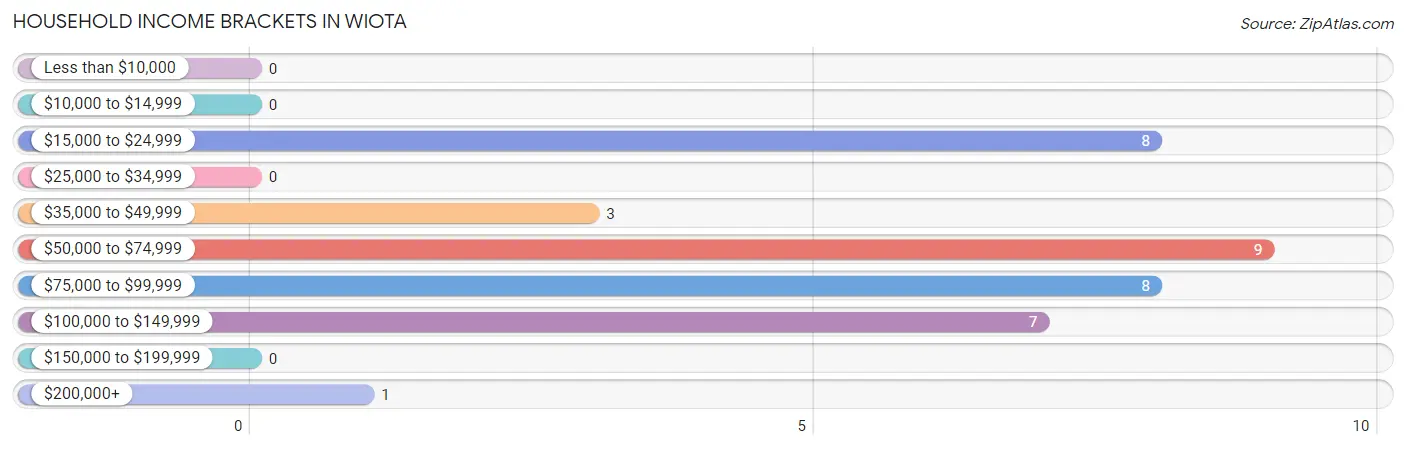
| Income Bracket | # Households | % Households |
| Less than $10,000 | 0 | 0.0% |
| $10,000 to $14,999 | 0 | 0.0% |
| $15,000 to $24,999 | 8 | 22.2% |
| $25,000 to $34,999 | 0 | 0.0% |
| $35,000 to $49,999 | 3 | 8.3% |
| $50,000 to $74,999 | 9 | 25.0% |
| $75,000 to $99,999 | 8 | 22.2% |
| $100,000 to $149,999 | 7 | 19.4% |
| $150,000 to $199,999 | 0 | 0.0% |
| $200,000+ | 1 | 2.8% |
Household Income by Householder Age in Wiota
The median household income in Wiota is $59,643, with the highest median household income of $93,750 found in the 45 to 64 years age bracket for the primary householder. A total of 14 households (38.9%) fall into this category. Meanwhile, the 15 to 24 years age bracket for the primary householder has the lowest median household income of $0, with 1 households (2.8%) in this group.
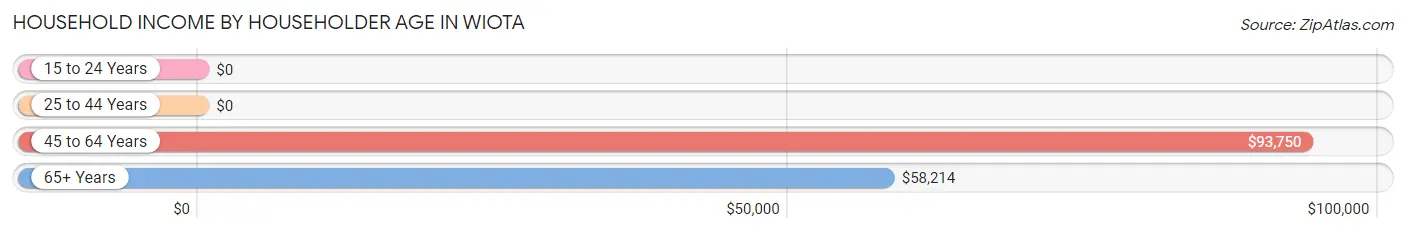
| Income Bracket | # Households | Median Income |
| 15 to 24 Years | 1 (2.8%) | $0 |
| 25 to 44 Years | 5 (13.9%) | $0 |
| 45 to 64 Years | 14 (38.9%) | $93,750 |
| 65+ Years | 16 (44.4%) | $58,214 |
| Total | 36 (100.0%) | $59,643 |
Poverty in Wiota
Income Below Poverty by Sex and Age in Wiota
With 5.4% poverty level for males and 10.9% for females among the residents of Wiota, 45 to 54 year old males and 18 to 24 year old females are the most vulnerable to poverty, with 2 males (33.3%) and 1 females (100.0%) in their respective age groups living below the poverty level.
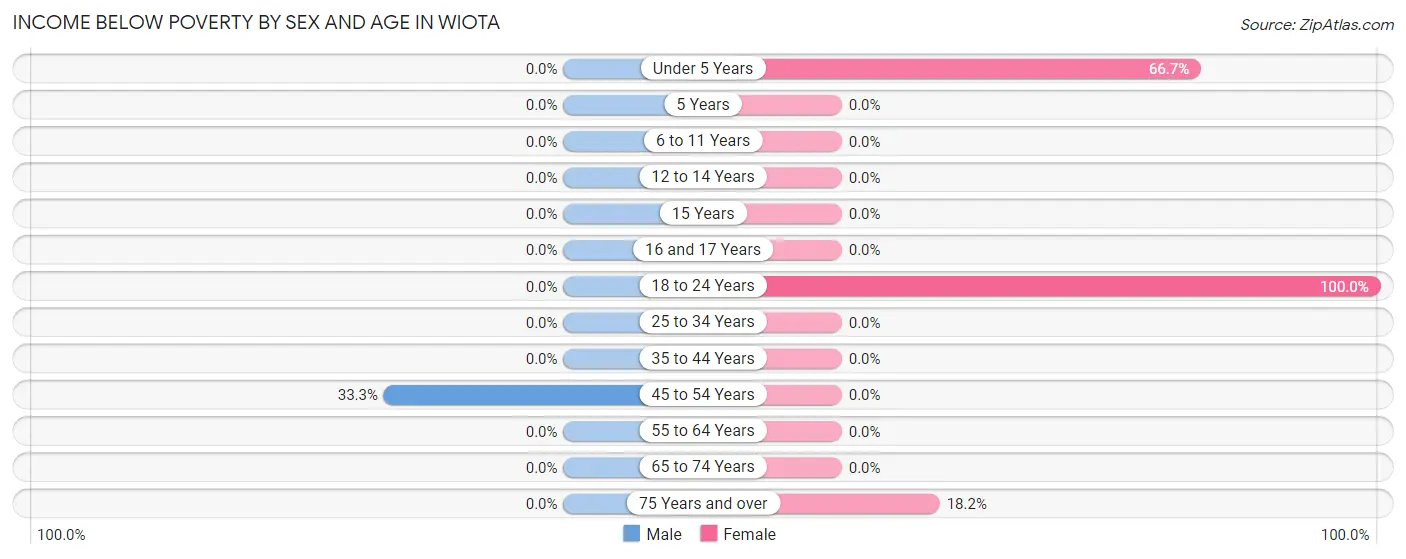
| Age Bracket | Male | Female |
| Under 5 Years | 0 (0.0%) | 2 (66.7%) |
| 5 Years | 0 (0.0%) | 0 (0.0%) |
| 6 to 11 Years | 0 (0.0%) | 0 (0.0%) |
| 12 to 14 Years | 0 (0.0%) | 0 (0.0%) |
| 15 Years | 0 (0.0%) | 0 (0.0%) |
| 16 and 17 Years | 0 (0.0%) | 0 (0.0%) |
| 18 to 24 Years | 0 (0.0%) | 1 (100.0%) |
| 25 to 34 Years | 0 (0.0%) | 0 (0.0%) |
| 35 to 44 Years | 0 (0.0%) | 0 (0.0%) |
| 45 to 54 Years | 2 (33.3%) | 0 (0.0%) |
| 55 to 64 Years | 0 (0.0%) | 0 (0.0%) |
| 65 to 74 Years | 0 (0.0%) | 0 (0.0%) |
| 75 Years and over | 0 (0.0%) | 2 (18.2%) |
| Total | 2 (5.4%) | 5 (10.9%) |
Income Above Poverty by Sex and Age in Wiota
According to the poverty statistics in Wiota, males aged 12 to 14 years and females aged 12 to 14 years are the age groups that are most secure financially, with 100.0% of males and 100.0% of females in these age groups living above the poverty line.
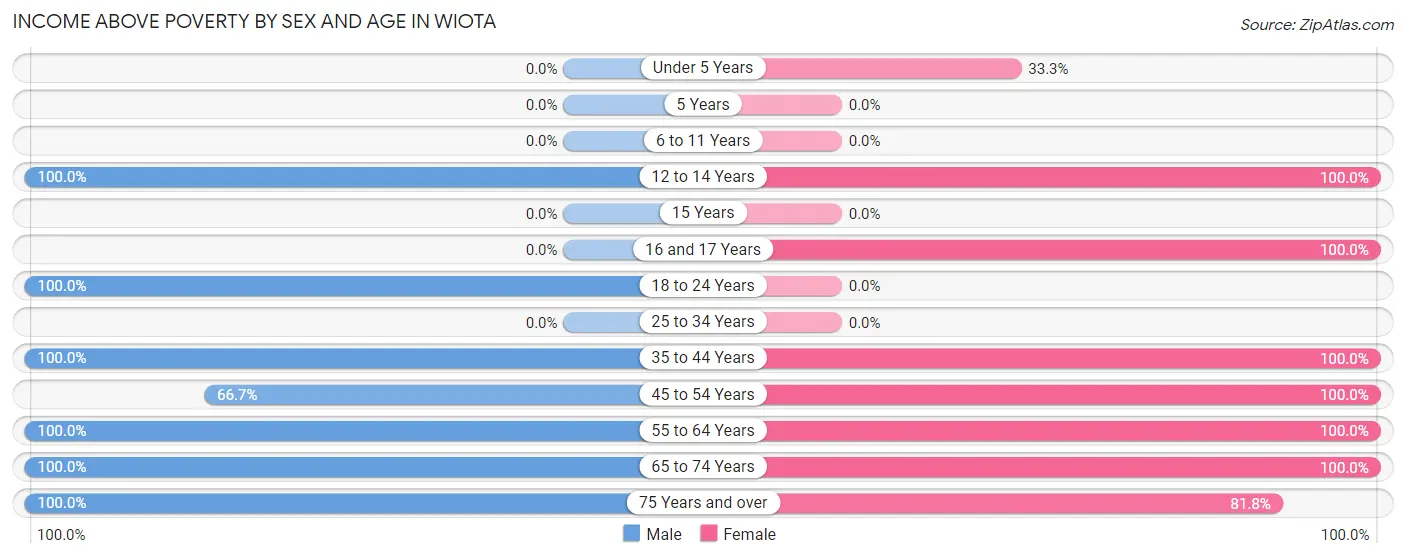
| Age Bracket | Male | Female |
| Under 5 Years | 0 (0.0%) | 1 (33.3%) |
| 5 Years | 0 (0.0%) | 0 (0.0%) |
| 6 to 11 Years | 0 (0.0%) | 0 (0.0%) |
| 12 to 14 Years | 4 (100.0%) | 4 (100.0%) |
| 15 Years | 0 (0.0%) | 0 (0.0%) |
| 16 and 17 Years | 0 (0.0%) | 5 (100.0%) |
| 18 to 24 Years | 1 (100.0%) | 0 (0.0%) |
| 25 to 34 Years | 0 (0.0%) | 0 (0.0%) |
| 35 to 44 Years | 6 (100.0%) | 4 (100.0%) |
| 45 to 54 Years | 4 (66.7%) | 3 (100.0%) |
| 55 to 64 Years | 3 (100.0%) | 13 (100.0%) |
| 65 to 74 Years | 10 (100.0%) | 2 (100.0%) |
| 75 Years and over | 7 (100.0%) | 9 (81.8%) |
| Total | 35 (94.6%) | 41 (89.1%) |
Income Below Poverty Among Married-Couple Families in Wiota
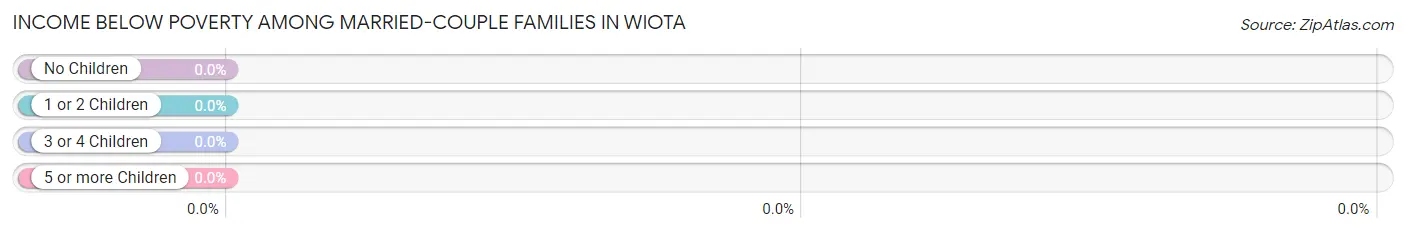
| Children | Above Poverty | Below Poverty |
| No Children | 15 (100.0%) | 0 (0.0%) |
| 1 or 2 Children | 0 (0.0%) | 0 (0.0%) |
| 3 or 4 Children | 4 (100.0%) | 0 (0.0%) |
| 5 or more Children | 0 (0.0%) | 0 (0.0%) |
| Total | 19 (100.0%) | 0 (0.0%) |
Income Below Poverty Among Single-Parent Households in Wiota
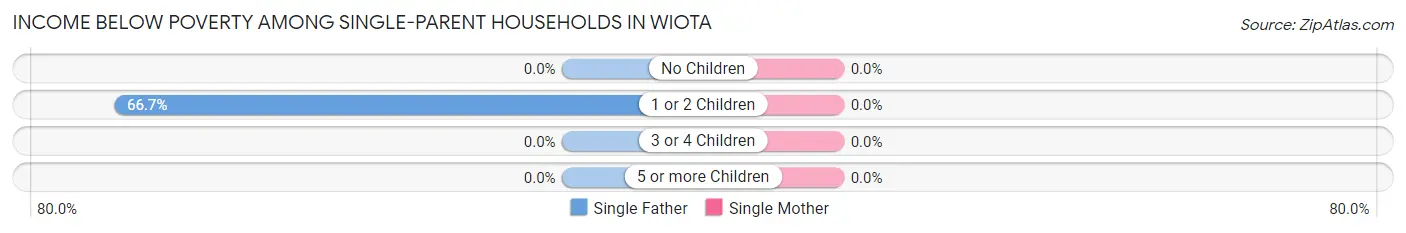
| Children | Single Father | Single Mother |
| No Children | 0 (0.0%) | 0 (0.0%) |
| 1 or 2 Children | 2 (66.7%) | 0 (0.0%) |
| 3 or 4 Children | 0 (0.0%) | 0 (0.0%) |
| 5 or more Children | 0 (0.0%) | 0 (0.0%) |
| Total | 2 (66.7%) | 0 (0.0%) |
Income Below Poverty Among Married-Couple vs Single-Parent Households in Wiota
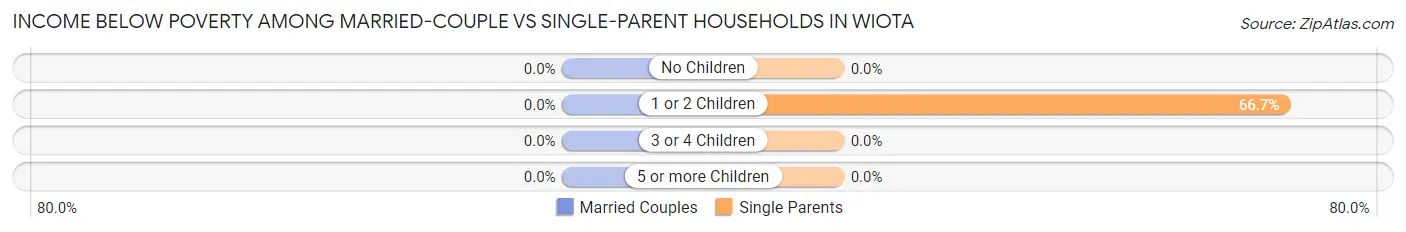
| Children | Married-Couple Families | Single-Parent Households |
| No Children | 0 (0.0%) | 0 (0.0%) |
| 1 or 2 Children | 0 (0.0%) | 2 (66.7%) |
| 3 or 4 Children | 0 (0.0%) | 0 (0.0%) |
| 5 or more Children | 0 (0.0%) | 0 (0.0%) |
| Total | 0 (0.0%) | 2 (33.3%) |
Race in Wiota
The most populous races in Wiota are White / Caucasian (83 | 100.0%), and Hispanic or Latino (1 | 1.2%).
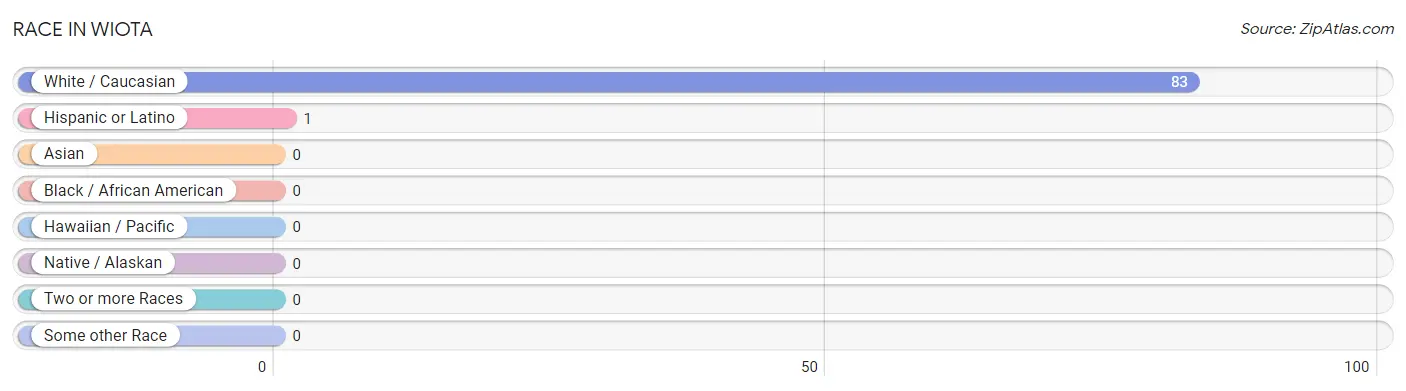
| Race | # Population | % Population |
| Asian | 0 | 0.0% |
| Black / African American | 0 | 0.0% |
| Hawaiian / Pacific | 0 | 0.0% |
| Hispanic or Latino | 1 | 1.2% |
| Native / Alaskan | 0 | 0.0% |
| White / Caucasian | 83 | 100.0% |
| Two or more Races | 0 | 0.0% |
| Some other Race | 0 | 0.0% |
| Total | 83 | 100.0% |
Ancestry in Wiota
The most populous ancestries reported in Wiota are Norwegian (44 | 53.0%), German (27 | 32.5%), Irish (18 | 21.7%), Swedish (10 | 12.0%), and Swiss (9 | 10.8%), together accounting for 130.1% of all Wiota residents.
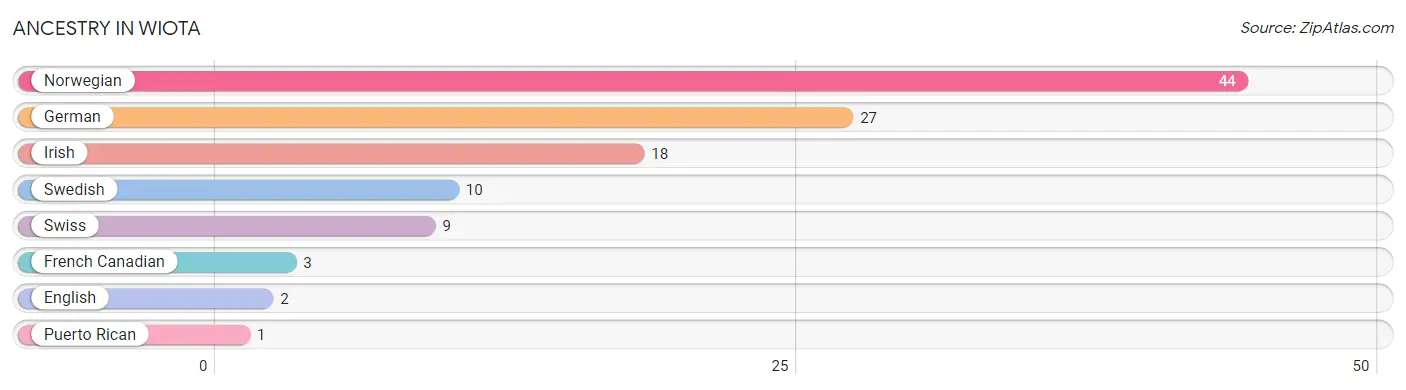
| Ancestry | # Population | % Population |
| English | 2 | 2.4% |
| French Canadian | 3 | 3.6% |
| German | 27 | 32.5% |
| Irish | 18 | 21.7% |
| Norwegian | 44 | 53.0% |
| Puerto Rican | 1 | 1.2% |
| Swedish | 10 | 12.0% |
| Swiss | 9 | 10.8% | View All 8 Rows |
Immigrants in Wiota

| Immigration Origin | # Population | % Population | View All 0 Rows |
Sex and Age in Wiota
Sex and Age in Wiota
The most populous age groups in Wiota are 70 to 74 Years (8 | 21.6%) for men and 55 to 59 Years (11 | 23.9%) for women.
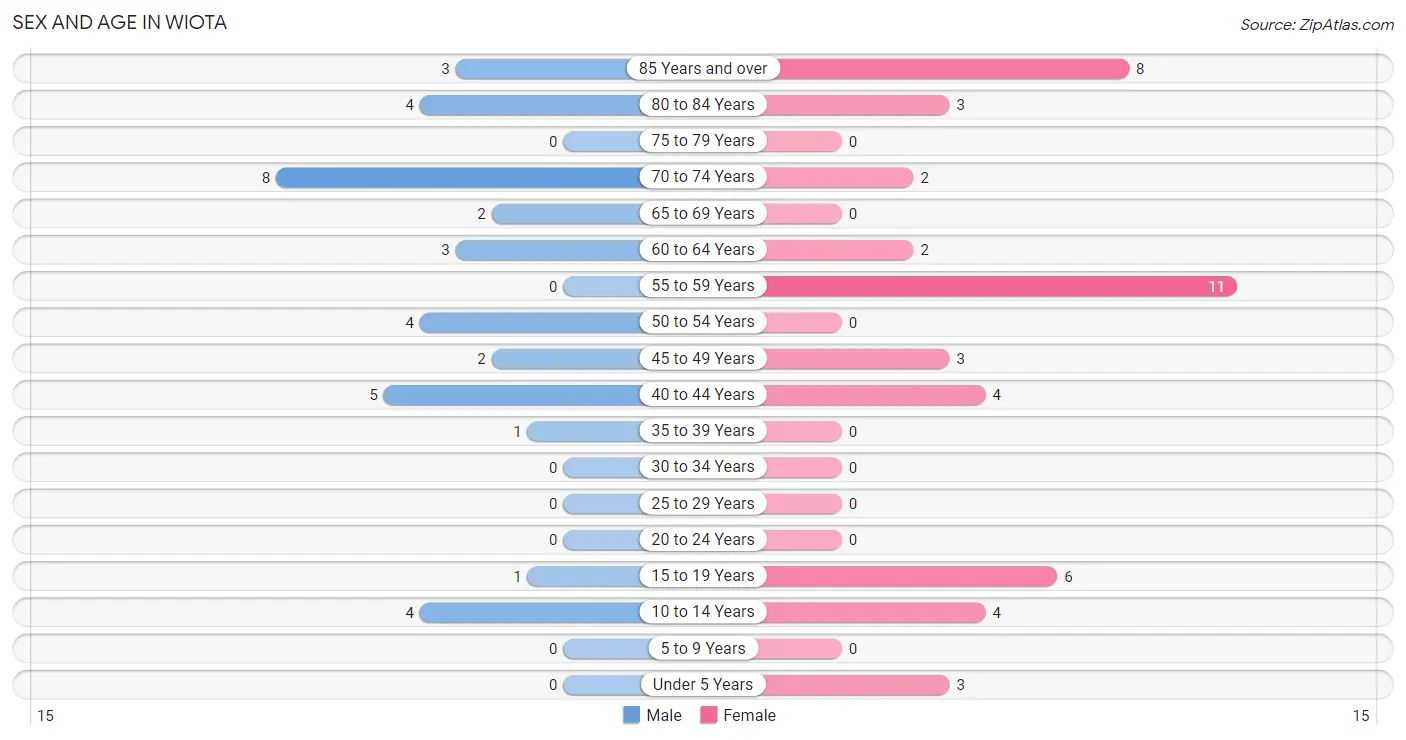
| Age Bracket | Male | Female |
| Under 5 Years | 0 (0.0%) | 3 (6.5%) |
| 5 to 9 Years | 0 (0.0%) | 0 (0.0%) |
| 10 to 14 Years | 4 (10.8%) | 4 (8.7%) |
| 15 to 19 Years | 1 (2.7%) | 6 (13.0%) |
| 20 to 24 Years | 0 (0.0%) | 0 (0.0%) |
| 25 to 29 Years | 0 (0.0%) | 0 (0.0%) |
| 30 to 34 Years | 0 (0.0%) | 0 (0.0%) |
| 35 to 39 Years | 1 (2.7%) | 0 (0.0%) |
| 40 to 44 Years | 5 (13.5%) | 4 (8.7%) |
| 45 to 49 Years | 2 (5.4%) | 3 (6.5%) |
| 50 to 54 Years | 4 (10.8%) | 0 (0.0%) |
| 55 to 59 Years | 0 (0.0%) | 11 (23.9%) |
| 60 to 64 Years | 3 (8.1%) | 2 (4.3%) |
| 65 to 69 Years | 2 (5.4%) | 0 (0.0%) |
| 70 to 74 Years | 8 (21.6%) | 2 (4.3%) |
| 75 to 79 Years | 0 (0.0%) | 0 (0.0%) |
| 80 to 84 Years | 4 (10.8%) | 3 (6.5%) |
| 85 Years and over | 3 (8.1%) | 8 (17.4%) |
| Total | 37 (100.0%) | 46 (100.0%) |
Families and Households in Wiota
Median Family Size in Wiota
The median family size in Wiota is 2.84 persons per family, with single female/mother families (3 | 12.0%) accounting for the largest median family size of 3.33 persons per family. On the other hand, single male/father families (3 | 12.0%) represent the smallest median family size with 2.67 persons per family.
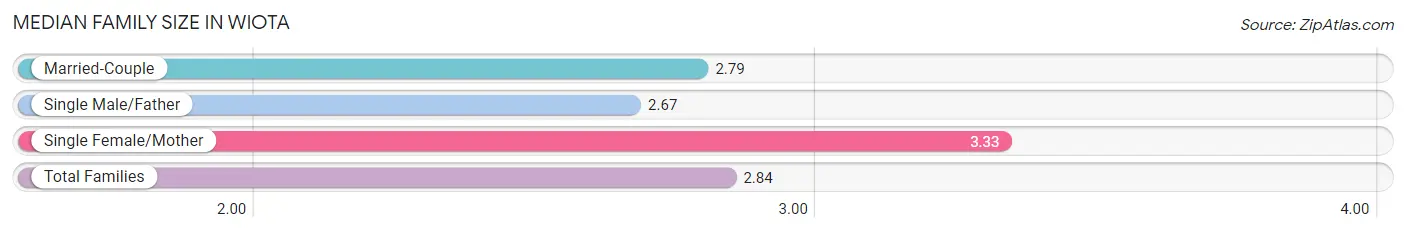
| Family Type | # Families | Family Size |
| Married-Couple | 19 (76.0%) | 2.79 |
| Single Male/Father | 3 (12.0%) | 2.67 |
| Single Female/Mother | 3 (12.0%) | 3.33 |
| Total Families | 25 (100.0%) | 2.84 |
Median Household Size in Wiota
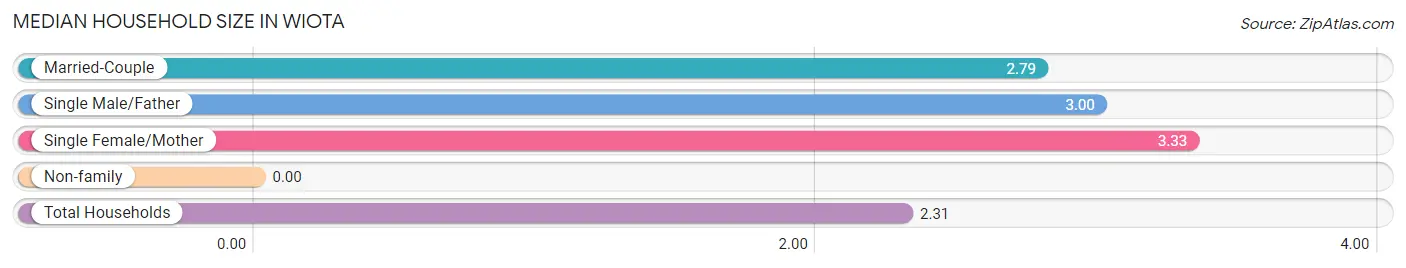
| Household Type | # Households | Household Size |
| Married-Couple | 19 (52.8%) | 2.79 |
| Single Male/Father | 3 (8.3%) | 3.00 |
| Single Female/Mother | 3 (8.3%) | 3.33 |
| Non-family | 11 (30.6%) | - |
| Total Households | 36 (100.0%) | 2.31 |
Household Size by Marriage Status in Wiota
Out of a total of 36 households in Wiota, 25 (69.4%) are family households, while 11 (30.6%) are nonfamily households. The most numerous type of family households are 2-person households, comprising 15, and the most common type of nonfamily households are 1-person households, comprising 11.
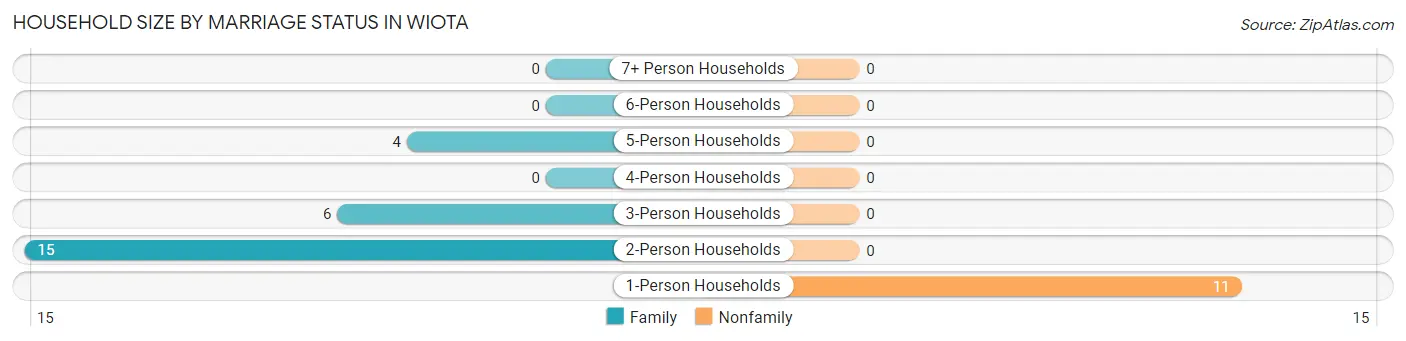
| Household Size | Family Households | Nonfamily Households |
| 1-Person Households | - | 11 (30.6%) |
| 2-Person Households | 15 (41.7%) | 0 (0.0%) |
| 3-Person Households | 6 (16.7%) | 0 (0.0%) |
| 4-Person Households | 0 (0.0%) | 0 (0.0%) |
| 5-Person Households | 4 (11.1%) | 0 (0.0%) |
| 6-Person Households | 0 (0.0%) | 0 (0.0%) |
| 7+ Person Households | 0 (0.0%) | 0 (0.0%) |
| Total | 25 (69.4%) | 11 (30.6%) |
Female Fertility in Wiota
Fertility by Age in Wiota
Average fertility rate in Wiota is 77.0 births per 1,000 women. Women in the age bracket of 15 to 19 years have the highest fertility rate with 167.0 births per 1,000 women. Women in the age bracket of 15 to 19 years acount for 100.0% of all women with births.
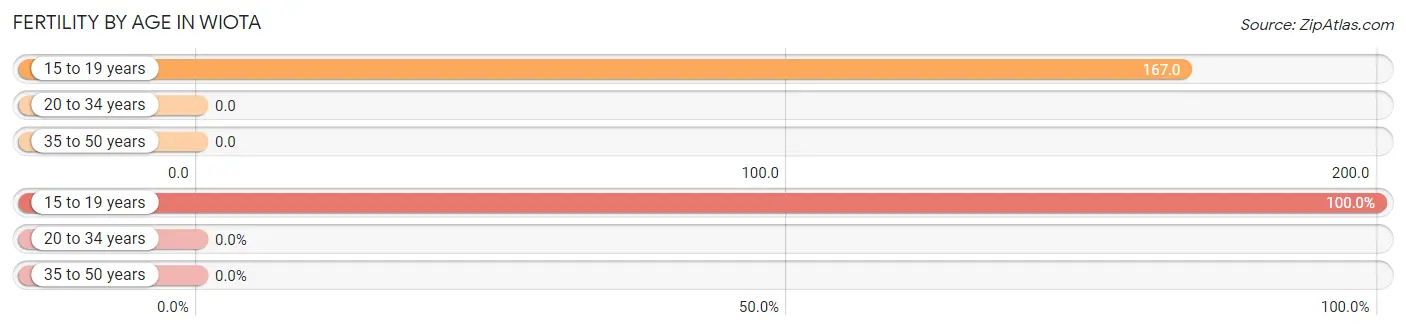
| Age Bracket | Women with Births | Births / 1,000 Women |
| 15 to 19 years | 1 (100.0%) | 167.0 |
| 20 to 34 years | 0 (0.0%) | 0.0 |
| 35 to 50 years | 0 (0.0%) | 0.0 |
| Total | 1 (100.0%) | 77.0 |
Fertility by Age by Marriage Status in Wiota
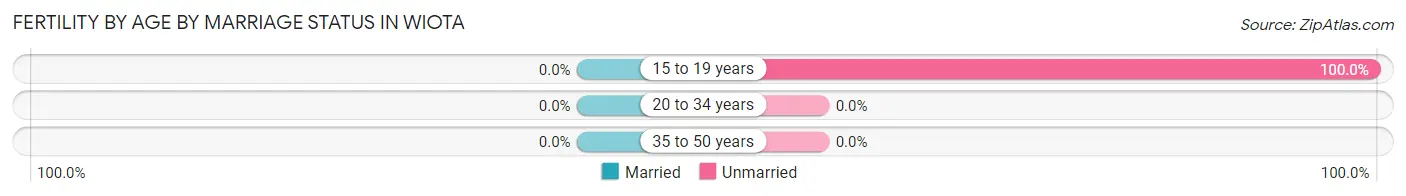
| Age Bracket | Married | Unmarried |
| 15 to 19 years | 0 (0.0%) | 1 (100.0%) |
| 20 to 34 years | 0 (0.0%) | 0 (0.0%) |
| 35 to 50 years | 0 (0.0%) | 0 (0.0%) |
| Total | 0 (0.0%) | 1 (100.0%) |
Fertility by Education in Wiota
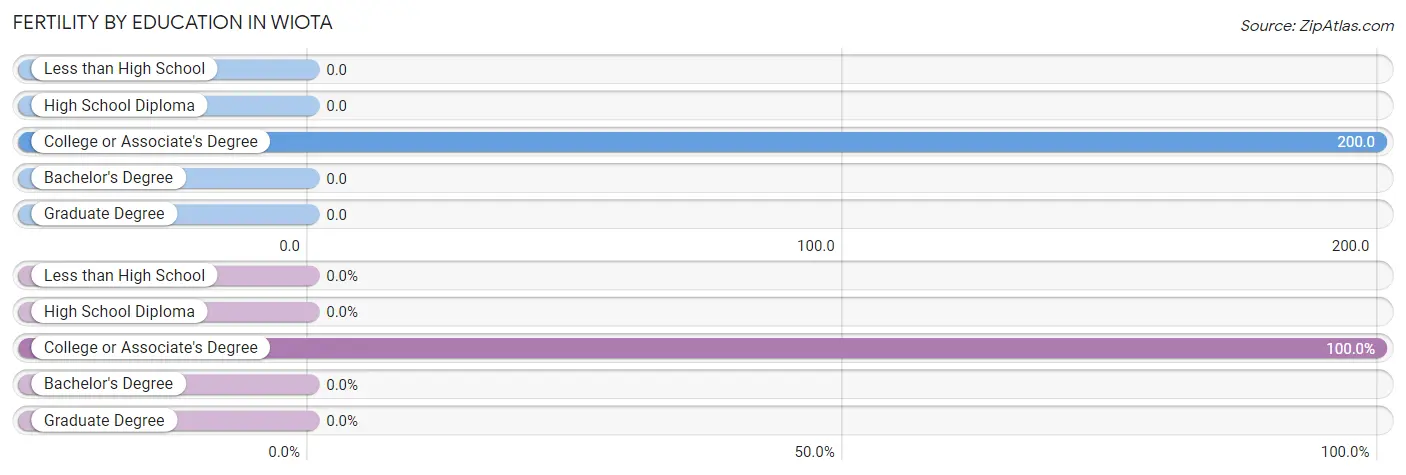
| Educational Attainment | Women with Births | Births / 1,000 Women |
| Less than High School | 0 (0.0%) | 0.0 |
| High School Diploma | 0 (0.0%) | 0.0 |
| College or Associate's Degree | 1 (100.0%) | 200.0 |
| Bachelor's Degree | 0 (0.0%) | 0.0 |
| Graduate Degree | 0 (0.0%) | 0.0 |
| Total | 1 (100.0%) | 77.0 |
Fertility by Education by Marriage Status in Wiota
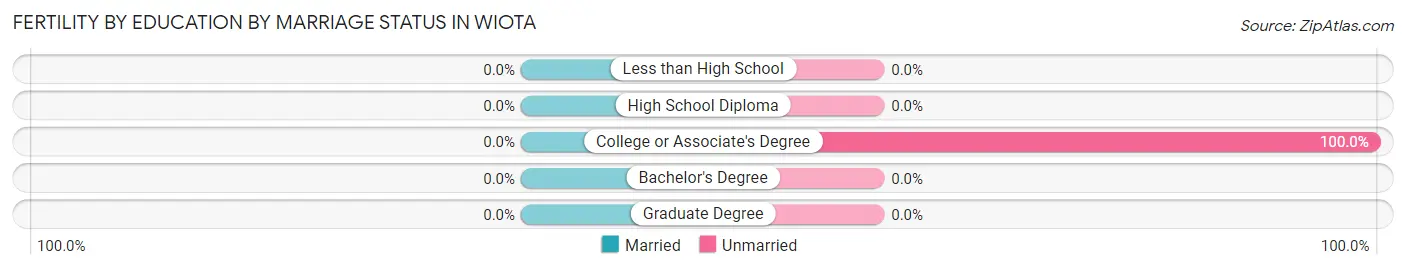
| Educational Attainment | Married | Unmarried |
| Less than High School | 0 (0.0%) | 0 (0.0%) |
| High School Diploma | 0 (0.0%) | 0 (0.0%) |
| College or Associate's Degree | 0 (0.0%) | 1 (100.0%) |
| Bachelor's Degree | 0 (0.0%) | 0 (0.0%) |
| Graduate Degree | 0 (0.0%) | 0 (0.0%) |
| Total | 0 (0.0%) | 1 (100.0%) |
Employment Characteristics in Wiota
Employment by Class of Employer in Wiota
Among the 29 employed individuals in Wiota, private company employees (17 | 58.6%), self-employed (incorporated) (6 | 20.7%), and not-for-profit organizations (4 | 13.8%) make up the most common classes of employment.
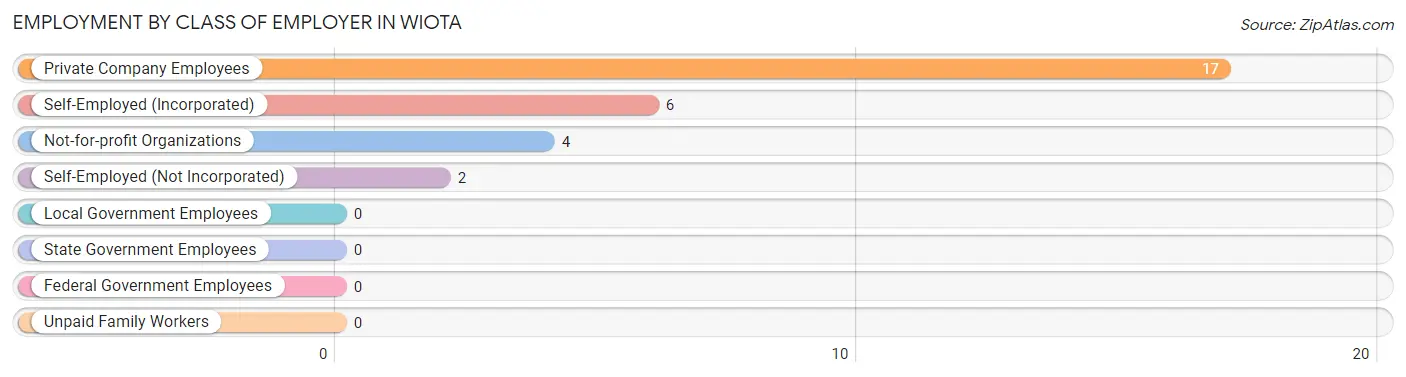
| Employer Class | # Employees | % Employees |
| Private Company Employees | 17 | 58.6% |
| Self-Employed (Incorporated) | 6 | 20.7% |
| Self-Employed (Not Incorporated) | 2 | 6.9% |
| Not-for-profit Organizations | 4 | 13.8% |
| Local Government Employees | 0 | 0.0% |
| State Government Employees | 0 | 0.0% |
| Federal Government Employees | 0 | 0.0% |
| Unpaid Family Workers | 0 | 0.0% |
| Total | 29 | 100.0% |
Employment Status by Age in Wiota
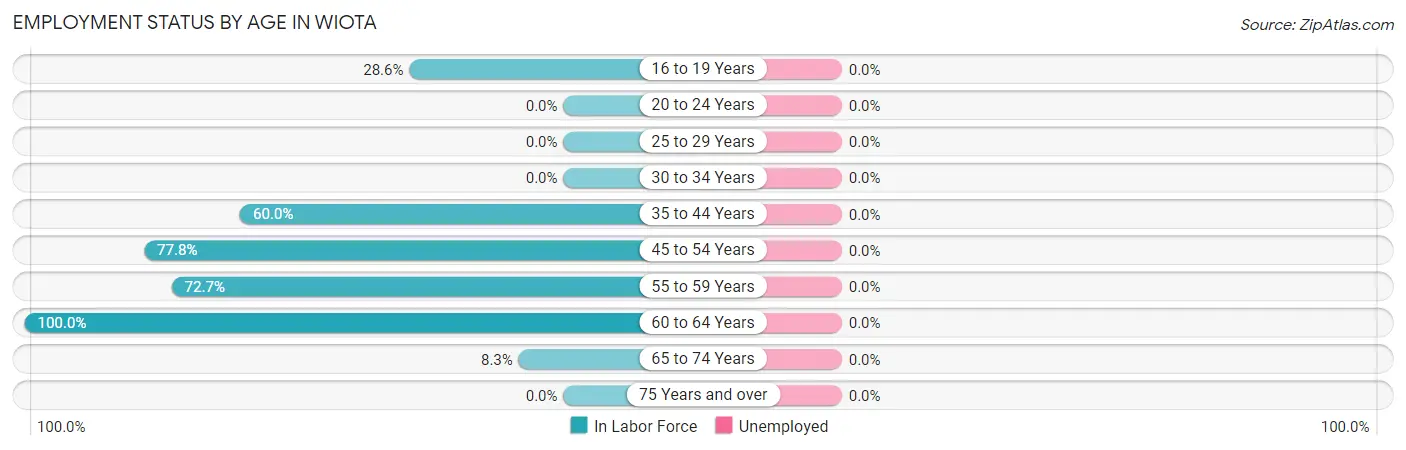
| Age Bracket | In Labor Force | Unemployed |
| 16 to 19 Years | 2 (28.6%) | 0 (0.0%) |
| 20 to 24 Years | 0 (0.0%) | 0 (0.0%) |
| 25 to 29 Years | 0 (0.0%) | 0 (0.0%) |
| 30 to 34 Years | 0 (0.0%) | 0 (0.0%) |
| 35 to 44 Years | 6 (60.0%) | 0 (0.0%) |
| 45 to 54 Years | 7 (77.8%) | 0 (0.0%) |
| 55 to 59 Years | 8 (72.7%) | 0 (0.0%) |
| 60 to 64 Years | 5 (100.0%) | 0 (0.0%) |
| 65 to 74 Years | 1 (8.3%) | 0 (0.0%) |
| 75 Years and over | 0 (0.0%) | 0 (0.0%) |
| Total | 29 (40.3%) | 0 (0.0%) |
Employment Status by Educational Attainment in Wiota
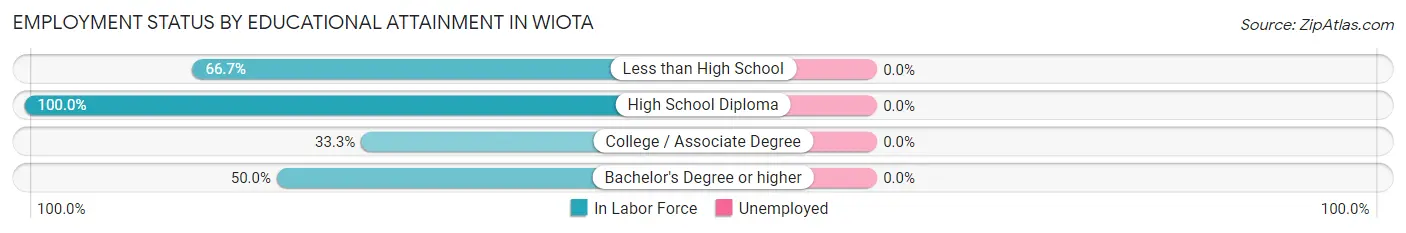
| Educational Attainment | In Labor Force | Unemployed |
| Less than High School | 4 (66.7%) | 0 (0.0%) |
| High School Diploma | 17 (100.0%) | 0 (0.0%) |
| College / Associate Degree | 2 (33.3%) | 0 (0.0%) |
| Bachelor's Degree or higher | 3 (50.0%) | 0 (0.0%) |
| Total | 26 (74.3%) | 0 (0.0%) |
Employment Occupations by Sex in Wiota
Management, Business, Science and Arts Occupations
The most common Management, Business, Science and Arts occupations in Wiota are Management (8 | 27.6%), Community & Social Service (3 | 10.3%), Education, Arts & Media (3 | 10.3%), and Health Diagnosing & Treating (1 | 3.5%).
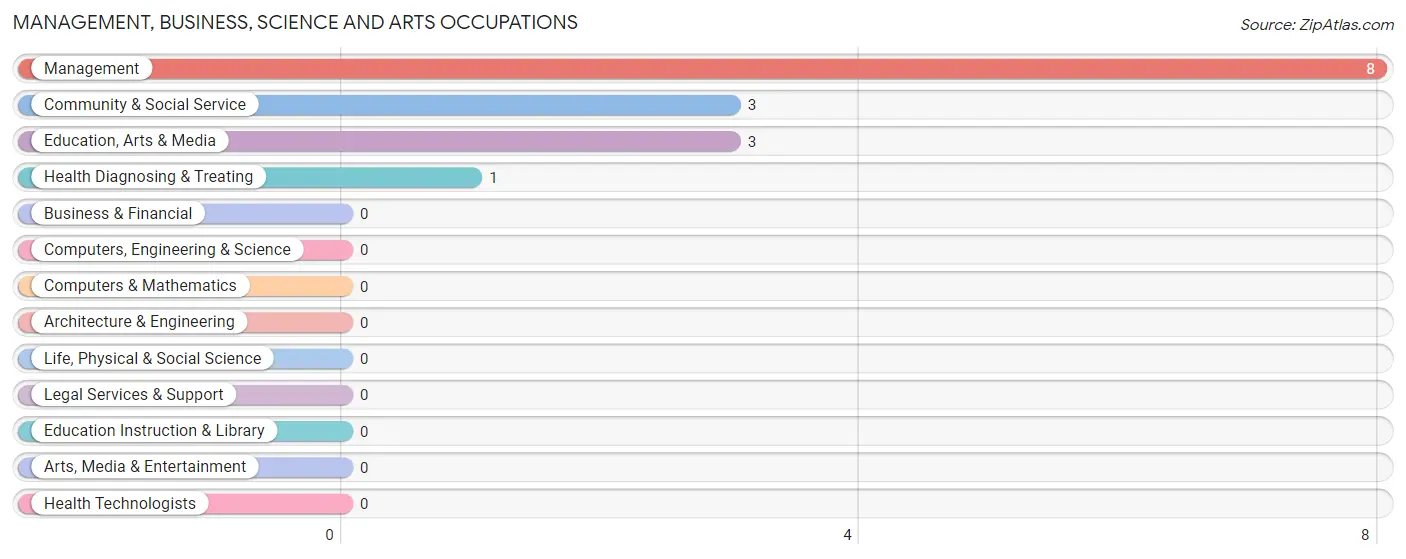
Management, Business, Science and Arts Occupations by Sex
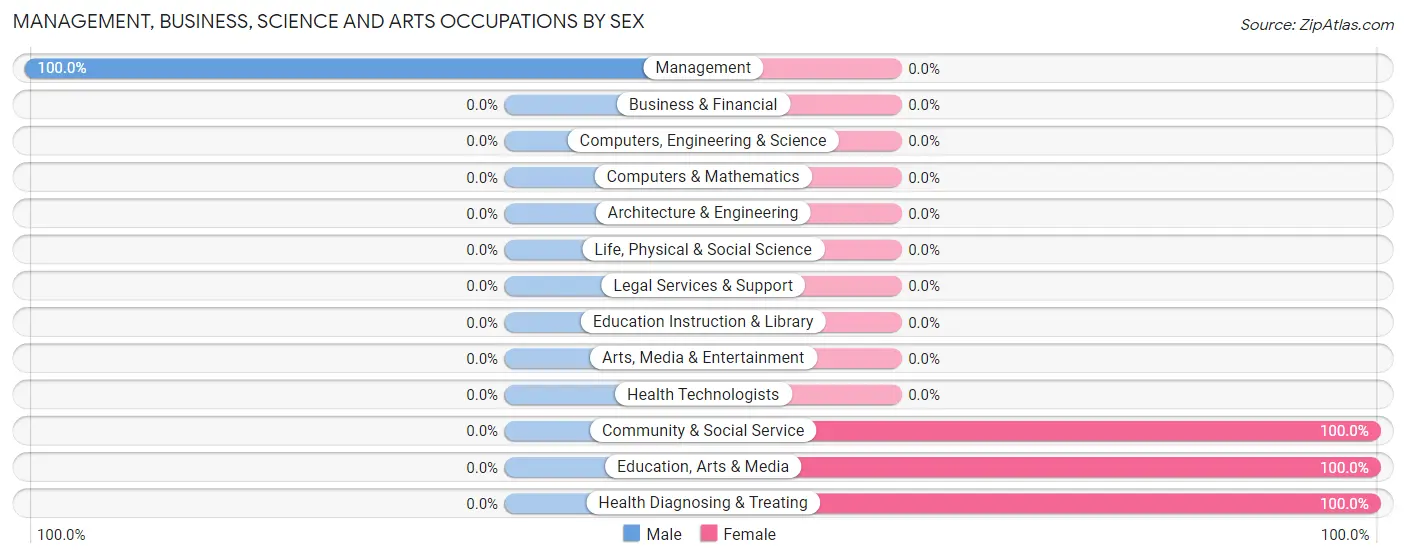
| Occupation | Male | Female |
| Management | 8 (100.0%) | 0 (0.0%) |
| Business & Financial | 0 (0.0%) | 0 (0.0%) |
| Computers, Engineering & Science | 0 (0.0%) | 0 (0.0%) |
| Computers & Mathematics | 0 (0.0%) | 0 (0.0%) |
| Architecture & Engineering | 0 (0.0%) | 0 (0.0%) |
| Life, Physical & Social Science | 0 (0.0%) | 0 (0.0%) |
| Community & Social Service | 0 (0.0%) | 3 (100.0%) |
| Education, Arts & Media | 0 (0.0%) | 3 (100.0%) |
| Legal Services & Support | 0 (0.0%) | 0 (0.0%) |
| Education Instruction & Library | 0 (0.0%) | 0 (0.0%) |
| Arts, Media & Entertainment | 0 (0.0%) | 0 (0.0%) |
| Health Diagnosing & Treating | 0 (0.0%) | 1 (100.0%) |
| Health Technologists | 0 (0.0%) | 0 (0.0%) |
| Total (Category) | 8 (66.7%) | 4 (33.3%) |
| Total (Overall) | 15 (51.7%) | 14 (48.3%) |
Services Occupations
Services Occupations by Sex
| Occupation | Male | Female |
| Healthcare Support | 0 (0.0%) | 0 (0.0%) |
| Security & Protection | 0 (0.0%) | 0 (0.0%) |
| Firefighting & Prevention | 0 (0.0%) | 0 (0.0%) |
| Law Enforcement | 0 (0.0%) | 0 (0.0%) |
| Food Preparation & Serving | 0 (0.0%) | 0 (0.0%) |
| Cleaning & Maintenance | 0 (0.0%) | 0 (0.0%) |
| Personal Care & Service | 0 (0.0%) | 0 (0.0%) |
| Total (Category) | 0 (0.0%) | 0 (0.0%) |
| Total (Overall) | 15 (51.7%) | 14 (48.3%) |
Sales and Office Occupations
The most common Sales and Office occupations in Wiota are , and Office & Administration (8 | 27.6%).
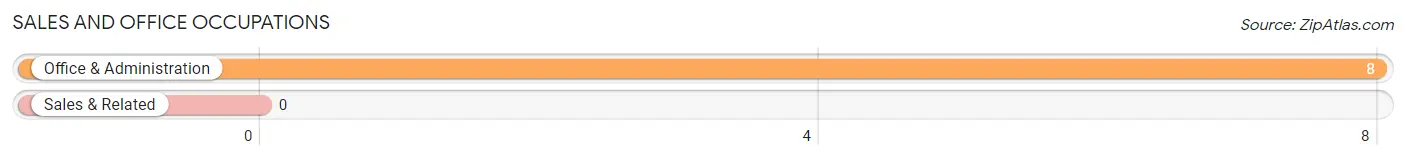
Sales and Office Occupations by Sex
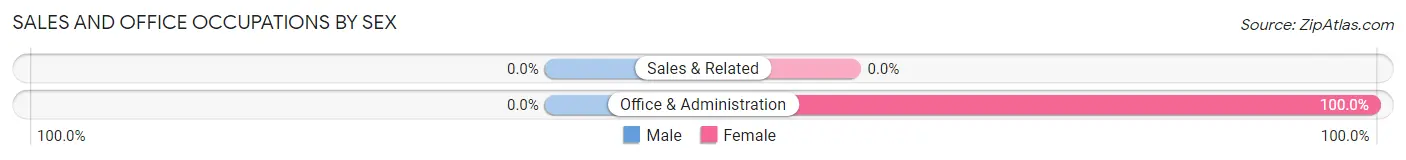
| Occupation | Male | Female |
| Sales & Related | 0 (0.0%) | 0 (0.0%) |
| Office & Administration | 0 (0.0%) | 8 (100.0%) |
| Total (Category) | 0 (0.0%) | 8 (100.0%) |
| Total (Overall) | 15 (51.7%) | 14 (48.3%) |
Natural Resources, Construction and Maintenance Occupations
The most common Natural Resources, Construction and Maintenance occupations in Wiota are , and Installation, Maintenance & Repair (2 | 6.9%).
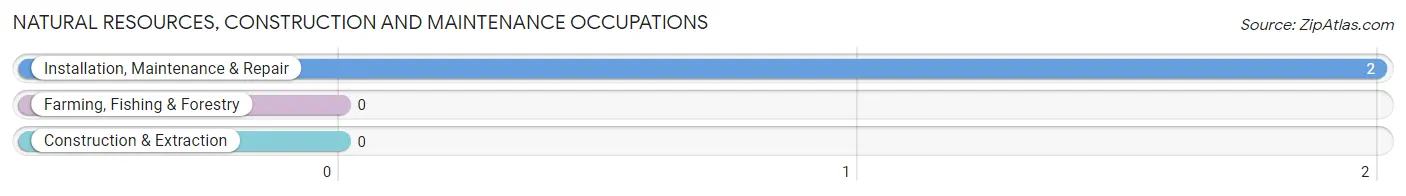
Natural Resources, Construction and Maintenance Occupations by Sex
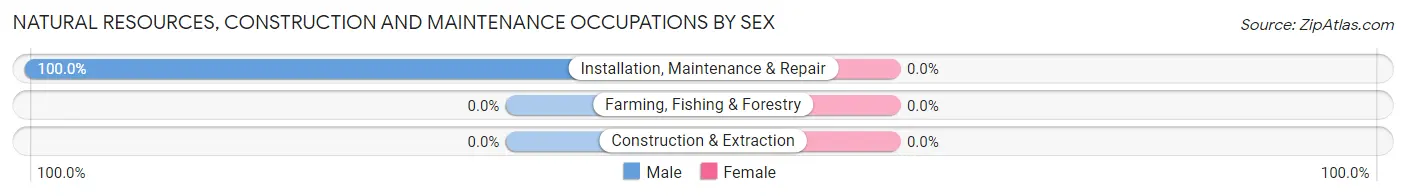
| Occupation | Male | Female |
| Farming, Fishing & Forestry | 0 (0.0%) | 0 (0.0%) |
| Construction & Extraction | 0 (0.0%) | 0 (0.0%) |
| Installation, Maintenance & Repair | 2 (100.0%) | 0 (0.0%) |
| Total (Category) | 2 (100.0%) | 0 (0.0%) |
| Total (Overall) | 15 (51.7%) | 14 (48.3%) |
Production, Transportation and Moving Occupations
The most common Production, Transportation and Moving occupations in Wiota are Production (6 | 20.7%), and Material Moving (1 | 3.5%).
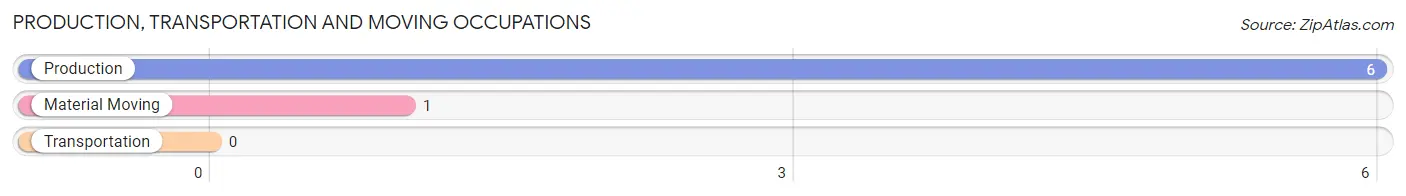
Production, Transportation and Moving Occupations by Sex
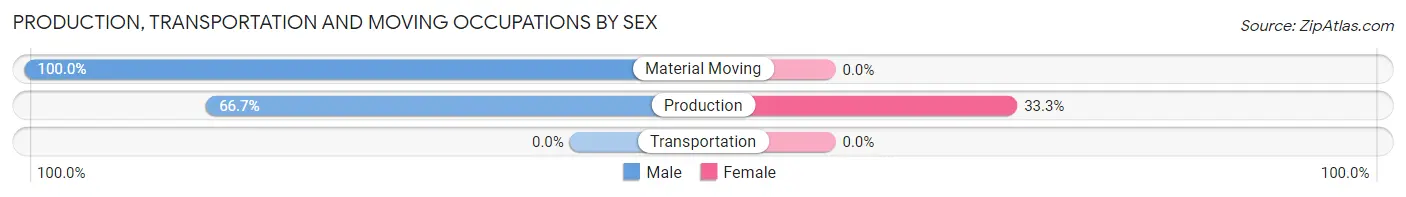
| Occupation | Male | Female |
| Production | 4 (66.7%) | 2 (33.3%) |
| Transportation | 0 (0.0%) | 0 (0.0%) |
| Material Moving | 1 (100.0%) | 0 (0.0%) |
| Total (Category) | 5 (71.4%) | 2 (28.6%) |
| Total (Overall) | 15 (51.7%) | 14 (48.3%) |
Employment Industries by Sex in Wiota
Employment Industries in Wiota
The major employment industries in Wiota include Agriculture, Fishing & Hunting (8 | 27.6%), Manufacturing (8 | 27.6%), Retail Trade (7 | 24.1%), Construction (1 | 3.5%), and Finance & Insurance (1 | 3.5%).
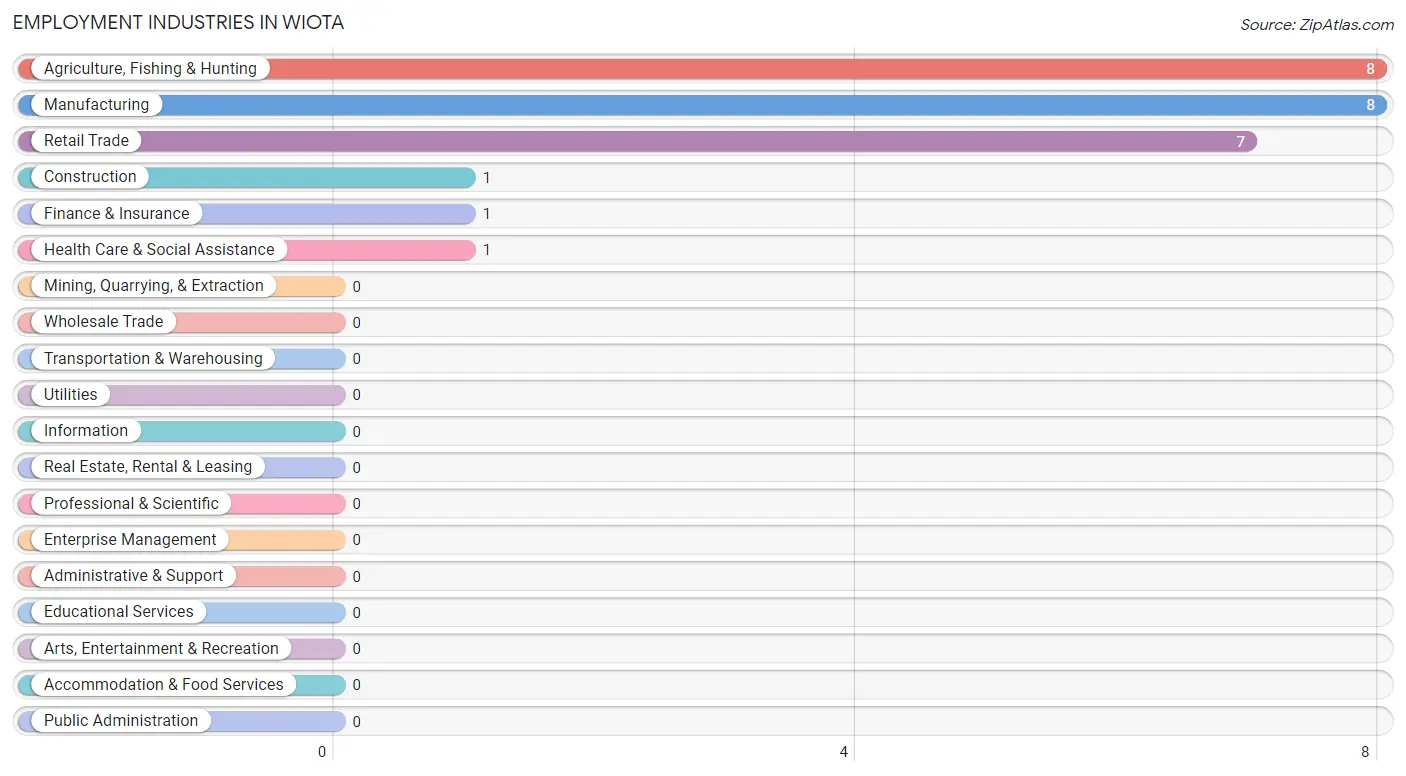
Employment Industries by Sex in Wiota
The Wiota industries that see more men than women are Agriculture, Fishing & Hunting (100.0%), Construction (100.0%), and Manufacturing (75.0%), whereas the industries that tend to have a higher number of women are Retail Trade (100.0%), Finance & Insurance (100.0%), and Health Care & Social Assistance (100.0%).
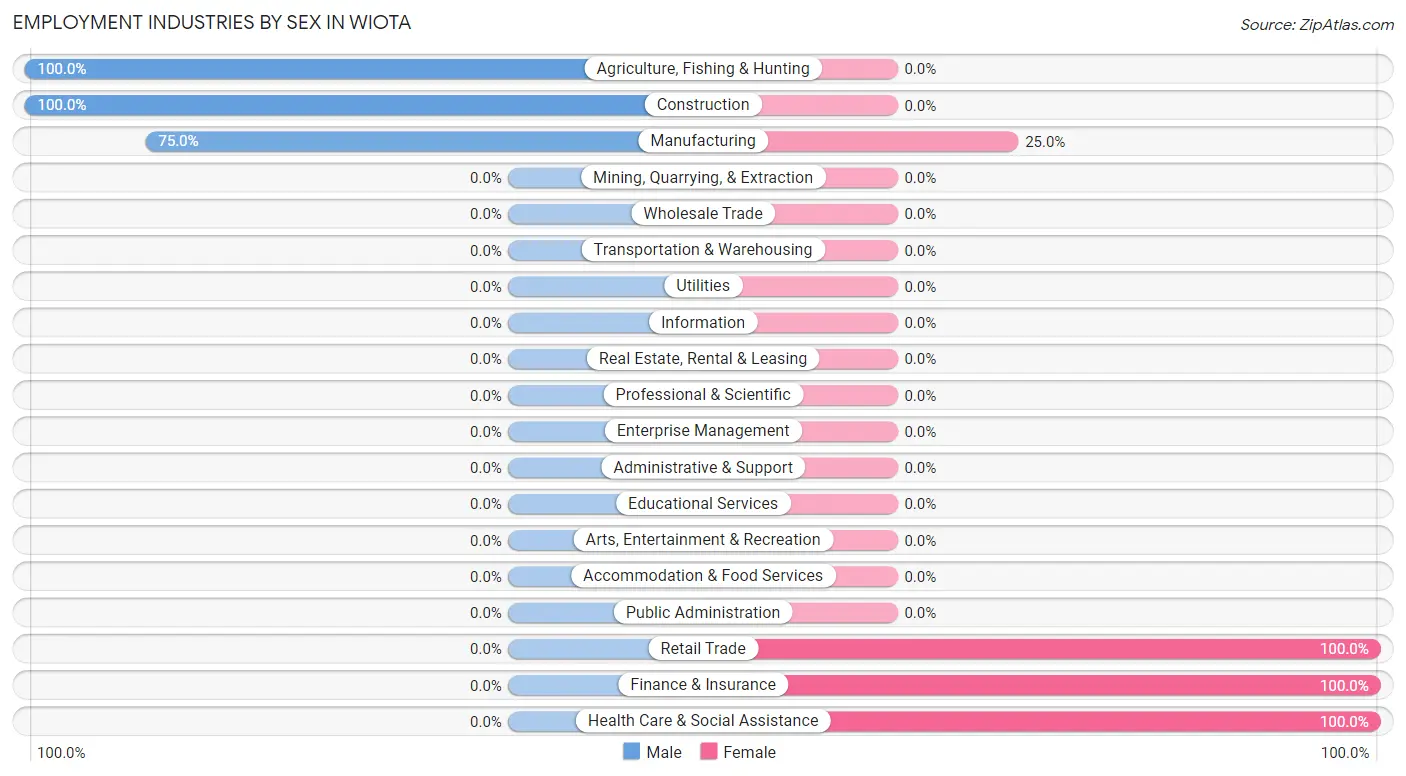
| Industry | Male | Female |
| Agriculture, Fishing & Hunting | 8 (100.0%) | 0 (0.0%) |
| Mining, Quarrying, & Extraction | 0 (0.0%) | 0 (0.0%) |
| Construction | 1 (100.0%) | 0 (0.0%) |
| Manufacturing | 6 (75.0%) | 2 (25.0%) |
| Wholesale Trade | 0 (0.0%) | 0 (0.0%) |
| Retail Trade | 0 (0.0%) | 7 (100.0%) |
| Transportation & Warehousing | 0 (0.0%) | 0 (0.0%) |
| Utilities | 0 (0.0%) | 0 (0.0%) |
| Information | 0 (0.0%) | 0 (0.0%) |
| Finance & Insurance | 0 (0.0%) | 1 (100.0%) |
| Real Estate, Rental & Leasing | 0 (0.0%) | 0 (0.0%) |
| Professional & Scientific | 0 (0.0%) | 0 (0.0%) |
| Enterprise Management | 0 (0.0%) | 0 (0.0%) |
| Administrative & Support | 0 (0.0%) | 0 (0.0%) |
| Educational Services | 0 (0.0%) | 0 (0.0%) |
| Health Care & Social Assistance | 0 (0.0%) | 1 (100.0%) |
| Arts, Entertainment & Recreation | 0 (0.0%) | 0 (0.0%) |
| Accommodation & Food Services | 0 (0.0%) | 0 (0.0%) |
| Public Administration | 0 (0.0%) | 0 (0.0%) |
| Total | 15 (51.7%) | 14 (48.3%) |
Education in Wiota
School Enrollment in Wiota
The most common levels of schooling among the 14 students in Wiota are middle school (8 | 57.1%), high school (5 | 35.7%), and college / undergraduate (1 | 7.1%).
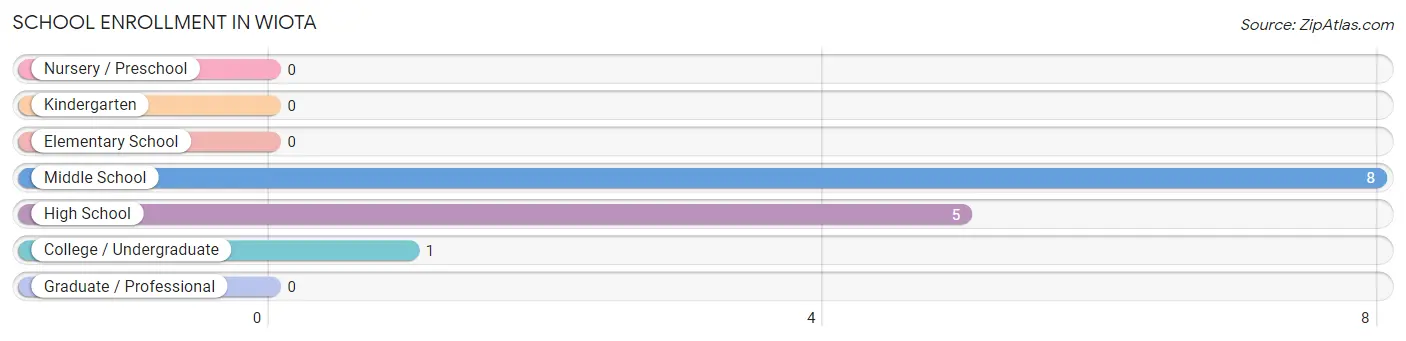
| School Level | # Students | % Students |
| Nursery / Preschool | 0 | 0.0% |
| Kindergarten | 0 | 0.0% |
| Elementary School | 0 | 0.0% |
| Middle School | 8 | 57.1% |
| High School | 5 | 35.7% |
| College / Undergraduate | 1 | 7.1% |
| Graduate / Professional | 0 | 0.0% |
| Total | 14 | 100.0% |
School Enrollment by Age by Funding Source in Wiota
Out of a total of 14 students who are enrolled in schools in Wiota, 1 (7.1%) attend a private institution, while the remaining 13 (92.9%) are enrolled in public schools. The age group of 18 to 19 year olds has the highest likelihood of being enrolled in private schools, with 1 (100.0% in the age bracket) enrolled. Conversely, the age group of 10 to 14 year olds has the lowest likelihood of being enrolled in a private school, with 8 (100.0% in the age bracket) attending a public institution.
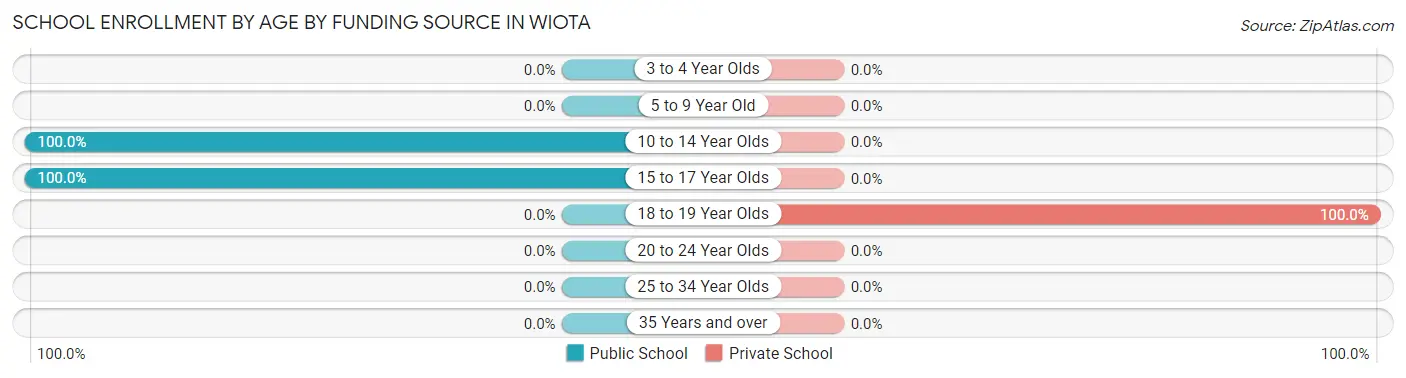
| Age Bracket | Public School | Private School |
| 3 to 4 Year Olds | 0 (0.0%) | 0 (0.0%) |
| 5 to 9 Year Old | 0 (0.0%) | 0 (0.0%) |
| 10 to 14 Year Olds | 8 (100.0%) | 0 (0.0%) |
| 15 to 17 Year Olds | 5 (100.0%) | 0 (0.0%) |
| 18 to 19 Year Olds | 0 (0.0%) | 1 (100.0%) |
| 20 to 24 Year Olds | 0 (0.0%) | 0 (0.0%) |
| 25 to 34 Year Olds | 0 (0.0%) | 0 (0.0%) |
| 35 Years and over | 0 (0.0%) | 0 (0.0%) |
| Total | 13 (92.9%) | 1 (7.1%) |
Educational Attainment by Field of Study in Wiota
Engineering (4 | 30.8%), science & technology (3 | 23.1%), business (3 | 23.1%), and literature & languages (3 | 23.1%) are the most common fields of study among 13 individuals in Wiota who have obtained a bachelor's degree or higher.
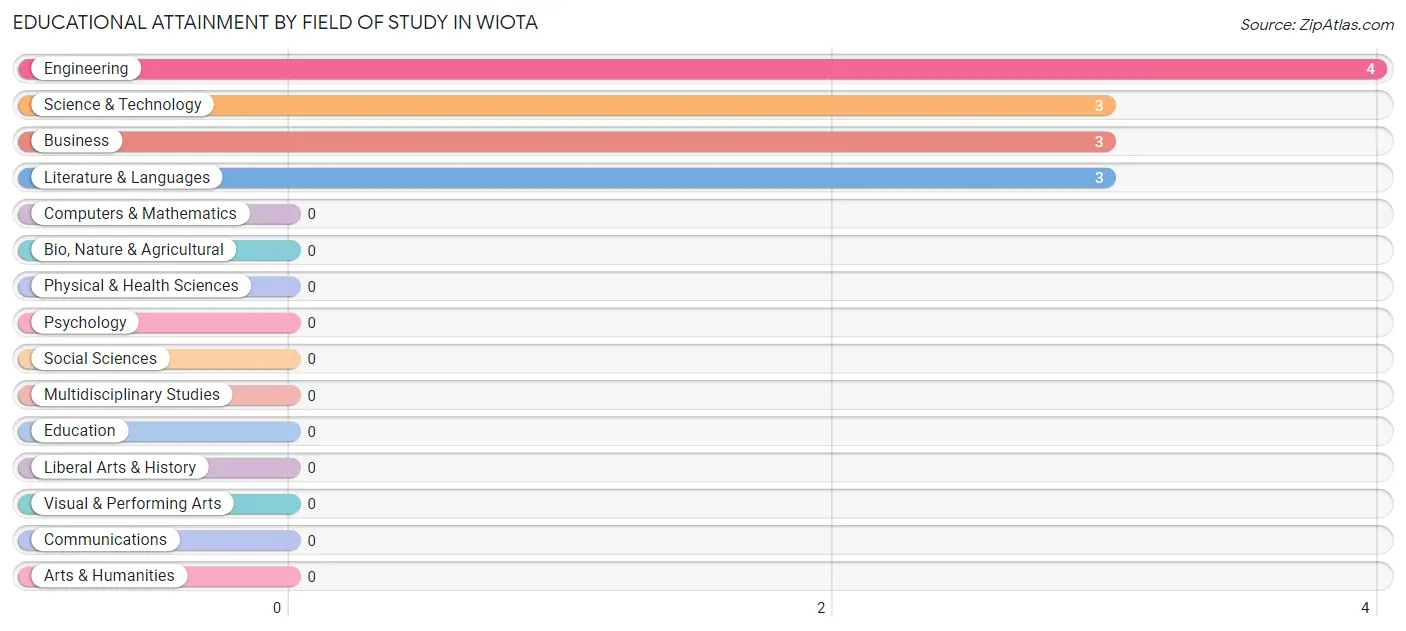
| Field of Study | # Graduates | % Graduates |
| Computers & Mathematics | 0 | 0.0% |
| Bio, Nature & Agricultural | 0 | 0.0% |
| Physical & Health Sciences | 0 | 0.0% |
| Psychology | 0 | 0.0% |
| Social Sciences | 0 | 0.0% |
| Engineering | 4 | 30.8% |
| Multidisciplinary Studies | 0 | 0.0% |
| Science & Technology | 3 | 23.1% |
| Business | 3 | 23.1% |
| Education | 0 | 0.0% |
| Literature & Languages | 3 | 23.1% |
| Liberal Arts & History | 0 | 0.0% |
| Visual & Performing Arts | 0 | 0.0% |
| Communications | 0 | 0.0% |
| Arts & Humanities | 0 | 0.0% |
| Total | 13 | 100.0% |
Transportation & Commute in Wiota
Vehicle Availability by Sex in Wiota
The most prevalent vehicle ownership categories in Wiota are males with 3 vehicles (6, accounting for 40.0%) and females with 3 vehicles (0, making up 42.9%).
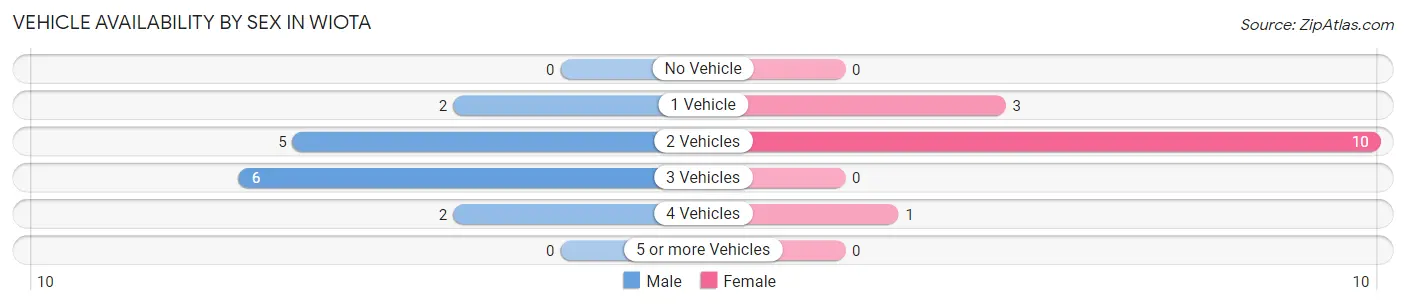
| Vehicles Available | Male | Female |
| No Vehicle | 0 (0.0%) | 0 (0.0%) |
| 1 Vehicle | 2 (13.3%) | 3 (21.4%) |
| 2 Vehicles | 5 (33.3%) | 10 (71.4%) |
| 3 Vehicles | 6 (40.0%) | 0 (0.0%) |
| 4 Vehicles | 2 (13.3%) | 1 (7.1%) |
| 5 or more Vehicles | 0 (0.0%) | 0 (0.0%) |
| Total | 15 (100.0%) | 14 (100.0%) |
Commute Time in Wiota
The most frequently occuring commute durations in Wiota are 25 to 29 minutes (7 commuters, 30.4%), less than 5 minutes (5 commuters, 21.7%), and 20 to 24 minutes (3 commuters, 13.0%).
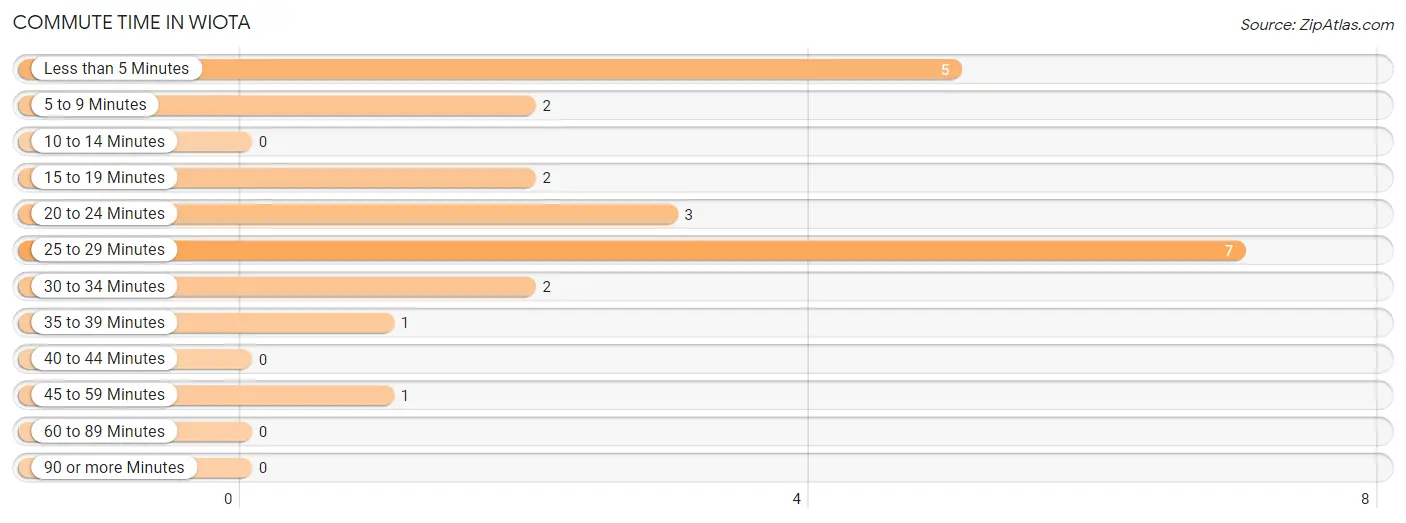
| Commute Time | # Commuters | % Commuters |
| Less than 5 Minutes | 5 | 21.7% |
| 5 to 9 Minutes | 2 | 8.7% |
| 10 to 14 Minutes | 0 | 0.0% |
| 15 to 19 Minutes | 2 | 8.7% |
| 20 to 24 Minutes | 3 | 13.0% |
| 25 to 29 Minutes | 7 | 30.4% |
| 30 to 34 Minutes | 2 | 8.7% |
| 35 to 39 Minutes | 1 | 4.3% |
| 40 to 44 Minutes | 0 | 0.0% |
| 45 to 59 Minutes | 1 | 4.3% |
| 60 to 89 Minutes | 0 | 0.0% |
| 90 or more Minutes | 0 | 0.0% |
Commute Time by Sex in Wiota
The most common commute times in Wiota are 20 to 24 minutes (3 commuters, 33.3%) for males and 25 to 29 minutes (7 commuters, 50.0%) for females.
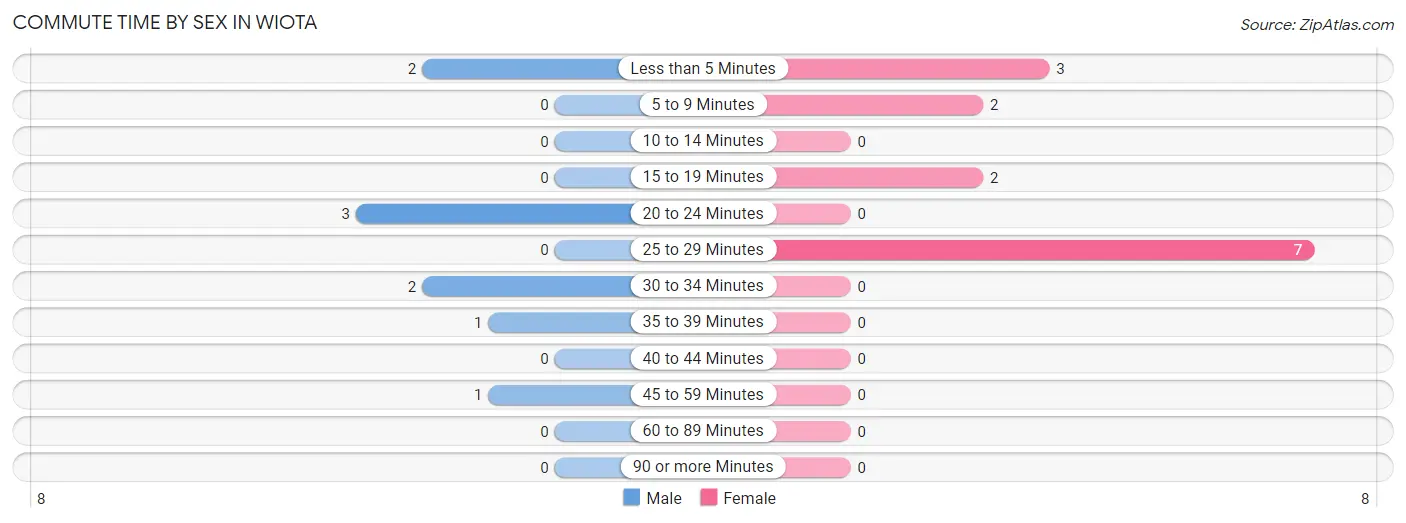
| Commute Time | Male | Female |
| Less than 5 Minutes | 2 (22.2%) | 3 (21.4%) |
| 5 to 9 Minutes | 0 (0.0%) | 2 (14.3%) |
| 10 to 14 Minutes | 0 (0.0%) | 0 (0.0%) |
| 15 to 19 Minutes | 0 (0.0%) | 2 (14.3%) |
| 20 to 24 Minutes | 3 (33.3%) | 0 (0.0%) |
| 25 to 29 Minutes | 0 (0.0%) | 7 (50.0%) |
| 30 to 34 Minutes | 2 (22.2%) | 0 (0.0%) |
| 35 to 39 Minutes | 1 (11.1%) | 0 (0.0%) |
| 40 to 44 Minutes | 0 (0.0%) | 0 (0.0%) |
| 45 to 59 Minutes | 1 (11.1%) | 0 (0.0%) |
| 60 to 89 Minutes | 0 (0.0%) | 0 (0.0%) |
| 90 or more Minutes | 0 (0.0%) | 0 (0.0%) |
Time of Departure to Work by Sex in Wiota
The most frequent times of departure to work in Wiota are 12:00 AM to 4:59 AM (5, 55.6%) for males and 6:30 AM to 6:59 AM (7, 50.0%) for females.
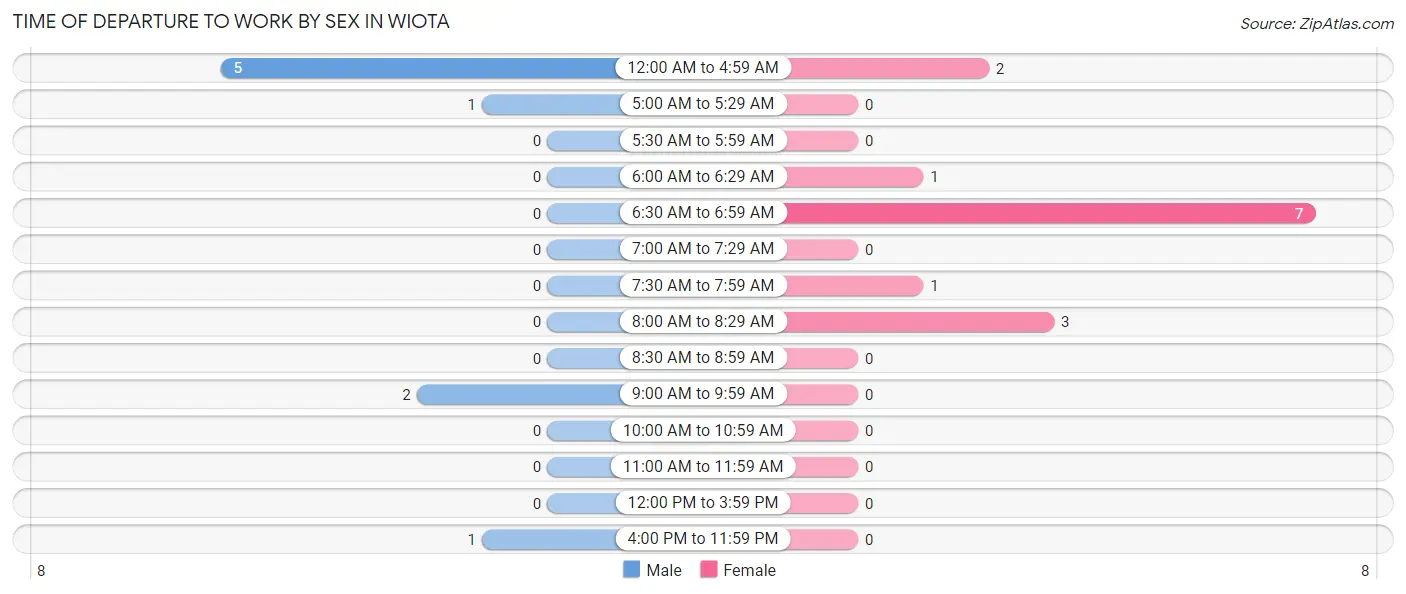
| Time of Departure | Male | Female |
| 12:00 AM to 4:59 AM | 5 (55.6%) | 2 (14.3%) |
| 5:00 AM to 5:29 AM | 1 (11.1%) | 0 (0.0%) |
| 5:30 AM to 5:59 AM | 0 (0.0%) | 0 (0.0%) |
| 6:00 AM to 6:29 AM | 0 (0.0%) | 1 (7.1%) |
| 6:30 AM to 6:59 AM | 0 (0.0%) | 7 (50.0%) |
| 7:00 AM to 7:29 AM | 0 (0.0%) | 0 (0.0%) |
| 7:30 AM to 7:59 AM | 0 (0.0%) | 1 (7.1%) |
| 8:00 AM to 8:29 AM | 0 (0.0%) | 3 (21.4%) |
| 8:30 AM to 8:59 AM | 0 (0.0%) | 0 (0.0%) |
| 9:00 AM to 9:59 AM | 2 (22.2%) | 0 (0.0%) |
| 10:00 AM to 10:59 AM | 0 (0.0%) | 0 (0.0%) |
| 11:00 AM to 11:59 AM | 0 (0.0%) | 0 (0.0%) |
| 12:00 PM to 3:59 PM | 0 (0.0%) | 0 (0.0%) |
| 4:00 PM to 11:59 PM | 1 (11.1%) | 0 (0.0%) |
| Total | 9 (100.0%) | 14 (100.0%) |
Housing Occupancy in Wiota
Occupancy by Ownership in Wiota
Of the total 36 dwellings in Wiota, owner-occupied units account for 33 (91.7%), while renter-occupied units make up 3 (8.3%).
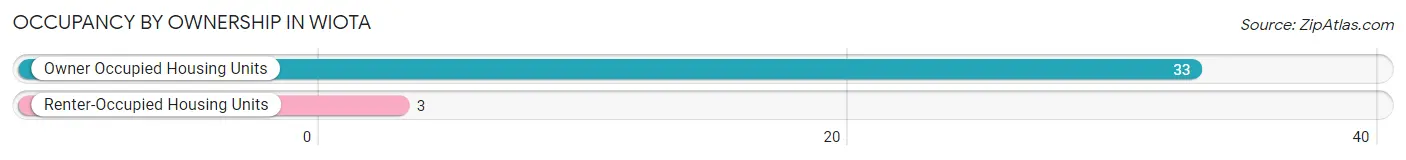
| Occupancy | # Housing Units | % Housing Units |
| Owner Occupied Housing Units | 33 | 91.7% |
| Renter-Occupied Housing Units | 3 | 8.3% |
| Total Occupied Housing Units | 36 | 100.0% |
Occupancy by Household Size in Wiota
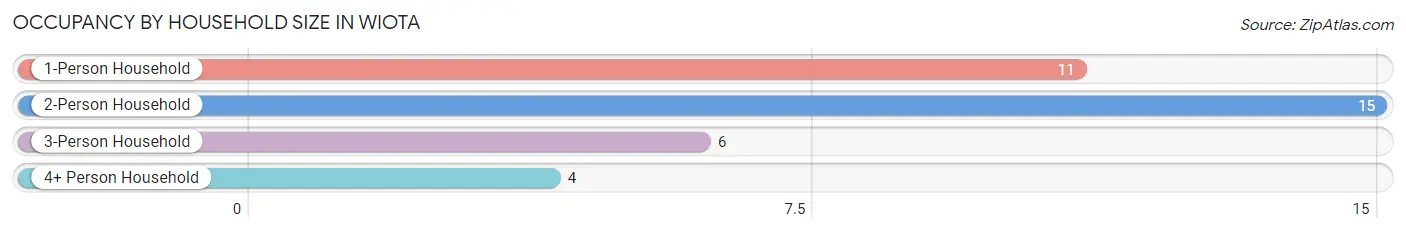
| Household Size | # Housing Units | % Housing Units |
| 1-Person Household | 11 | 30.6% |
| 2-Person Household | 15 | 41.7% |
| 3-Person Household | 6 | 16.7% |
| 4+ Person Household | 4 | 11.1% |
| Total Housing Units | 36 | 100.0% |
Occupancy by Ownership by Household Size in Wiota
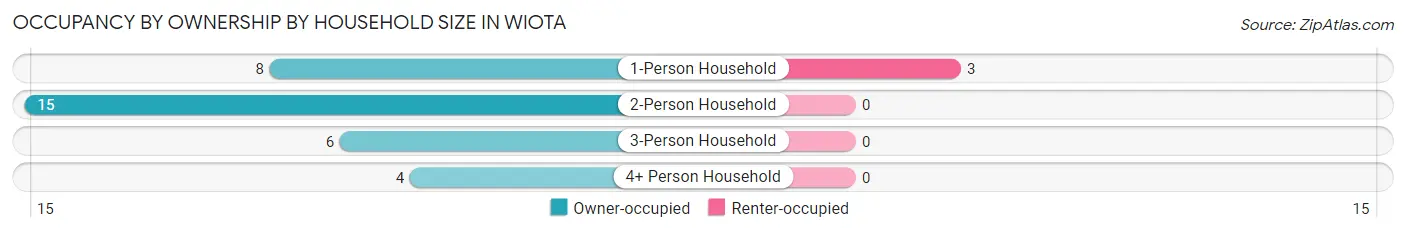
| Household Size | Owner-occupied | Renter-occupied |
| 1-Person Household | 8 (72.7%) | 3 (27.3%) |
| 2-Person Household | 15 (100.0%) | 0 (0.0%) |
| 3-Person Household | 6 (100.0%) | 0 (0.0%) |
| 4+ Person Household | 4 (100.0%) | 0 (0.0%) |
| Total Housing Units | 33 (91.7%) | 3 (8.3%) |
Occupancy by Educational Attainment in Wiota
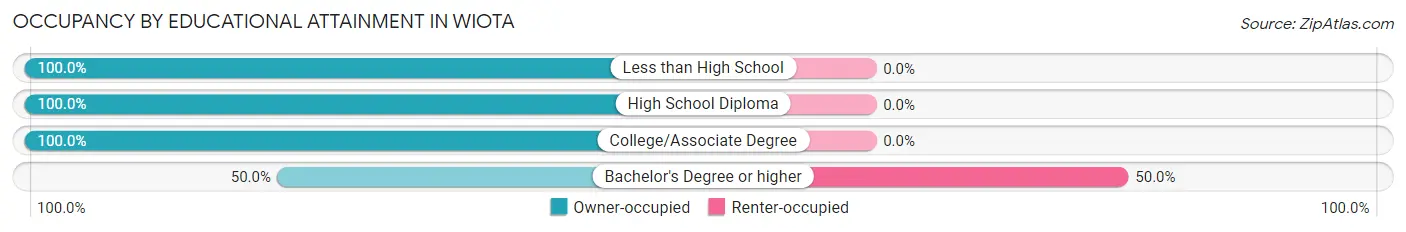
| Household Size | Owner-occupied | Renter-occupied |
| Less than High School | 7 (100.0%) | 0 (0.0%) |
| High School Diploma | 15 (100.0%) | 0 (0.0%) |
| College/Associate Degree | 8 (100.0%) | 0 (0.0%) |
| Bachelor's Degree or higher | 3 (50.0%) | 3 (50.0%) |
Occupancy by Age of Householder in Wiota
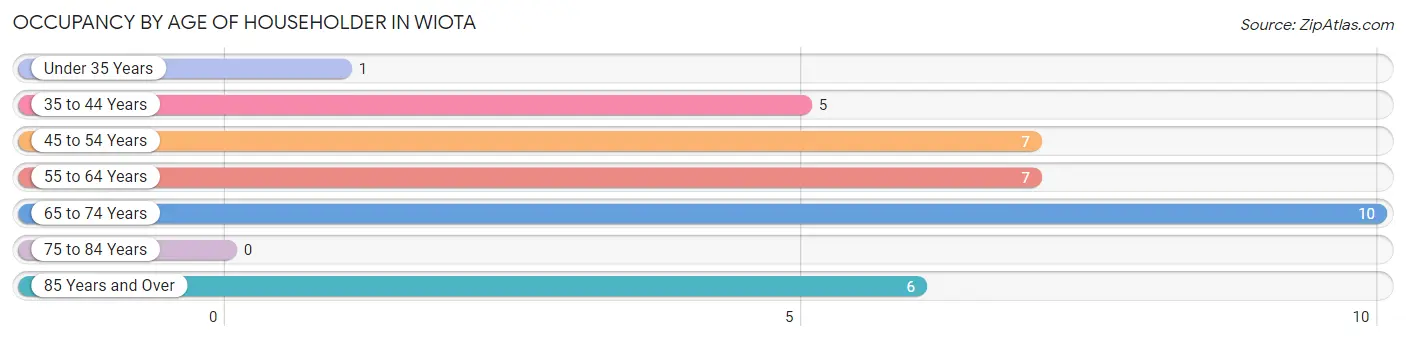
| Age Bracket | # Households | % Households |
| Under 35 Years | 1 | 2.8% |
| 35 to 44 Years | 5 | 13.9% |
| 45 to 54 Years | 7 | 19.4% |
| 55 to 64 Years | 7 | 19.4% |
| 65 to 74 Years | 10 | 27.8% |
| 75 to 84 Years | 0 | 0.0% |
| 85 Years and Over | 6 | 16.7% |
| Total | 36 | 100.0% |
Housing Finances in Wiota
Median Income by Occupancy in Wiota
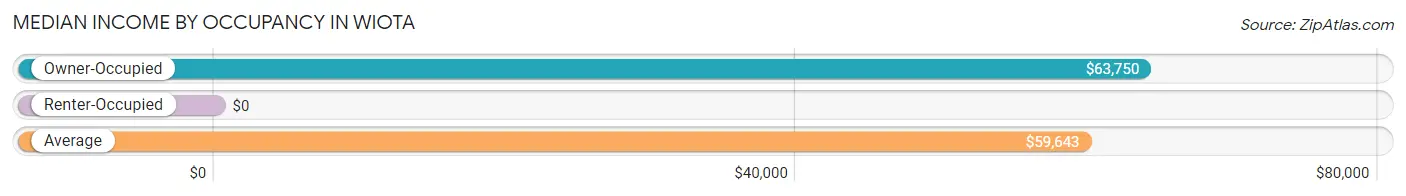
| Occupancy Type | # Households | Median Income |
| Owner-Occupied | 33 (91.7%) | $63,750 |
| Renter-Occupied | 3 (8.3%) | $0 |
| Average | 36 (100.0%) | $59,643 |
Occupancy by Householder Income Bracket in Wiota
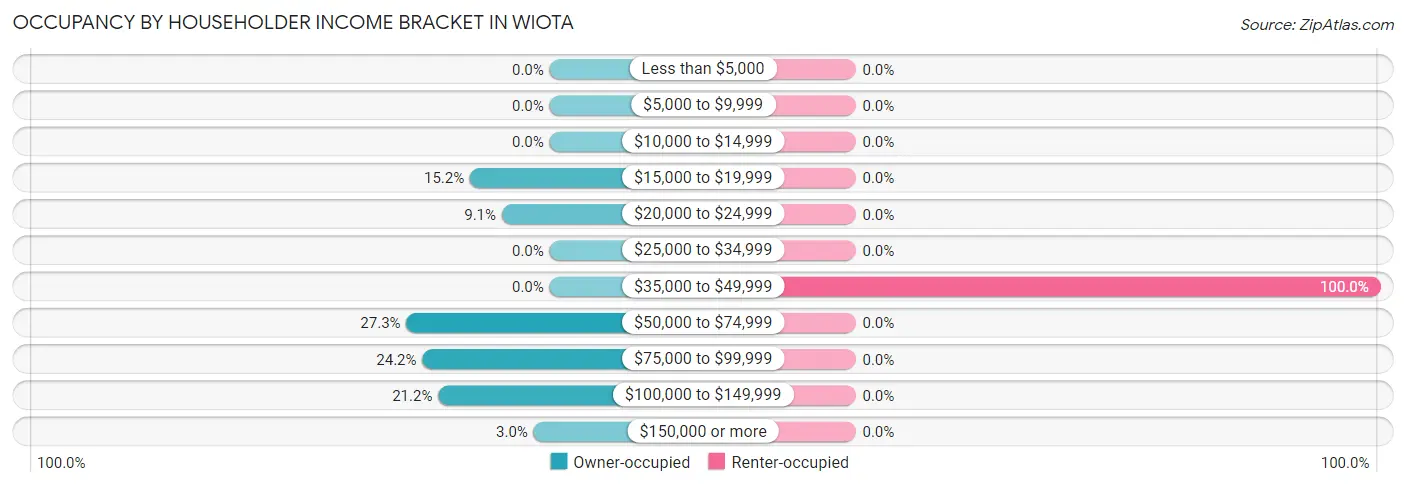
| Income Bracket | Owner-occupied | Renter-occupied |
| Less than $5,000 | 0 (0.0%) | 0 (0.0%) |
| $5,000 to $9,999 | 0 (0.0%) | 0 (0.0%) |
| $10,000 to $14,999 | 0 (0.0%) | 0 (0.0%) |
| $15,000 to $19,999 | 5 (15.1%) | 0 (0.0%) |
| $20,000 to $24,999 | 3 (9.1%) | 0 (0.0%) |
| $25,000 to $34,999 | 0 (0.0%) | 0 (0.0%) |
| $35,000 to $49,999 | 0 (0.0%) | 3 (100.0%) |
| $50,000 to $74,999 | 9 (27.3%) | 0 (0.0%) |
| $75,000 to $99,999 | 8 (24.2%) | 0 (0.0%) |
| $100,000 to $149,999 | 7 (21.2%) | 0 (0.0%) |
| $150,000 or more | 1 (3.0%) | 0 (0.0%) |
| Total | 33 (100.0%) | 3 (100.0%) |
Monthly Housing Cost Tiers in Wiota
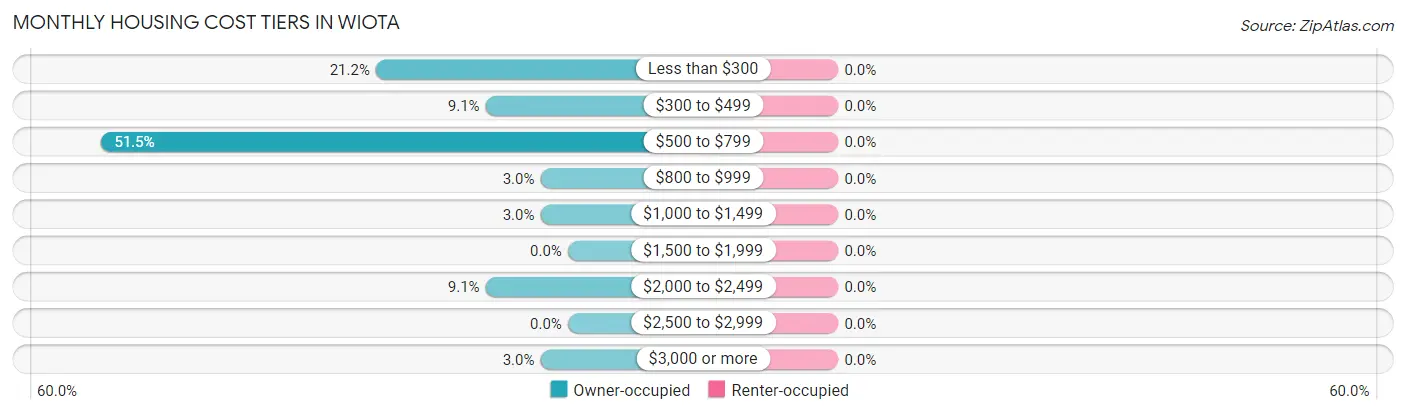
| Monthly Cost | Owner-occupied | Renter-occupied |
| Less than $300 | 7 (21.2%) | 0 (0.0%) |
| $300 to $499 | 3 (9.1%) | 0 (0.0%) |
| $500 to $799 | 17 (51.5%) | 0 (0.0%) |
| $800 to $999 | 1 (3.0%) | 0 (0.0%) |
| $1,000 to $1,499 | 1 (3.0%) | 0 (0.0%) |
| $1,500 to $1,999 | 0 (0.0%) | 0 (0.0%) |
| $2,000 to $2,499 | 3 (9.1%) | 0 (0.0%) |
| $2,500 to $2,999 | 0 (0.0%) | 0 (0.0%) |
| $3,000 or more | 1 (3.0%) | 0 (0.0%) |
| Total | 33 (100.0%) | 3 (100.0%) |
Physical Housing Characteristics in Wiota
Housing Structures in Wiota
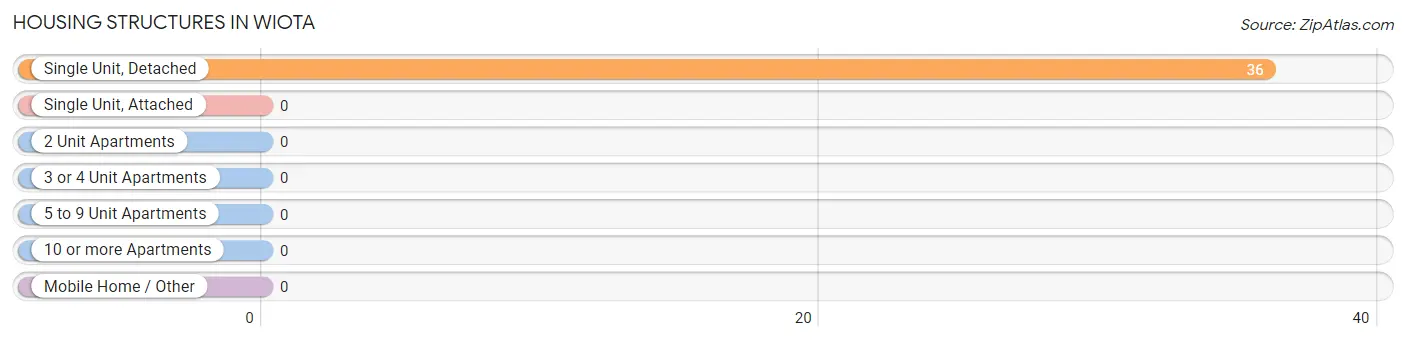
| Structure Type | # Housing Units | % Housing Units |
| Single Unit, Detached | 36 | 100.0% |
| Single Unit, Attached | 0 | 0.0% |
| 2 Unit Apartments | 0 | 0.0% |
| 3 or 4 Unit Apartments | 0 | 0.0% |
| 5 to 9 Unit Apartments | 0 | 0.0% |
| 10 or more Apartments | 0 | 0.0% |
| Mobile Home / Other | 0 | 0.0% |
| Total | 36 | 100.0% |
Housing Structures by Occupancy in Wiota
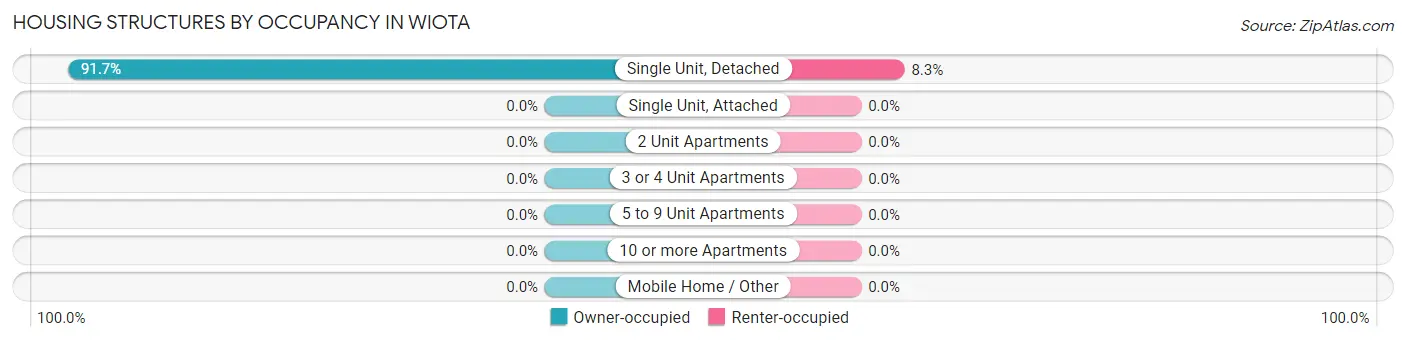
| Structure Type | Owner-occupied | Renter-occupied |
| Single Unit, Detached | 33 (91.7%) | 3 (8.3%) |
| Single Unit, Attached | 0 (0.0%) | 0 (0.0%) |
| 2 Unit Apartments | 0 (0.0%) | 0 (0.0%) |
| 3 or 4 Unit Apartments | 0 (0.0%) | 0 (0.0%) |
| 5 to 9 Unit Apartments | 0 (0.0%) | 0 (0.0%) |
| 10 or more Apartments | 0 (0.0%) | 0 (0.0%) |
| Mobile Home / Other | 0 (0.0%) | 0 (0.0%) |
| Total | 33 (91.7%) | 3 (8.3%) |
Housing Structures by Number of Rooms in Wiota
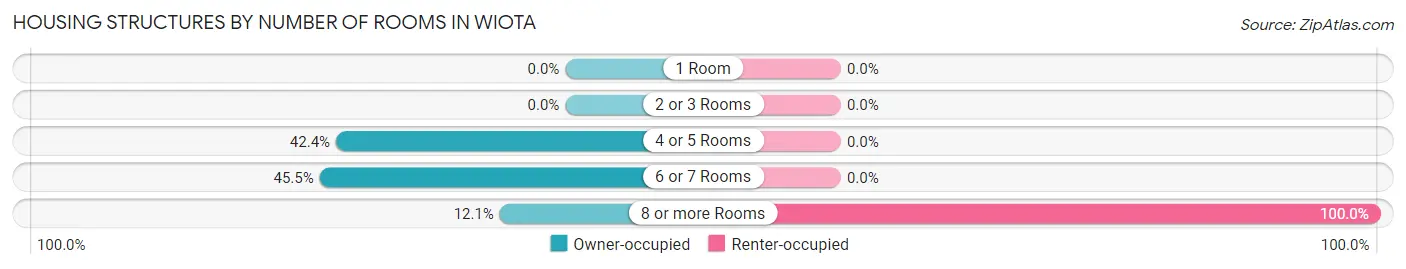
| Number of Rooms | Owner-occupied | Renter-occupied |
| 1 Room | 0 (0.0%) | 0 (0.0%) |
| 2 or 3 Rooms | 0 (0.0%) | 0 (0.0%) |
| 4 or 5 Rooms | 14 (42.4%) | 0 (0.0%) |
| 6 or 7 Rooms | 15 (45.5%) | 0 (0.0%) |
| 8 or more Rooms | 4 (12.1%) | 3 (100.0%) |
| Total | 33 (100.0%) | 3 (100.0%) |
Housing Structure by Heating Type in Wiota
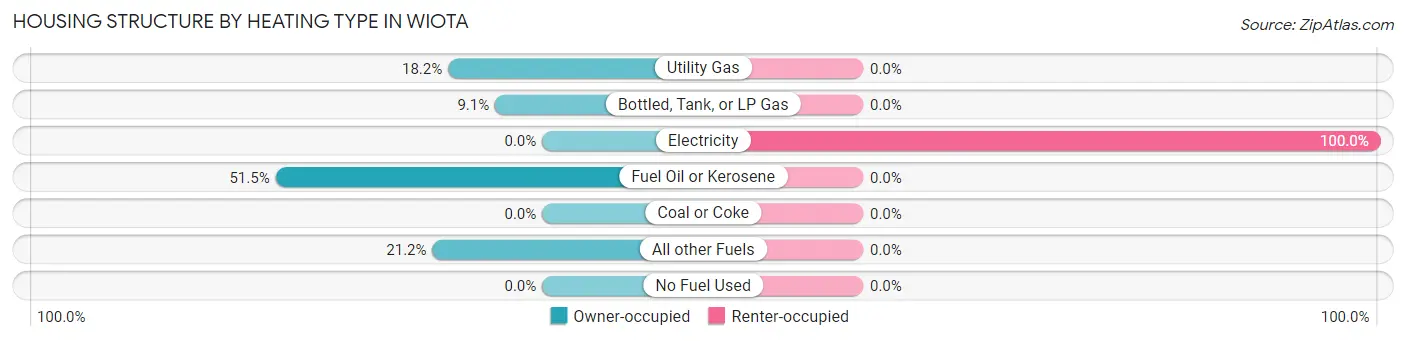
| Heating Type | Owner-occupied | Renter-occupied |
| Utility Gas | 6 (18.2%) | 0 (0.0%) |
| Bottled, Tank, or LP Gas | 3 (9.1%) | 0 (0.0%) |
| Electricity | 0 (0.0%) | 3 (100.0%) |
| Fuel Oil or Kerosene | 17 (51.5%) | 0 (0.0%) |
| Coal or Coke | 0 (0.0%) | 0 (0.0%) |
| All other Fuels | 7 (21.2%) | 0 (0.0%) |
| No Fuel Used | 0 (0.0%) | 0 (0.0%) |
| Total | 33 (100.0%) | 3 (100.0%) |
Household Vehicle Usage in Wiota
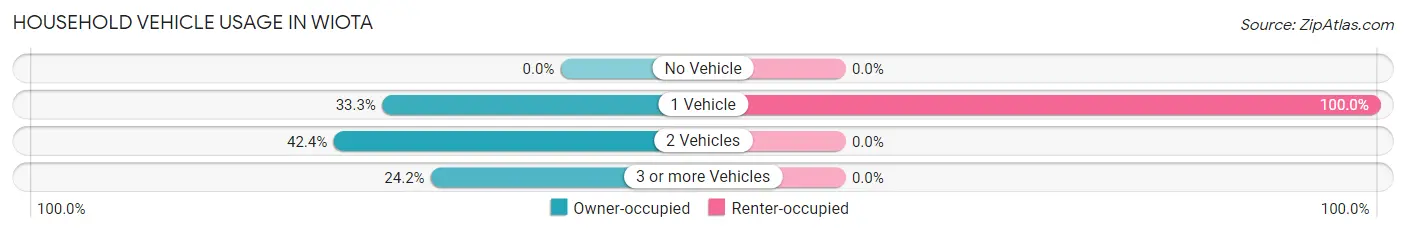
| Vehicles per Household | Owner-occupied | Renter-occupied |
| No Vehicle | 0 (0.0%) | 0 (0.0%) |
| 1 Vehicle | 11 (33.3%) | 3 (100.0%) |
| 2 Vehicles | 14 (42.4%) | 0 (0.0%) |
| 3 or more Vehicles | 8 (24.2%) | 0 (0.0%) |
| Total | 33 (100.0%) | 3 (100.0%) |
Real Estate & Mortgages in Wiota
Real Estate and Mortgage Overview in Wiota
| Characteristic | Without Mortgage | With Mortgage |
| Housing Units | 27 | 6 |
| Median Property Value | $124,000 | $333,300 |
| Median Household Income | $59,464 | $1 |
| Monthly Housing Costs | $558 | $1 |
| Real Estate Taxes | $1,750 | $0 |
Property Value by Mortgage Status in Wiota
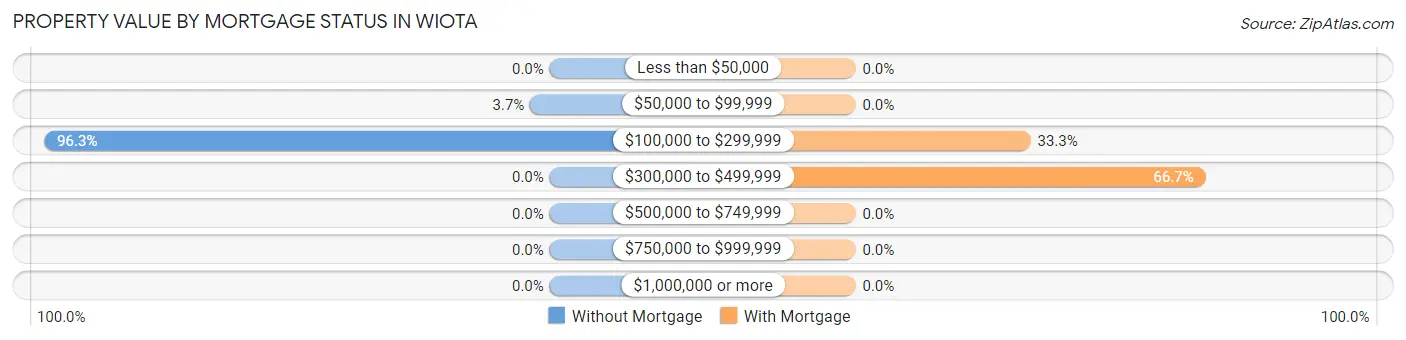
| Property Value | Without Mortgage | With Mortgage |
| Less than $50,000 | 0 (0.0%) | 0 (0.0%) |
| $50,000 to $99,999 | 1 (3.7%) | 0 (0.0%) |
| $100,000 to $299,999 | 26 (96.3%) | 2 (33.3%) |
| $300,000 to $499,999 | 0 (0.0%) | 4 (66.7%) |
| $500,000 to $749,999 | 0 (0.0%) | 0 (0.0%) |
| $750,000 to $999,999 | 0 (0.0%) | 0 (0.0%) |
| $1,000,000 or more | 0 (0.0%) | 0 (0.0%) |
| Total | 27 (100.0%) | 6 (100.0%) |
Household Income by Mortgage Status in Wiota
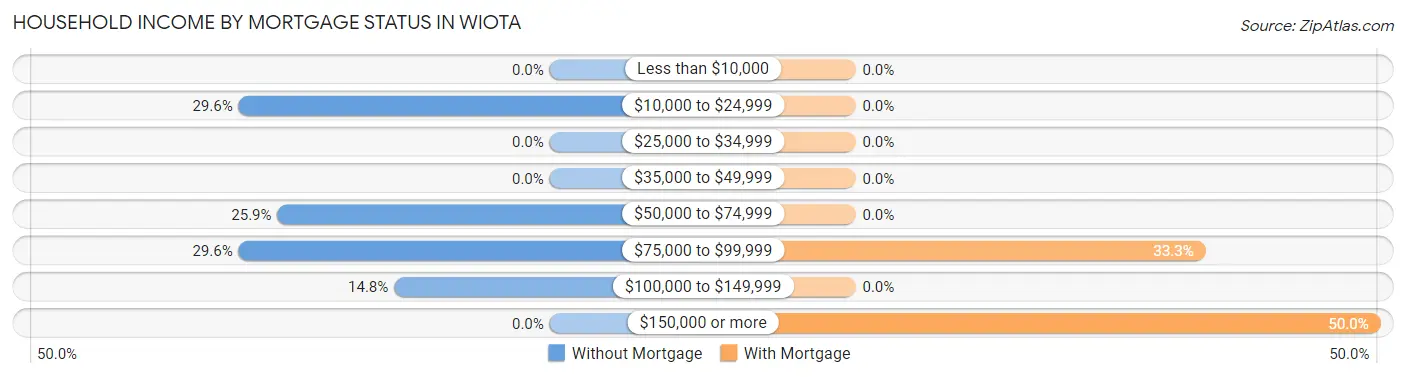
| Household Income | Without Mortgage | With Mortgage |
| Less than $10,000 | 0 (0.0%) | 0 (0.0%) |
| $10,000 to $24,999 | 8 (29.6%) | 0 (0.0%) |
| $25,000 to $34,999 | 0 (0.0%) | 0 (0.0%) |
| $35,000 to $49,999 | 0 (0.0%) | 0 (0.0%) |
| $50,000 to $74,999 | 7 (25.9%) | 0 (0.0%) |
| $75,000 to $99,999 | 8 (29.6%) | 2 (33.3%) |
| $100,000 to $149,999 | 4 (14.8%) | 0 (0.0%) |
| $150,000 or more | 0 (0.0%) | 3 (50.0%) |
| Total | 27 (100.0%) | 6 (100.0%) |
Property Value to Household Income Ratio in Wiota
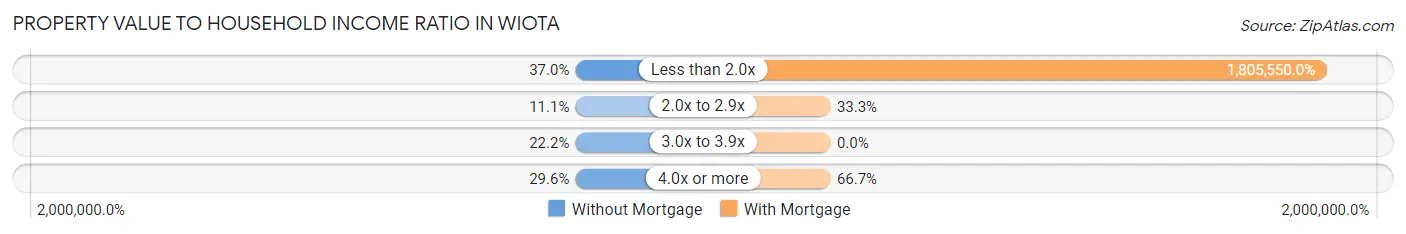
| Value-to-Income Ratio | Without Mortgage | With Mortgage |
| Less than 2.0x | 10 (37.0%) | 108,333 (1,805,550.0%) |
| 2.0x to 2.9x | 3 (11.1%) | 2 (33.3%) |
| 3.0x to 3.9x | 6 (22.2%) | 0 (0.0%) |
| 4.0x or more | 8 (29.6%) | 4 (66.7%) |
| Total | 27 (100.0%) | 6 (100.0%) |
Real Estate Taxes by Mortgage Status in Wiota
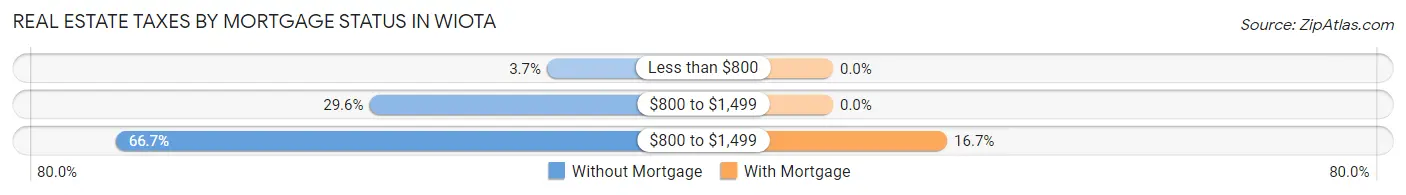
| Property Taxes | Without Mortgage | With Mortgage |
| Less than $800 | 1 (3.7%) | 0 (0.0%) |
| $800 to $1,499 | 8 (29.6%) | 0 (0.0%) |
| $800 to $1,499 | 18 (66.7%) | 1 (16.7%) |
| Total | 27 (100.0%) | 6 (100.0%) |
Health & Disability in Wiota
Health Insurance Coverage by Age in Wiota
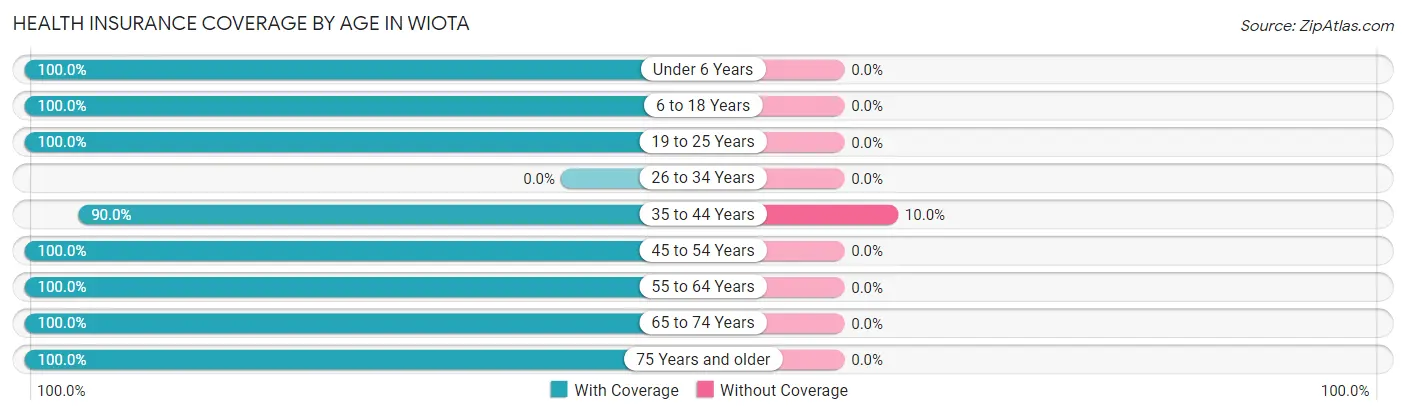
| Age Bracket | With Coverage | Without Coverage |
| Under 6 Years | 3 (100.0%) | 0 (0.0%) |
| 6 to 18 Years | 14 (100.0%) | 0 (0.0%) |
| 19 to 25 Years | 1 (100.0%) | 0 (0.0%) |
| 26 to 34 Years | 0 (0.0%) | 0 (0.0%) |
| 35 to 44 Years | 9 (90.0%) | 1 (10.0%) |
| 45 to 54 Years | 9 (100.0%) | 0 (0.0%) |
| 55 to 64 Years | 16 (100.0%) | 0 (0.0%) |
| 65 to 74 Years | 12 (100.0%) | 0 (0.0%) |
| 75 Years and older | 18 (100.0%) | 0 (0.0%) |
| Total | 82 (98.8%) | 1 (1.2%) |
Health Insurance Coverage by Citizenship Status in Wiota
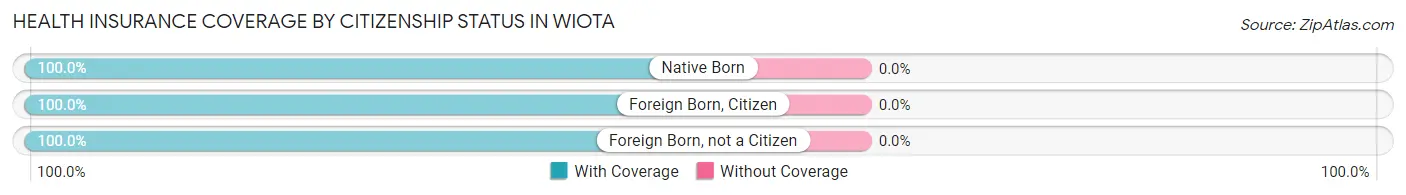
| Citizenship Status | With Coverage | Without Coverage |
| Native Born | 3 (100.0%) | 0 (0.0%) |
| Foreign Born, Citizen | 14 (100.0%) | 0 (0.0%) |
| Foreign Born, not a Citizen | 1 (100.0%) | 0 (0.0%) |
Health Insurance Coverage by Household Income in Wiota
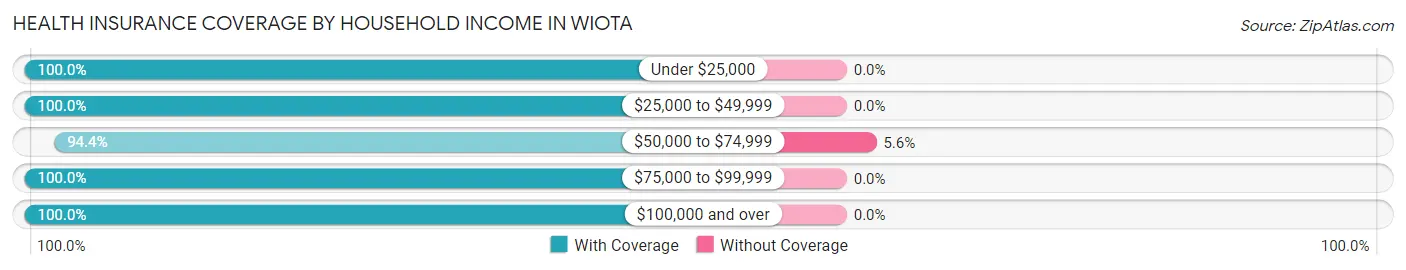
| Household Income | With Coverage | Without Coverage |
| Under $25,000 | 15 (100.0%) | 0 (0.0%) |
| $25,000 to $49,999 | 3 (100.0%) | 0 (0.0%) |
| $50,000 to $74,999 | 17 (94.4%) | 1 (5.6%) |
| $75,000 to $99,999 | 28 (100.0%) | 0 (0.0%) |
| $100,000 and over | 19 (100.0%) | 0 (0.0%) |
Public vs Private Health Insurance Coverage by Age in Wiota
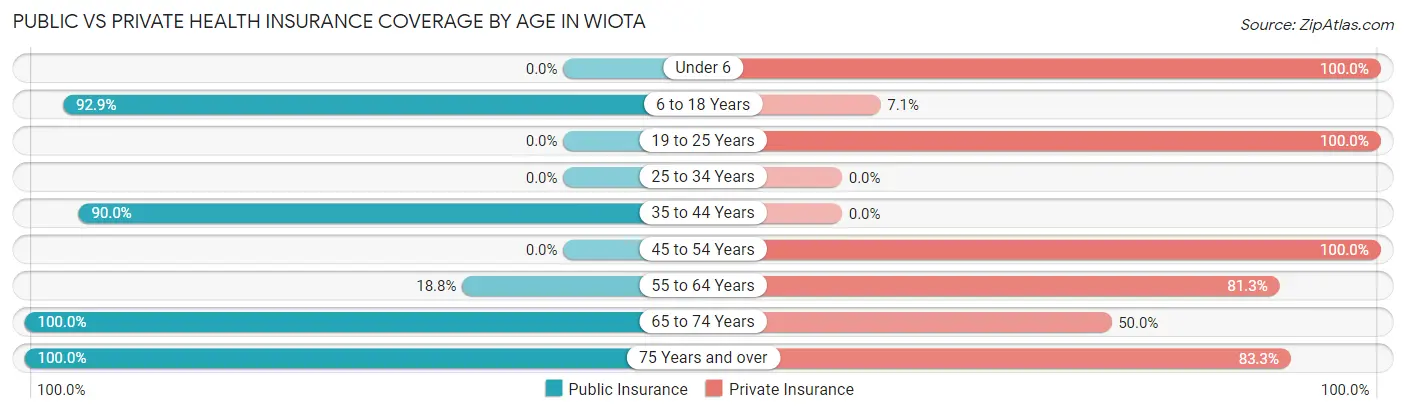
| Age Bracket | Public Insurance | Private Insurance |
| Under 6 | 0 (0.0%) | 3 (100.0%) |
| 6 to 18 Years | 13 (92.9%) | 1 (7.1%) |
| 19 to 25 Years | 0 (0.0%) | 1 (100.0%) |
| 25 to 34 Years | 0 (0.0%) | 0 (0.0%) |
| 35 to 44 Years | 9 (90.0%) | 0 (0.0%) |
| 45 to 54 Years | 0 (0.0%) | 9 (100.0%) |
| 55 to 64 Years | 3 (18.8%) | 13 (81.2%) |
| 65 to 74 Years | 12 (100.0%) | 6 (50.0%) |
| 75 Years and over | 18 (100.0%) | 15 (83.3%) |
| Total | 55 (66.3%) | 48 (57.8%) |
Disability Status by Sex by Age in Wiota
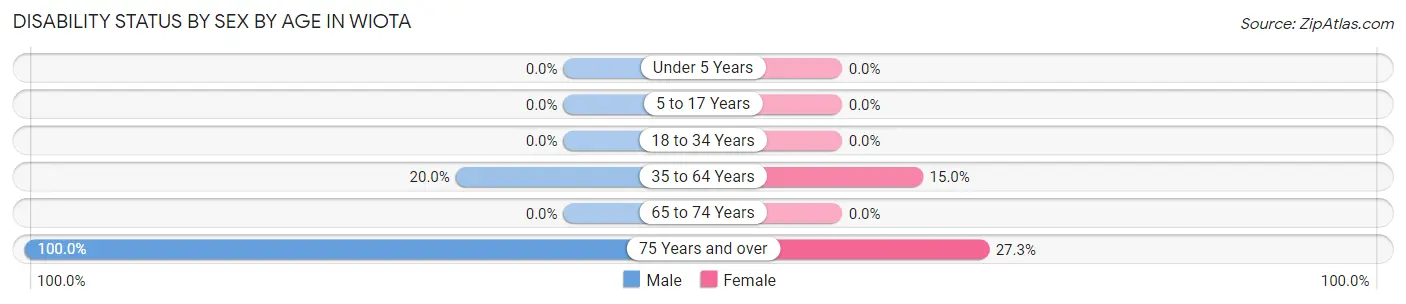
| Age Bracket | Male | Female |
| Under 5 Years | 0 (0.0%) | 0 (0.0%) |
| 5 to 17 Years | 0 (0.0%) | 0 (0.0%) |
| 18 to 34 Years | 0 (0.0%) | 0 (0.0%) |
| 35 to 64 Years | 3 (20.0%) | 3 (15.0%) |
| 65 to 74 Years | 0 (0.0%) | 0 (0.0%) |
| 75 Years and over | 7 (100.0%) | 3 (27.3%) |
Disability Class by Sex by Age in Wiota
Disability Class: Hearing Difficulty
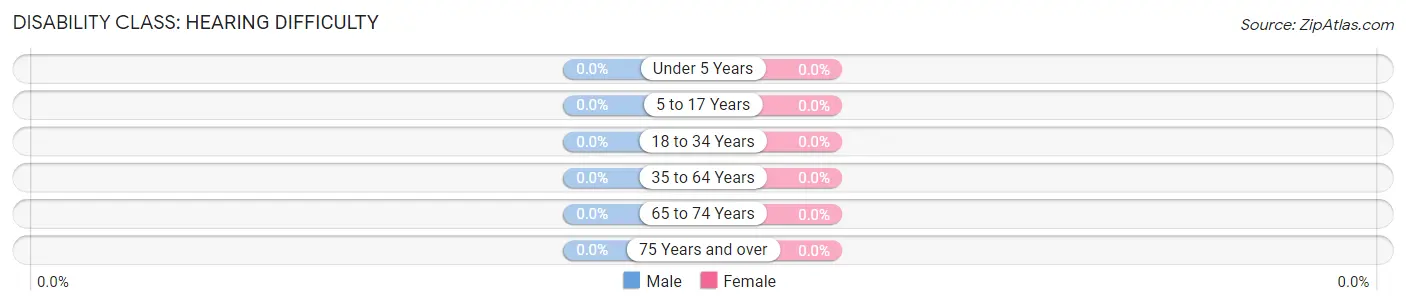
| Age Bracket | Male | Female |
| Under 5 Years | 0 (0.0%) | 0 (0.0%) |
| 5 to 17 Years | 0 (0.0%) | 0 (0.0%) |
| 18 to 34 Years | 0 (0.0%) | 0 (0.0%) |
| 35 to 64 Years | 0 (0.0%) | 0 (0.0%) |
| 65 to 74 Years | 0 (0.0%) | 0 (0.0%) |
| 75 Years and over | 0 (0.0%) | 0 (0.0%) |
Disability Class: Vision Difficulty
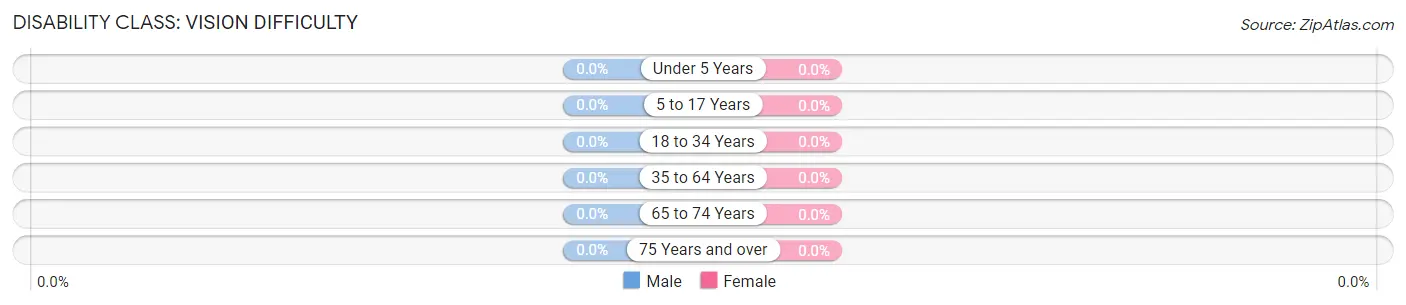
| Age Bracket | Male | Female |
| Under 5 Years | 0 (0.0%) | 0 (0.0%) |
| 5 to 17 Years | 0 (0.0%) | 0 (0.0%) |
| 18 to 34 Years | 0 (0.0%) | 0 (0.0%) |
| 35 to 64 Years | 0 (0.0%) | 0 (0.0%) |
| 65 to 74 Years | 0 (0.0%) | 0 (0.0%) |
| 75 Years and over | 0 (0.0%) | 0 (0.0%) |
Disability Class: Cognitive Difficulty
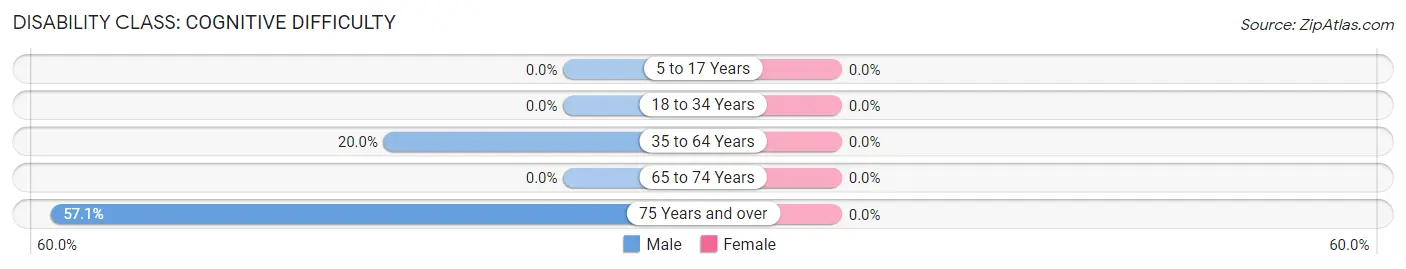
| Age Bracket | Male | Female |
| 5 to 17 Years | 0 (0.0%) | 0 (0.0%) |
| 18 to 34 Years | 0 (0.0%) | 0 (0.0%) |
| 35 to 64 Years | 3 (20.0%) | 0 (0.0%) |
| 65 to 74 Years | 0 (0.0%) | 0 (0.0%) |
| 75 Years and over | 4 (57.1%) | 0 (0.0%) |
Disability Class: Ambulatory Difficulty
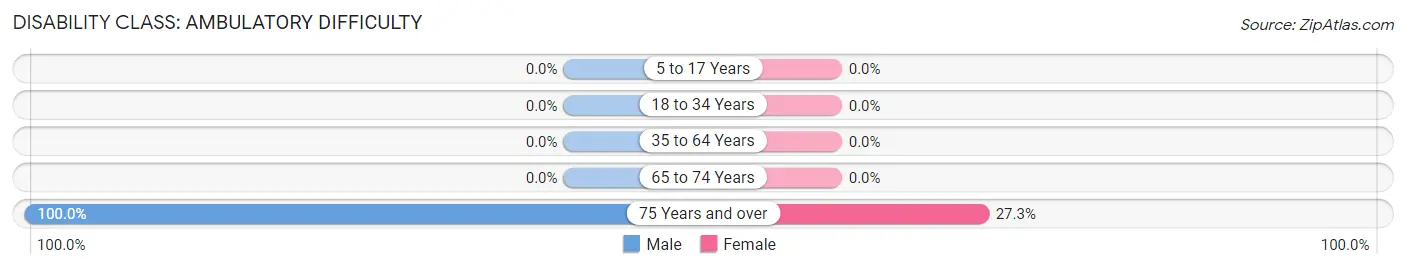
| Age Bracket | Male | Female |
| 5 to 17 Years | 0 (0.0%) | 0 (0.0%) |
| 18 to 34 Years | 0 (0.0%) | 0 (0.0%) |
| 35 to 64 Years | 0 (0.0%) | 0 (0.0%) |
| 65 to 74 Years | 0 (0.0%) | 0 (0.0%) |
| 75 Years and over | 7 (100.0%) | 3 (27.3%) |
Disability Class: Self-Care Difficulty
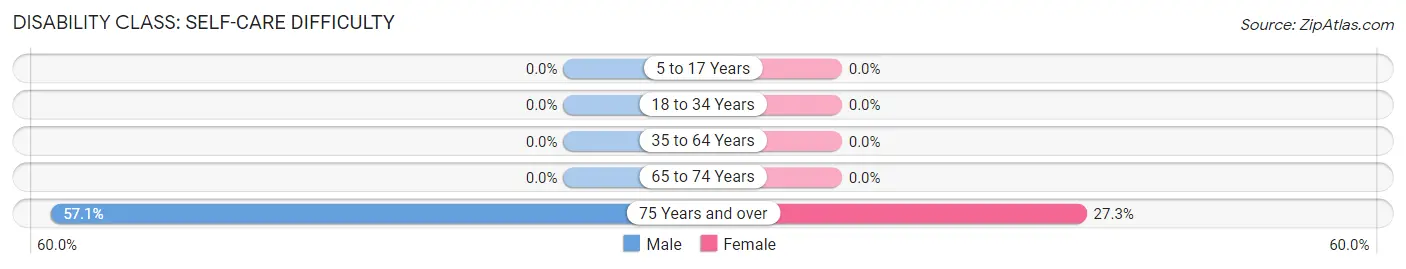
| Age Bracket | Male | Female |
| 5 to 17 Years | 0 (0.0%) | 0 (0.0%) |
| 18 to 34 Years | 0 (0.0%) | 0 (0.0%) |
| 35 to 64 Years | 0 (0.0%) | 0 (0.0%) |
| 65 to 74 Years | 0 (0.0%) | 0 (0.0%) |
| 75 Years and over | 4 (57.1%) | 3 (27.3%) |
Technology Access in Wiota
Computing Device Access in Wiota
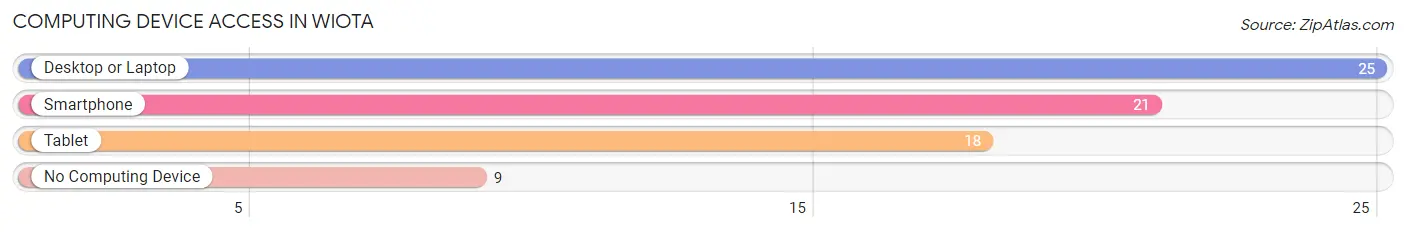
| Device Type | # Households | % Households |
| Desktop or Laptop | 25 | 69.4% |
| Smartphone | 21 | 58.3% |
| Tablet | 18 | 50.0% |
| No Computing Device | 9 | 25.0% |
| Total | 36 | 100.0% |
Internet Access in Wiota
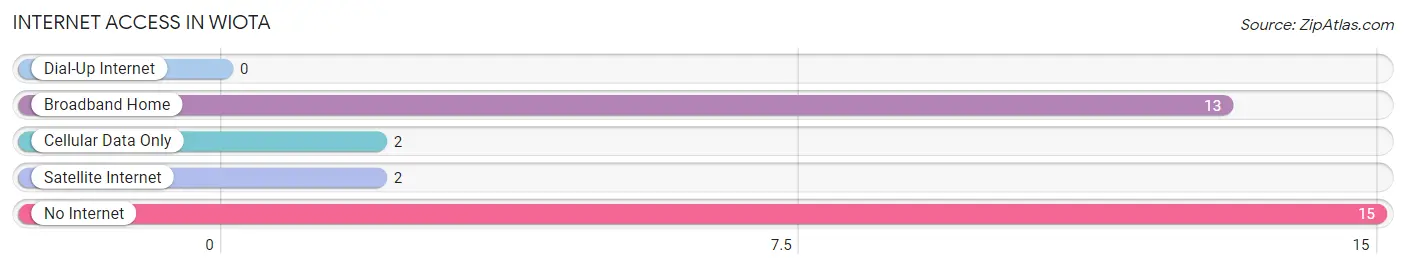
| Internet Type | # Households | % Households |
| Dial-Up Internet | 0 | 0.0% |
| Broadband Home | 13 | 36.1% |
| Cellular Data Only | 2 | 5.6% |
| Satellite Internet | 2 | 5.6% |
| No Internet | 15 | 41.7% |
| Total | 36 | 100.0% |
Wiota Summary
Wiota is a small town located in Lafayette County, Wisconsin. It is situated in the southwestern part of the state, about 25 miles east of the Mississippi River. The town has a population of about 500 people and is part of the larger Lafayette County. Wiota is a rural community with a strong agricultural base.
Geography
Wiota is located in the southwestern part of Wisconsin, about 25 miles east of the Mississippi River. The town is situated in the rolling hills of the Driftless Area, which is characterized by its steep hills and valleys. The town is surrounded by farmland and is located near the Wisconsin River. The town is also close to the city of Darlington, which is the county seat of Lafayette County.
The town of Wiota is located at an elevation of 890 feet above sea level. The town is located in the Central Standard Time Zone and observes Daylight Saving Time. The town has a total area of 0.8 square miles, all of which is land.
History
The town of Wiota was founded in 1845 by settlers from New York. The town was named after the nearby Wisconsin River, which was named after the Native American tribe that lived in the area. The town was originally a farming community and was known for its dairy farms.
In the late 19th century, the town began to grow and develop. The town was incorporated in 1891 and the first post office was established in 1892. The town also had a school, a church, and a general store.
In the early 20th century, the town began to decline as the population began to move away. The town was hit hard by the Great Depression and many of the businesses in the town closed. The town was also affected by the Dust Bowl of the 1930s.
Economy
The economy of Wiota is largely based on agriculture. The town is home to several dairy farms and other agricultural businesses. The town also has a few small businesses, including a gas station, a grocery store, and a few restaurants.
The town is also home to a few small manufacturing businesses. The town is home to a few small businesses that produce wood products, such as furniture and cabinets.
Demographics
The population of Wiota was estimated to be 500 in 2020. The town has a median age of 44.7 years and a median household income of $50,000. The town is predominantly white, with 95.2% of the population identifying as white. The town also has a small Hispanic population, with 4.8% of the population identifying as Hispanic or Latino.
The town has a low unemployment rate of 3.2%. The town also has a low poverty rate of 8.2%. The town has a high rate of homeownership, with 81.2% of the population owning their own homes.
Conclusion
Wiota is a small town located in Lafayette County, Wisconsin. The town has a population of about 500 people and is part of the larger Lafayette County. Wiota is a rural community with a strong agricultural base. The town has a median age of 44.7 years and a median household income of $50,000. The town is predominantly white, with 95.2% of the population identifying as white. The town also has a low unemployment rate of 3.2% and a low poverty rate of 8.2%. The town has a high rate of homeownership, with 81.2% of the population owning their own homes. Wiota is a small town with a strong agricultural base and a rich history.
Common Questions
What is Per Capita Income in Wiota?
Per Capita income in Wiota is $35,112.
What is the Median Family Income in Wiota?
Median Family Income in Wiota is $87,813.
What is the Median Household income in Wiota?
Median Household Income in Wiota is $59,643.
What is Income or Wage Gap in Wiota?
Income or Wage Gap in Wiota is 26.1%.
Women in Wiota earn 73.9 cents for every dollar earned by a man.
What is Inequality or Gini Index in Wiota?
Inequality or Gini Index in Wiota is 0.36.
What is the Total Population of Wiota?
Total Population of Wiota is 83.
What is the Total Male Population of Wiota?
Total Male Population of Wiota is 37.
What is the Total Female Population of Wiota?
Total Female Population of Wiota is 46.
What is the Ratio of Males per 100 Females in Wiota?
There are 80.43 Males per 100 Females in Wiota.
What is the Ratio of Females per 100 Males in Wiota?
There are 124.32 Females per 100 Males in Wiota.
What is the Median Population Age in Wiota?
Median Population Age in Wiota is 59.2 Years.
What is the Average Family Size in Wiota
Average Family Size in Wiota is 2.8 People.
What is the Average Household Size in Wiota
Average Household Size in Wiota is 2.3 People.
How Large is the Labor Force in Wiota?
There are 29 People in the Labor Forcein in Wiota.
What is the Percentage of People in the Labor Force in Wiota?
40.3% of People are in the Labor Force in Wiota.