Sudanese vs Malaysian 2 or more Vehicles in Household
COMPARE
Sudanese
Malaysian
2 or more Vehicles in Household
2 or more Vehicles in Household Comparison
Sudanese
Malaysians
53.6%
2 OR MORE VEHICLES IN HOUSEHOLD
4.1/ 100
METRIC RATING
227th/ 347
METRIC RANK
59.8%
2 OR MORE VEHICLES IN HOUSEHOLD
100.0/ 100
METRIC RATING
42nd/ 347
METRIC RANK
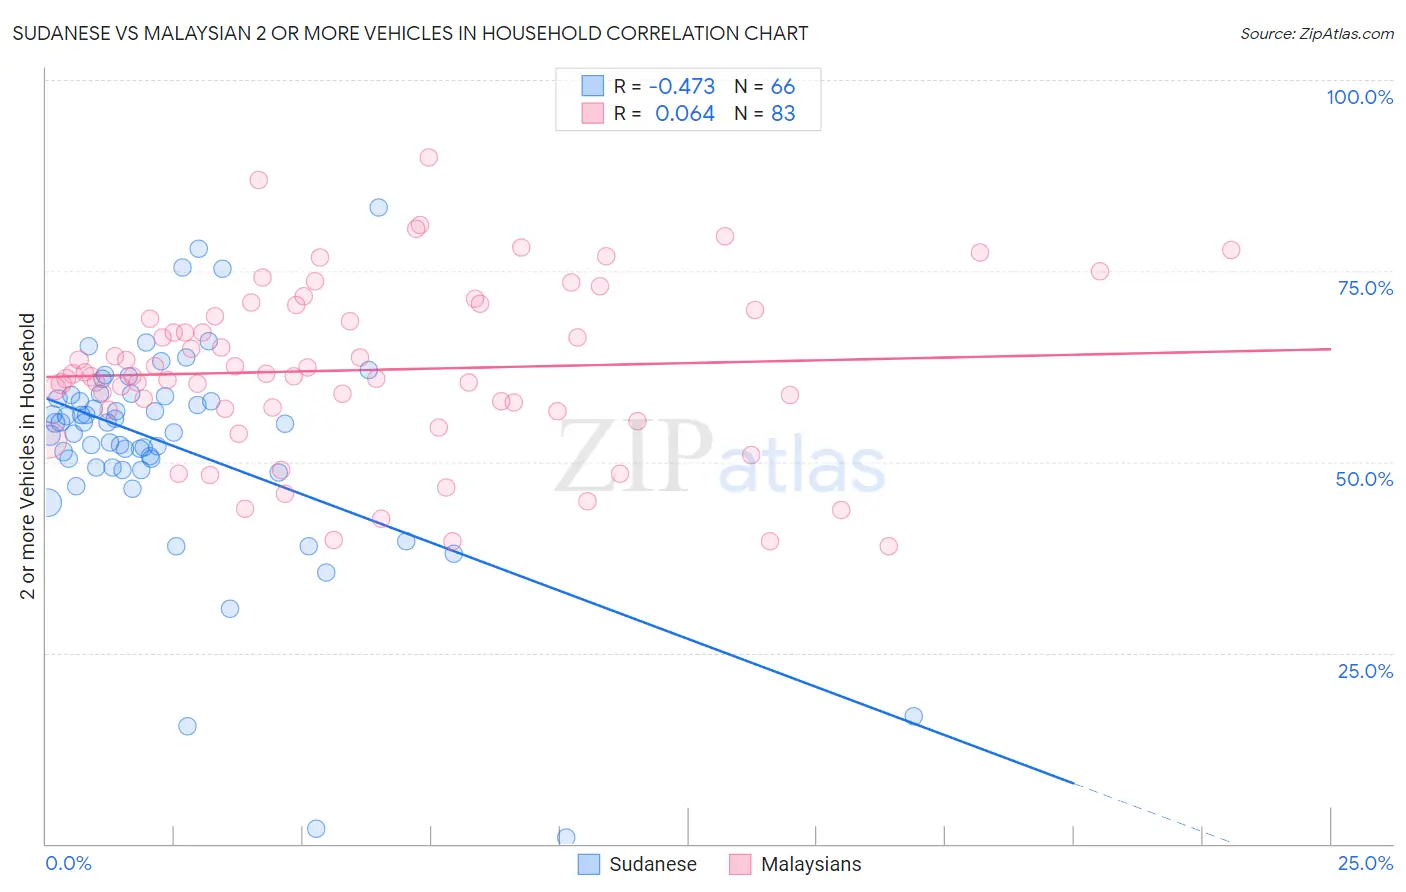
Sudanese vs Malaysian 2 or more Vehicles in Household Correlation Chart
The statistical analysis conducted on geographies consisting of 110,122,172 people shows a moderate negative correlation between the proportion of Sudanese and percentage of households with 2 or more vehicles available in the United States with a correlation coefficient (R) of -0.473 and weighted average of 53.6%. Similarly, the statistical analysis conducted on geographies consisting of 226,018,172 people shows a slight positive correlation between the proportion of Malaysians and percentage of households with 2 or more vehicles available in the United States with a correlation coefficient (R) of 0.064 and weighted average of 59.8%, a difference of 11.6%.
2 or more Vehicles in Household Correlation Summary
| Measurement | Sudanese | Malaysian |
| Minimum | 0.83% | 38.9% |
| Maximum | 83.4% | 89.8% |
| Range | 82.5% | 51.0% |
| Mean | 52.1% | 62.0% |
| Median | 55.1% | 61.3% |
| Interquartile 25% (IQ1) | 49.2% | 56.8% |
| Interquartile 75% (IQ3) | 58.6% | 69.9% |
| Interquartile Range (IQR) | 9.4% | 13.1% |
| Standard Deviation (Sample) | 14.5% | 11.2% |
| Standard Deviation (Population) | 14.4% | 11.1% |
Similar Demographics by 2 or more Vehicles in Household
Demographics Similar to Sudanese by 2 or more Vehicles in Household
In terms of 2 or more vehicles in household, the demographic groups most similar to Sudanese are Alaska Native (53.6%, a difference of 0.060%), Immigrants from Turkey (53.6%, a difference of 0.080%), Immigrants from Nepal (53.5%, a difference of 0.14%), Panamanian (53.5%, a difference of 0.19%), and Immigrants from Eastern Africa (53.7%, a difference of 0.24%).
| Demographics | Rating | Rank | 2 or more Vehicles in Household |
| Taiwanese | 6.3 /100 | #220 | Tragic 53.9% |
| Immigrants | Singapore | 6.3 /100 | #221 | Tragic 53.9% |
| Kiowa | 6.2 /100 | #222 | Tragic 53.9% |
| Immigrants | Bosnia and Herzegovina | 5.5 /100 | #223 | Tragic 53.8% |
| Brazilians | 5.3 /100 | #224 | Tragic 53.8% |
| Immigrants | Egypt | 5.2 /100 | #225 | Tragic 53.8% |
| Immigrants | Eastern Africa | 5.1 /100 | #226 | Tragic 53.7% |
| Sudanese | 4.1 /100 | #227 | Tragic 53.6% |
| Alaska Natives | 3.9 /100 | #228 | Tragic 53.6% |
| Immigrants | Turkey | 3.8 /100 | #229 | Tragic 53.6% |
| Immigrants | Nepal | 3.6 /100 | #230 | Tragic 53.5% |
| Panamanians | 3.4 /100 | #231 | Tragic 53.5% |
| Immigrants | Guatemala | 3.2 /100 | #232 | Tragic 53.5% |
| Ugandans | 3.2 /100 | #233 | Tragic 53.5% |
| Immigrants | Switzerland | 3.0 /100 | #234 | Tragic 53.4% |
Demographics Similar to Malaysians by 2 or more Vehicles in Household
In terms of 2 or more vehicles in household, the demographic groups most similar to Malaysians are Northern European (59.9%, a difference of 0.010%), Cherokee (59.9%, a difference of 0.030%), Czechoslovakian (59.8%, a difference of 0.080%), French (59.8%, a difference of 0.14%), and Immigrants from Taiwan (59.7%, a difference of 0.18%).
| Demographics | Rating | Rank | 2 or more Vehicles in Household |
| Immigrants | Philippines | 100.0 /100 | #35 | Exceptional 60.1% |
| Chinese | 100.0 /100 | #36 | Exceptional 60.1% |
| Irish | 100.0 /100 | #37 | Exceptional 60.1% |
| Americans | 100.0 /100 | #38 | Exceptional 60.0% |
| British | 100.0 /100 | #39 | Exceptional 60.0% |
| Cherokee | 100.0 /100 | #40 | Exceptional 59.9% |
| Northern Europeans | 100.0 /100 | #41 | Exceptional 59.9% |
| Malaysians | 100.0 /100 | #42 | Exceptional 59.8% |
| Czechoslovakians | 100.0 /100 | #43 | Exceptional 59.8% |
| French | 100.0 /100 | #44 | Exceptional 59.8% |
| Immigrants | Taiwan | 100.0 /100 | #45 | Exceptional 59.7% |
| Immigrants | South Eastern Asia | 100.0 /100 | #46 | Exceptional 59.6% |
| Yaqui | 99.9 /100 | #47 | Exceptional 59.3% |
| Immigrants | India | 99.9 /100 | #48 | Exceptional 59.3% |
| Belgians | 99.9 /100 | #49 | Exceptional 59.3% |