Sudanese vs Immigrants from Latin America 2 or more Vehicles in Household
COMPARE
Sudanese
Immigrants from Latin America
2 or more Vehicles in Household
2 or more Vehicles in Household Comparison
Sudanese
Immigrants from Latin America
53.6%
2 OR MORE VEHICLES IN HOUSEHOLD
4.1/ 100
METRIC RATING
227th/ 347
METRIC RANK
54.3%
2 OR MORE VEHICLES IN HOUSEHOLD
13.1/ 100
METRIC RATING
206th/ 347
METRIC RANK
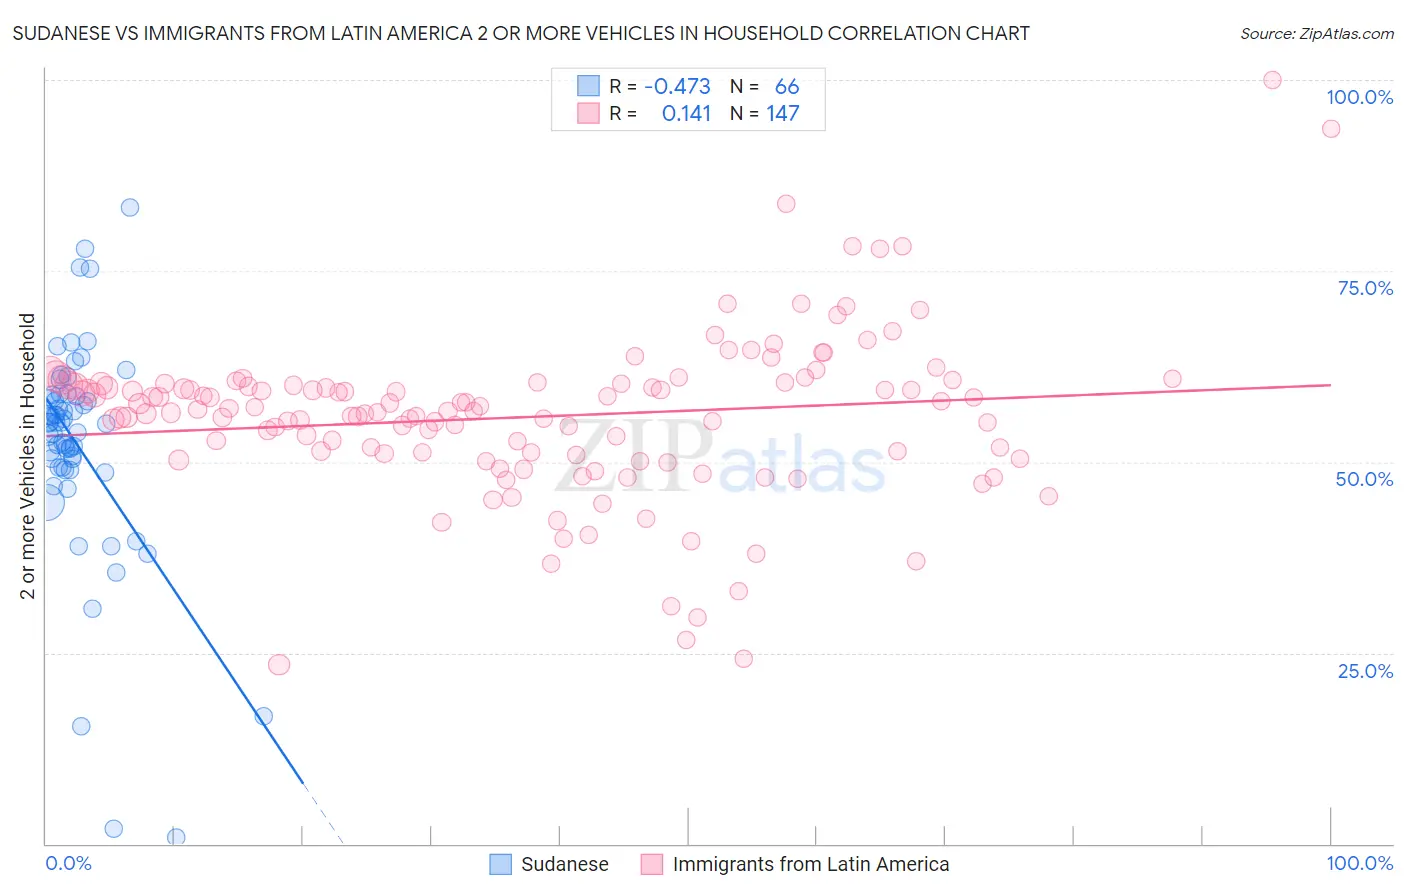
Sudanese vs Immigrants from Latin America 2 or more Vehicles in Household Correlation Chart
The statistical analysis conducted on geographies consisting of 110,122,172 people shows a moderate negative correlation between the proportion of Sudanese and percentage of households with 2 or more vehicles available in the United States with a correlation coefficient (R) of -0.473 and weighted average of 53.6%. Similarly, the statistical analysis conducted on geographies consisting of 558,094,451 people shows a poor positive correlation between the proportion of Immigrants from Latin America and percentage of households with 2 or more vehicles available in the United States with a correlation coefficient (R) of 0.141 and weighted average of 54.3%, a difference of 1.3%.
2 or more Vehicles in Household Correlation Summary
| Measurement | Sudanese | Immigrants from Latin America |
| Minimum | 0.83% | 23.4% |
| Maximum | 83.4% | 100.0% |
| Range | 82.5% | 76.6% |
| Mean | 52.1% | 55.9% |
| Median | 55.1% | 56.7% |
| Interquartile 25% (IQ1) | 49.2% | 51.1% |
| Interquartile 75% (IQ3) | 58.6% | 60.2% |
| Interquartile Range (IQR) | 9.4% | 9.1% |
| Standard Deviation (Sample) | 14.5% | 10.8% |
| Standard Deviation (Population) | 14.4% | 10.7% |
Similar Demographics by 2 or more Vehicles in Household
Demographics Similar to Sudanese by 2 or more Vehicles in Household
In terms of 2 or more vehicles in household, the demographic groups most similar to Sudanese are Alaska Native (53.6%, a difference of 0.060%), Immigrants from Turkey (53.6%, a difference of 0.080%), Immigrants from Nepal (53.5%, a difference of 0.14%), Panamanian (53.5%, a difference of 0.19%), and Immigrants from Eastern Africa (53.7%, a difference of 0.24%).
| Demographics | Rating | Rank | 2 or more Vehicles in Household |
| Taiwanese | 6.3 /100 | #220 | Tragic 53.9% |
| Immigrants | Singapore | 6.3 /100 | #221 | Tragic 53.9% |
| Kiowa | 6.2 /100 | #222 | Tragic 53.9% |
| Immigrants | Bosnia and Herzegovina | 5.5 /100 | #223 | Tragic 53.8% |
| Brazilians | 5.3 /100 | #224 | Tragic 53.8% |
| Immigrants | Egypt | 5.2 /100 | #225 | Tragic 53.8% |
| Immigrants | Eastern Africa | 5.1 /100 | #226 | Tragic 53.7% |
| Sudanese | 4.1 /100 | #227 | Tragic 53.6% |
| Alaska Natives | 3.9 /100 | #228 | Tragic 53.6% |
| Immigrants | Turkey | 3.8 /100 | #229 | Tragic 53.6% |
| Immigrants | Nepal | 3.6 /100 | #230 | Tragic 53.5% |
| Panamanians | 3.4 /100 | #231 | Tragic 53.5% |
| Immigrants | Guatemala | 3.2 /100 | #232 | Tragic 53.5% |
| Ugandans | 3.2 /100 | #233 | Tragic 53.5% |
| Immigrants | Switzerland | 3.0 /100 | #234 | Tragic 53.4% |
Demographics Similar to Immigrants from Latin America by 2 or more Vehicles in Household
In terms of 2 or more vehicles in household, the demographic groups most similar to Immigrants from Latin America are Turkish (54.3%, a difference of 0.010%), Cheyenne (54.3%, a difference of 0.050%), Immigrants from Belgium (54.3%, a difference of 0.060%), Egyptian (54.3%, a difference of 0.10%), and Immigrants from Bulgaria (54.3%, a difference of 0.10%).
| Demographics | Rating | Rank | 2 or more Vehicles in Household |
| Immigrants | Norway | 15.9 /100 | #199 | Poor 54.4% |
| Houma | 15.8 /100 | #200 | Poor 54.4% |
| Immigrants | Italy | 15.5 /100 | #201 | Poor 54.4% |
| Immigrants | North Macedonia | 14.9 /100 | #202 | Poor 54.4% |
| Immigrants | Peru | 14.3 /100 | #203 | Poor 54.4% |
| Immigrants | Belgium | 13.7 /100 | #204 | Poor 54.3% |
| Cheyenne | 13.6 /100 | #205 | Poor 54.3% |
| Immigrants | Latin America | 13.1 /100 | #206 | Poor 54.3% |
| Turks | 13.0 /100 | #207 | Poor 54.3% |
| Egyptians | 12.0 /100 | #208 | Poor 54.3% |
| Immigrants | Bulgaria | 12.0 /100 | #209 | Poor 54.3% |
| Immigrants | Saudi Arabia | 11.3 /100 | #210 | Poor 54.2% |
| Immigrants | Hungary | 11.3 /100 | #211 | Poor 54.2% |
| Immigrants | Chile | 11.1 /100 | #212 | Poor 54.2% |
| Guatemalans | 9.6 /100 | #213 | Tragic 54.1% |