Sudanese vs Immigrants 2 or more Vehicles in Household
COMPARE
Sudanese
Immigrants
2 or more Vehicles in Household
2 or more Vehicles in Household Comparison
Sudanese
Immigrants
53.6%
2 OR MORE VEHICLES IN HOUSEHOLD
4.1/ 100
METRIC RATING
227th/ 347
METRIC RANK
54.7%
2 OR MORE VEHICLES IN HOUSEHOLD
25.0/ 100
METRIC RATING
191st/ 347
METRIC RANK
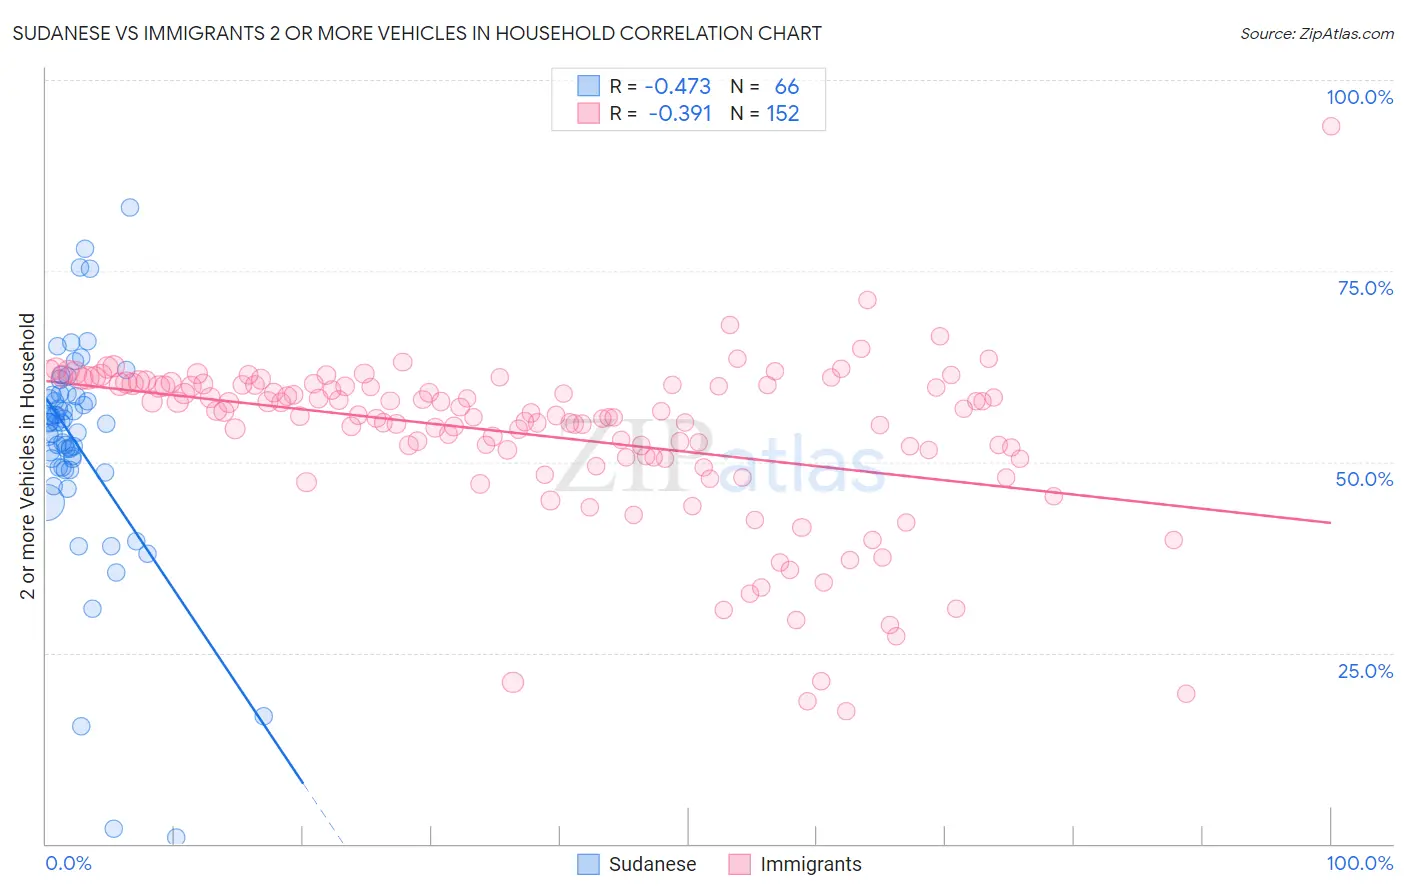
Sudanese vs Immigrants 2 or more Vehicles in Household Correlation Chart
The statistical analysis conducted on geographies consisting of 110,122,172 people shows a moderate negative correlation between the proportion of Sudanese and percentage of households with 2 or more vehicles available in the United States with a correlation coefficient (R) of -0.473 and weighted average of 53.6%. Similarly, the statistical analysis conducted on geographies consisting of 577,129,923 people shows a mild negative correlation between the proportion of Immigrants and percentage of households with 2 or more vehicles available in the United States with a correlation coefficient (R) of -0.391 and weighted average of 54.7%, a difference of 2.1%.
2 or more Vehicles in Household Correlation Summary
| Measurement | Sudanese | Immigrants |
| Minimum | 0.83% | 17.3% |
| Maximum | 83.4% | 94.0% |
| Range | 82.5% | 76.6% |
| Mean | 52.1% | 53.4% |
| Median | 55.1% | 56.3% |
| Interquartile 25% (IQ1) | 49.2% | 50.6% |
| Interquartile 75% (IQ3) | 58.6% | 60.1% |
| Interquartile Range (IQR) | 9.4% | 9.5% |
| Standard Deviation (Sample) | 14.5% | 10.9% |
| Standard Deviation (Population) | 14.4% | 10.9% |
Similar Demographics by 2 or more Vehicles in Household
Demographics Similar to Sudanese by 2 or more Vehicles in Household
In terms of 2 or more vehicles in household, the demographic groups most similar to Sudanese are Alaska Native (53.6%, a difference of 0.060%), Immigrants from Turkey (53.6%, a difference of 0.080%), Immigrants from Nepal (53.5%, a difference of 0.14%), Panamanian (53.5%, a difference of 0.19%), and Immigrants from Eastern Africa (53.7%, a difference of 0.24%).
| Demographics | Rating | Rank | 2 or more Vehicles in Household |
| Taiwanese | 6.3 /100 | #220 | Tragic 53.9% |
| Immigrants | Singapore | 6.3 /100 | #221 | Tragic 53.9% |
| Kiowa | 6.2 /100 | #222 | Tragic 53.9% |
| Immigrants | Bosnia and Herzegovina | 5.5 /100 | #223 | Tragic 53.8% |
| Brazilians | 5.3 /100 | #224 | Tragic 53.8% |
| Immigrants | Egypt | 5.2 /100 | #225 | Tragic 53.8% |
| Immigrants | Eastern Africa | 5.1 /100 | #226 | Tragic 53.7% |
| Sudanese | 4.1 /100 | #227 | Tragic 53.6% |
| Alaska Natives | 3.9 /100 | #228 | Tragic 53.6% |
| Immigrants | Turkey | 3.8 /100 | #229 | Tragic 53.6% |
| Immigrants | Nepal | 3.6 /100 | #230 | Tragic 53.5% |
| Panamanians | 3.4 /100 | #231 | Tragic 53.5% |
| Immigrants | Guatemala | 3.2 /100 | #232 | Tragic 53.5% |
| Ugandans | 3.2 /100 | #233 | Tragic 53.5% |
| Immigrants | Switzerland | 3.0 /100 | #234 | Tragic 53.4% |
Demographics Similar to Immigrants by 2 or more Vehicles in Household
In terms of 2 or more vehicles in household, the demographic groups most similar to Immigrants are Immigrants from Romania (54.7%, a difference of 0.060%), Russian (54.8%, a difference of 0.070%), Immigrants from Japan (54.7%, a difference of 0.090%), Central American (54.7%, a difference of 0.11%), and Eastern European (54.8%, a difference of 0.13%).
| Demographics | Rating | Rank | 2 or more Vehicles in Household |
| Apache | 36.7 /100 | #184 | Fair 55.1% |
| Arabs | 35.9 /100 | #185 | Fair 55.0% |
| Peruvians | 33.7 /100 | #186 | Fair 55.0% |
| Immigrants | Uganda | 33.4 /100 | #187 | Fair 55.0% |
| Marshallese | 30.5 /100 | #188 | Fair 54.9% |
| Eastern Europeans | 27.5 /100 | #189 | Fair 54.8% |
| Russians | 26.3 /100 | #190 | Fair 54.8% |
| Immigrants | Immigrants | 25.0 /100 | #191 | Fair 54.7% |
| Immigrants | Romania | 23.8 /100 | #192 | Fair 54.7% |
| Immigrants | Japan | 23.4 /100 | #193 | Fair 54.7% |
| Central Americans | 23.0 /100 | #194 | Fair 54.7% |
| Iroquois | 22.6 /100 | #195 | Fair 54.7% |
| Immigrants | Poland | 19.3 /100 | #196 | Poor 54.6% |
| Argentineans | 17.5 /100 | #197 | Poor 54.5% |
| Carpatho Rusyns | 16.2 /100 | #198 | Poor 54.4% |