Crow vs Immigrants from Pakistan 2 or more Vehicles in Household
COMPARE
Crow
Immigrants from Pakistan
2 or more Vehicles in Household
2 or more Vehicles in Household Comparison
Crow
Immigrants from Pakistan
55.7%
2 OR MORE VEHICLES IN HOUSEHOLD
67.0/ 100
METRIC RATING
160th/ 347
METRIC RANK
56.1%
2 OR MORE VEHICLES IN HOUSEHOLD
78.1/ 100
METRIC RATING
152nd/ 347
METRIC RANK
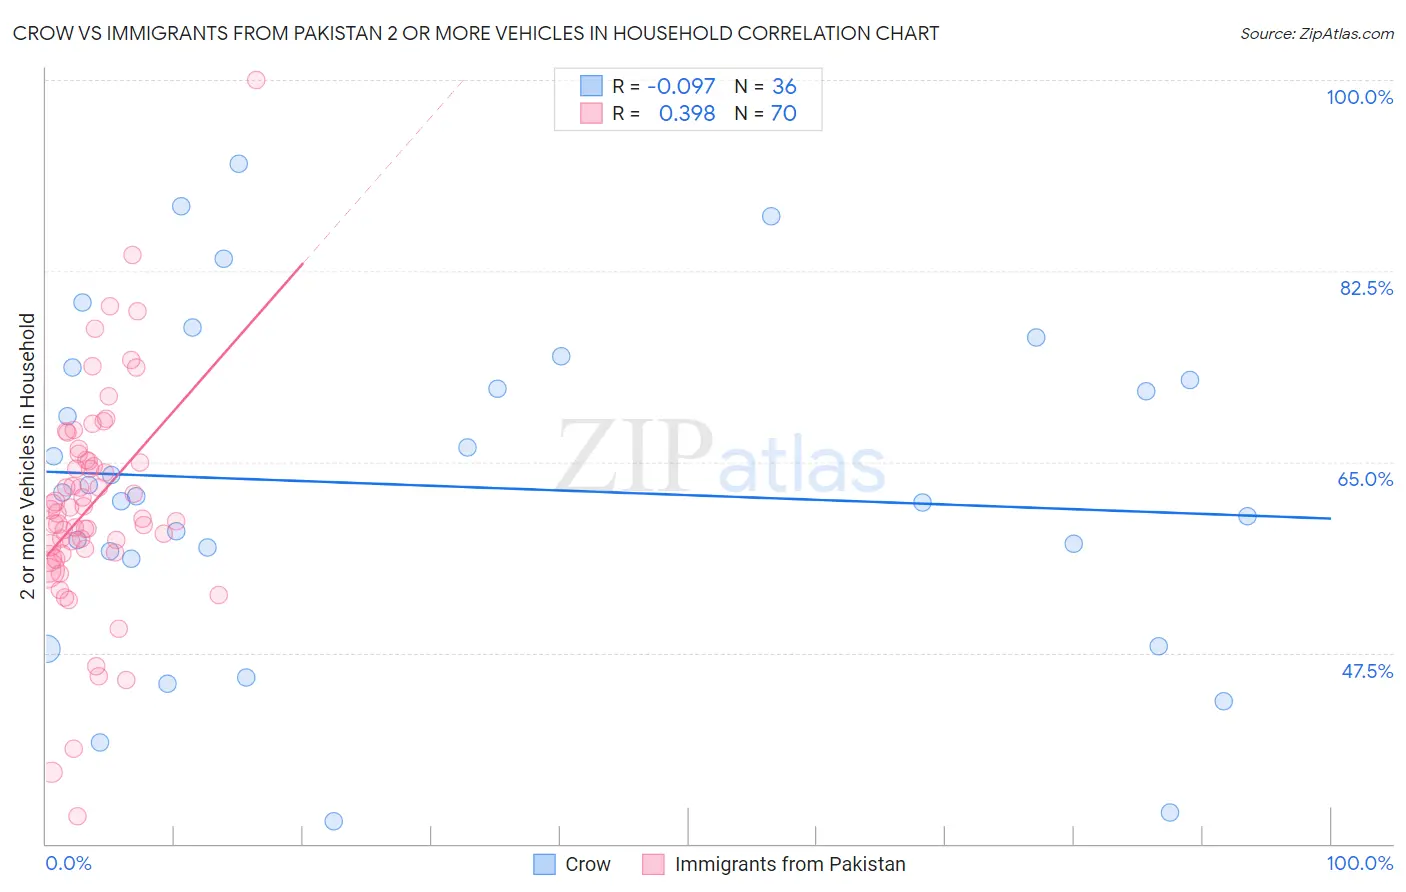
Crow vs Immigrants from Pakistan 2 or more Vehicles in Household Correlation Chart
The statistical analysis conducted on geographies consisting of 59,203,156 people shows a slight negative correlation between the proportion of Crow and percentage of households with 2 or more vehicles available in the United States with a correlation coefficient (R) of -0.097 and weighted average of 55.7%. Similarly, the statistical analysis conducted on geographies consisting of 283,700,045 people shows a mild positive correlation between the proportion of Immigrants from Pakistan and percentage of households with 2 or more vehicles available in the United States with a correlation coefficient (R) of 0.398 and weighted average of 56.1%, a difference of 0.56%.
2 or more Vehicles in Household Correlation Summary
| Measurement | Crow | Immigrants from Pakistan |
| Minimum | 32.0% | 32.5% |
| Maximum | 92.3% | 100.0% |
| Range | 60.3% | 67.5% |
| Mean | 62.8% | 61.1% |
| Median | 62.0% | 60.5% |
| Interquartile 25% (IQ1) | 56.5% | 56.7% |
| Interquartile 75% (IQ3) | 73.1% | 65.2% |
| Interquartile Range (IQR) | 16.6% | 8.5% |
| Standard Deviation (Sample) | 15.0% | 10.3% |
| Standard Deviation (Population) | 14.8% | 10.3% |
Demographics Similar to Crow and Immigrants from Pakistan by 2 or more Vehicles in Household
In terms of 2 or more vehicles in household, the demographic groups most similar to Crow are Paiute (55.8%, a difference of 0.050%), Tlingit-Haida (55.8%, a difference of 0.070%), Immigrants from Kuwait (55.8%, a difference of 0.14%), Immigrants from Lithuania (55.8%, a difference of 0.15%), and Ukrainian (55.8%, a difference of 0.17%). Similarly, the demographic groups most similar to Immigrants from Pakistan are Immigrants from Northern Europe (56.1%, a difference of 0.030%), Nicaraguan (56.1%, a difference of 0.10%), Immigrants from Moldova (56.1%, a difference of 0.12%), Chilean (56.1%, a difference of 0.12%), and Serbian (56.1%, a difference of 0.13%).
| Demographics | Rating | Rank | 2 or more Vehicles in Household |
| Venezuelans | 80.7 /100 | #146 | Excellent 56.1% |
| Serbians | 80.3 /100 | #147 | Excellent 56.1% |
| Immigrants | Moldova | 80.2 /100 | #148 | Excellent 56.1% |
| Chileans | 80.2 /100 | #149 | Excellent 56.1% |
| Nicaraguans | 79.9 /100 | #150 | Good 56.1% |
| Immigrants | Northern Europe | 78.7 /100 | #151 | Good 56.1% |
| Immigrants | Pakistan | 78.1 /100 | #152 | Good 56.1% |
| Lumbee | 71.9 /100 | #153 | Good 55.9% |
| Ukrainians | 70.8 /100 | #154 | Good 55.8% |
| Immigrants | Venezuela | 70.7 /100 | #155 | Good 55.8% |
| Immigrants | Lithuania | 70.4 /100 | #156 | Good 55.8% |
| Immigrants | Kuwait | 70.2 /100 | #157 | Good 55.8% |
| Tlingit-Haida | 68.5 /100 | #158 | Good 55.8% |
| Paiute | 68.0 /100 | #159 | Good 55.8% |
| Crow | 67.0 /100 | #160 | Good 55.7% |
| Colville | 61.1 /100 | #161 | Good 55.6% |
| German Russians | 60.9 /100 | #162 | Good 55.6% |
| Immigrants | Zimbabwe | 60.2 /100 | #163 | Good 55.6% |
| Dutch West Indians | 59.8 /100 | #164 | Average 55.6% |
| Immigrants | El Salvador | 59.4 /100 | #165 | Average 55.6% |
| Immigrants | Sri Lanka | 58.3 /100 | #166 | Average 55.5% |