African vs Immigrants from India 2 or more Vehicles in Household
COMPARE
African
Immigrants from India
2 or more Vehicles in Household
2 or more Vehicles in Household Comparison
Africans
Immigrants from India
51.8%
2 OR MORE VEHICLES IN HOUSEHOLD
0.2/ 100
METRIC RATING
274th/ 347
METRIC RANK
59.3%
2 OR MORE VEHICLES IN HOUSEHOLD
99.9/ 100
METRIC RATING
48th/ 347
METRIC RANK
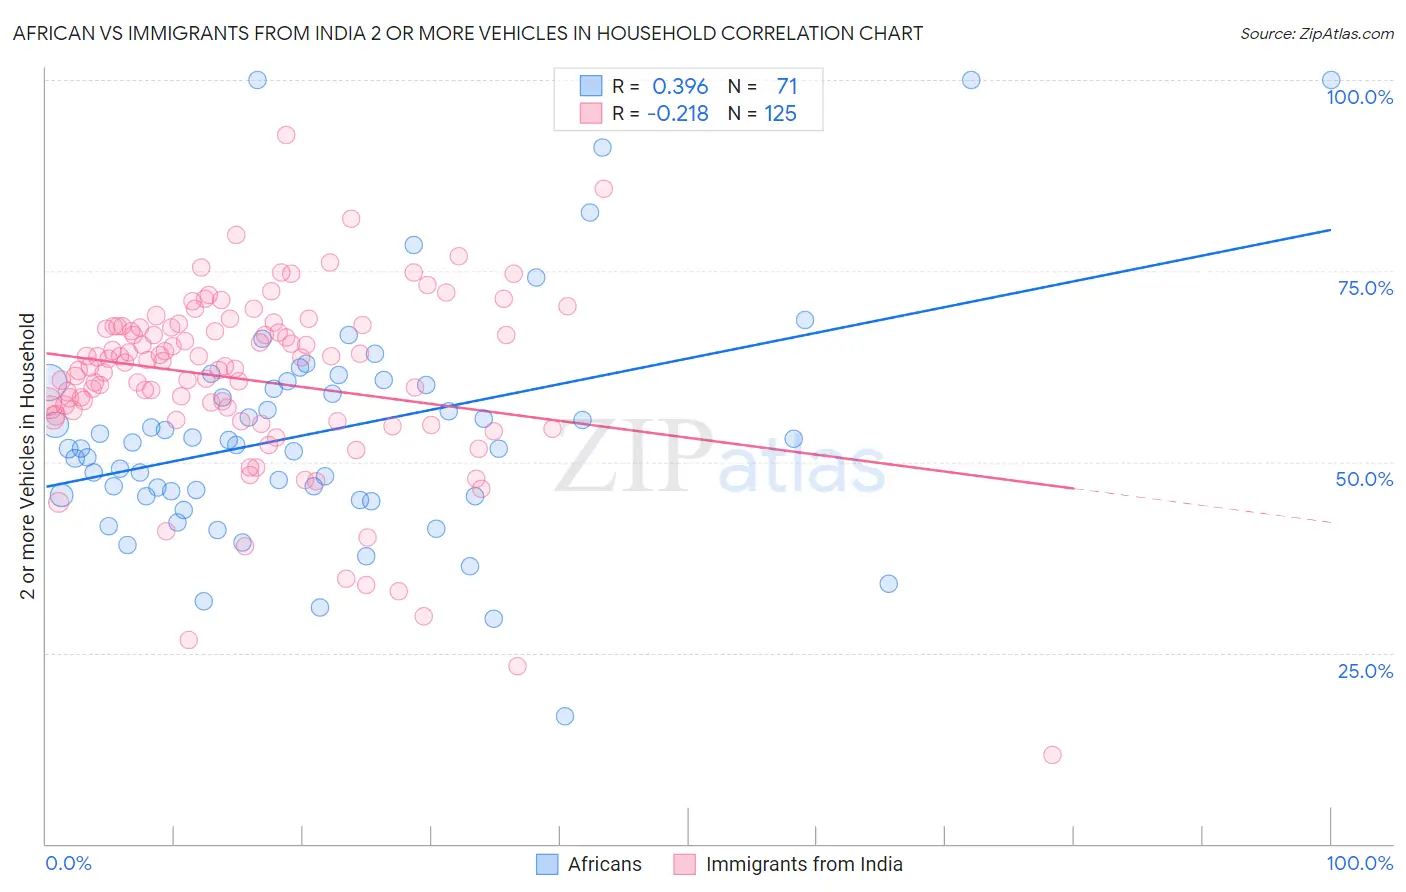
African vs Immigrants from India 2 or more Vehicles in Household Correlation Chart
The statistical analysis conducted on geographies consisting of 469,649,163 people shows a mild positive correlation between the proportion of Africans and percentage of households with 2 or more vehicles available in the United States with a correlation coefficient (R) of 0.396 and weighted average of 51.8%. Similarly, the statistical analysis conducted on geographies consisting of 433,787,530 people shows a weak negative correlation between the proportion of Immigrants from India and percentage of households with 2 or more vehicles available in the United States with a correlation coefficient (R) of -0.218 and weighted average of 59.3%, a difference of 14.4%.
2 or more Vehicles in Household Correlation Summary
| Measurement | African | Immigrants from India |
| Minimum | 16.7% | 11.6% |
| Maximum | 100.0% | 92.9% |
| Range | 83.3% | 81.2% |
| Mean | 54.0% | 60.8% |
| Median | 52.1% | 63.0% |
| Interquartile 25% (IQ1) | 45.5% | 55.9% |
| Interquartile 75% (IQ3) | 60.4% | 67.7% |
| Interquartile Range (IQR) | 14.9% | 11.7% |
| Standard Deviation (Sample) | 15.5% | 12.0% |
| Standard Deviation (Population) | 15.4% | 12.0% |
Similar Demographics by 2 or more Vehicles in Household
Demographics Similar to Africans by 2 or more Vehicles in Household
In terms of 2 or more vehicles in household, the demographic groups most similar to Africans are Immigrants from Honduras (51.8%, a difference of 0.020%), Immigrants from Croatia (51.8%, a difference of 0.040%), Israeli (51.9%, a difference of 0.050%), Immigrants from Africa (51.8%, a difference of 0.090%), and Subsaharan African (51.9%, a difference of 0.14%).
| Demographics | Rating | Rank | 2 or more Vehicles in Household |
| Immigrants | Colombia | 0.2 /100 | #267 | Tragic 52.0% |
| Pima | 0.2 /100 | #268 | Tragic 52.0% |
| Hondurans | 0.2 /100 | #269 | Tragic 52.0% |
| Immigrants | Ireland | 0.2 /100 | #270 | Tragic 52.0% |
| South Americans | 0.2 /100 | #271 | Tragic 51.9% |
| Sub-Saharan Africans | 0.2 /100 | #272 | Tragic 51.9% |
| Israelis | 0.2 /100 | #273 | Tragic 51.9% |
| Africans | 0.2 /100 | #274 | Tragic 51.8% |
| Immigrants | Honduras | 0.2 /100 | #275 | Tragic 51.8% |
| Immigrants | Croatia | 0.2 /100 | #276 | Tragic 51.8% |
| Immigrants | Africa | 0.2 /100 | #277 | Tragic 51.8% |
| Yuman | 0.1 /100 | #278 | Tragic 51.7% |
| Liberians | 0.1 /100 | #279 | Tragic 51.7% |
| Immigrants | Eastern Europe | 0.1 /100 | #280 | Tragic 51.7% |
| Immigrants | Kazakhstan | 0.1 /100 | #281 | Tragic 51.6% |
Demographics Similar to Immigrants from India by 2 or more Vehicles in Household
In terms of 2 or more vehicles in household, the demographic groups most similar to Immigrants from India are Yaqui (59.3%, a difference of 0.020%), Belgian (59.3%, a difference of 0.040%), Choctaw (59.3%, a difference of 0.040%), Spaniard (59.2%, a difference of 0.18%), and Immigrants from Laos (59.2%, a difference of 0.19%).
| Demographics | Rating | Rank | 2 or more Vehicles in Household |
| Northern Europeans | 100.0 /100 | #41 | Exceptional 59.9% |
| Malaysians | 100.0 /100 | #42 | Exceptional 59.8% |
| Czechoslovakians | 100.0 /100 | #43 | Exceptional 59.8% |
| French | 100.0 /100 | #44 | Exceptional 59.8% |
| Immigrants | Taiwan | 100.0 /100 | #45 | Exceptional 59.7% |
| Immigrants | South Eastern Asia | 100.0 /100 | #46 | Exceptional 59.6% |
| Yaqui | 99.9 /100 | #47 | Exceptional 59.3% |
| Immigrants | India | 99.9 /100 | #48 | Exceptional 59.3% |
| Belgians | 99.9 /100 | #49 | Exceptional 59.3% |
| Choctaw | 99.9 /100 | #50 | Exceptional 59.3% |
| Spaniards | 99.9 /100 | #51 | Exceptional 59.2% |
| Immigrants | Laos | 99.9 /100 | #52 | Exceptional 59.2% |
| Celtics | 99.9 /100 | #53 | Exceptional 59.2% |
| Bhutanese | 99.9 /100 | #54 | Exceptional 59.1% |
| Luxembourgers | 99.9 /100 | #55 | Exceptional 59.1% |