African vs Chickasaw 2 or more Vehicles in Household
COMPARE
African
Chickasaw
2 or more Vehicles in Household
2 or more Vehicles in Household Comparison
Africans
Chickasaw
51.8%
2 OR MORE VEHICLES IN HOUSEHOLD
0.2/ 100
METRIC RATING
274th/ 347
METRIC RANK
59.0%
2 OR MORE VEHICLES IN HOUSEHOLD
99.9/ 100
METRIC RATING
56th/ 347
METRIC RANK
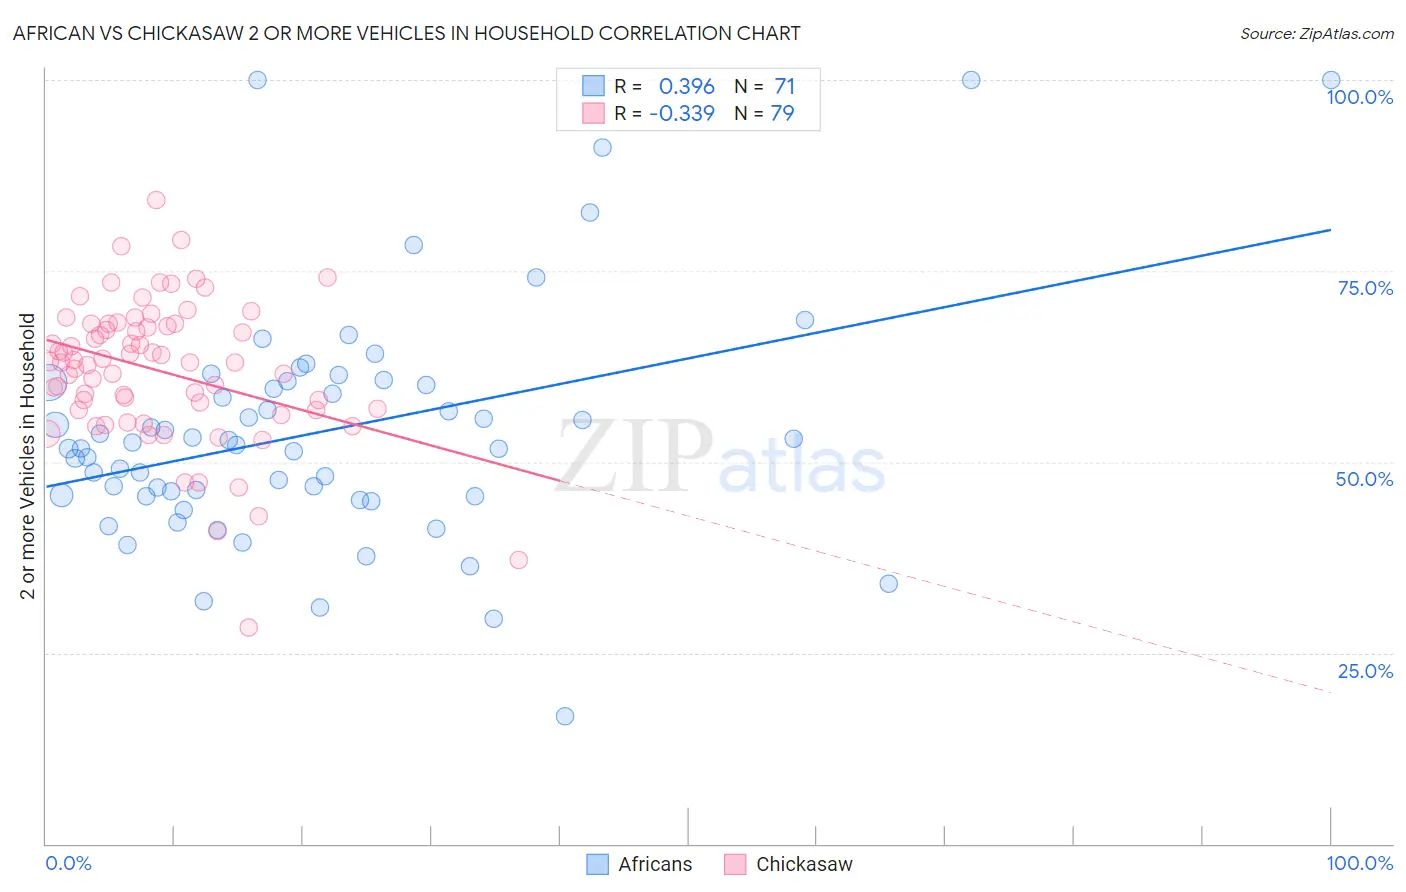
African vs Chickasaw 2 or more Vehicles in Household Correlation Chart
The statistical analysis conducted on geographies consisting of 469,649,163 people shows a mild positive correlation between the proportion of Africans and percentage of households with 2 or more vehicles available in the United States with a correlation coefficient (R) of 0.396 and weighted average of 51.8%. Similarly, the statistical analysis conducted on geographies consisting of 147,673,541 people shows a mild negative correlation between the proportion of Chickasaw and percentage of households with 2 or more vehicles available in the United States with a correlation coefficient (R) of -0.339 and weighted average of 59.0%, a difference of 13.8%.
2 or more Vehicles in Household Correlation Summary
| Measurement | African | Chickasaw |
| Minimum | 16.7% | 28.3% |
| Maximum | 100.0% | 84.2% |
| Range | 83.3% | 56.0% |
| Mean | 54.0% | 61.9% |
| Median | 52.1% | 63.1% |
| Interquartile 25% (IQ1) | 45.5% | 56.8% |
| Interquartile 75% (IQ3) | 60.4% | 68.0% |
| Interquartile Range (IQR) | 14.9% | 11.2% |
| Standard Deviation (Sample) | 15.5% | 9.3% |
| Standard Deviation (Population) | 15.4% | 9.3% |
Similar Demographics by 2 or more Vehicles in Household
Demographics Similar to Africans by 2 or more Vehicles in Household
In terms of 2 or more vehicles in household, the demographic groups most similar to Africans are Immigrants from Honduras (51.8%, a difference of 0.020%), Immigrants from Croatia (51.8%, a difference of 0.040%), Israeli (51.9%, a difference of 0.050%), Immigrants from Africa (51.8%, a difference of 0.090%), and Subsaharan African (51.9%, a difference of 0.14%).
| Demographics | Rating | Rank | 2 or more Vehicles in Household |
| Immigrants | Colombia | 0.2 /100 | #267 | Tragic 52.0% |
| Pima | 0.2 /100 | #268 | Tragic 52.0% |
| Hondurans | 0.2 /100 | #269 | Tragic 52.0% |
| Immigrants | Ireland | 0.2 /100 | #270 | Tragic 52.0% |
| South Americans | 0.2 /100 | #271 | Tragic 51.9% |
| Sub-Saharan Africans | 0.2 /100 | #272 | Tragic 51.9% |
| Israelis | 0.2 /100 | #273 | Tragic 51.9% |
| Africans | 0.2 /100 | #274 | Tragic 51.8% |
| Immigrants | Honduras | 0.2 /100 | #275 | Tragic 51.8% |
| Immigrants | Croatia | 0.2 /100 | #276 | Tragic 51.8% |
| Immigrants | Africa | 0.2 /100 | #277 | Tragic 51.8% |
| Yuman | 0.1 /100 | #278 | Tragic 51.7% |
| Liberians | 0.1 /100 | #279 | Tragic 51.7% |
| Immigrants | Eastern Europe | 0.1 /100 | #280 | Tragic 51.7% |
| Immigrants | Kazakhstan | 0.1 /100 | #281 | Tragic 51.6% |
Demographics Similar to Chickasaw by 2 or more Vehicles in Household
In terms of 2 or more vehicles in household, the demographic groups most similar to Chickasaw are Afghan (59.0%, a difference of 0.0%), Luxembourger (59.1%, a difference of 0.11%), Bhutanese (59.1%, a difference of 0.14%), Immigrants from Scotland (58.9%, a difference of 0.19%), and Spanish American (58.9%, a difference of 0.21%).
| Demographics | Rating | Rank | 2 or more Vehicles in Household |
| Belgians | 99.9 /100 | #49 | Exceptional 59.3% |
| Choctaw | 99.9 /100 | #50 | Exceptional 59.3% |
| Spaniards | 99.9 /100 | #51 | Exceptional 59.2% |
| Immigrants | Laos | 99.9 /100 | #52 | Exceptional 59.2% |
| Celtics | 99.9 /100 | #53 | Exceptional 59.2% |
| Bhutanese | 99.9 /100 | #54 | Exceptional 59.1% |
| Luxembourgers | 99.9 /100 | #55 | Exceptional 59.1% |
| Chickasaw | 99.9 /100 | #56 | Exceptional 59.0% |
| Afghans | 99.9 /100 | #57 | Exceptional 59.0% |
| Immigrants | Scotland | 99.8 /100 | #58 | Exceptional 58.9% |
| Spanish Americans | 99.8 /100 | #59 | Exceptional 58.9% |
| French Canadians | 99.8 /100 | #60 | Exceptional 58.9% |
| Osage | 99.8 /100 | #61 | Exceptional 58.8% |
| Immigrants | Nonimmigrants | 99.8 /100 | #62 | Exceptional 58.8% |
| Mexican American Indians | 99.8 /100 | #63 | Exceptional 58.7% |