African vs Filipino 2 or more Vehicles in Household
COMPARE
African
Filipino
2 or more Vehicles in Household
2 or more Vehicles in Household Comparison
Africans
Filipinos
51.8%
2 OR MORE VEHICLES IN HOUSEHOLD
0.2/ 100
METRIC RATING
274th/ 347
METRIC RANK
57.8%
2 OR MORE VEHICLES IN HOUSEHOLD
98.9/ 100
METRIC RATING
94th/ 347
METRIC RANK
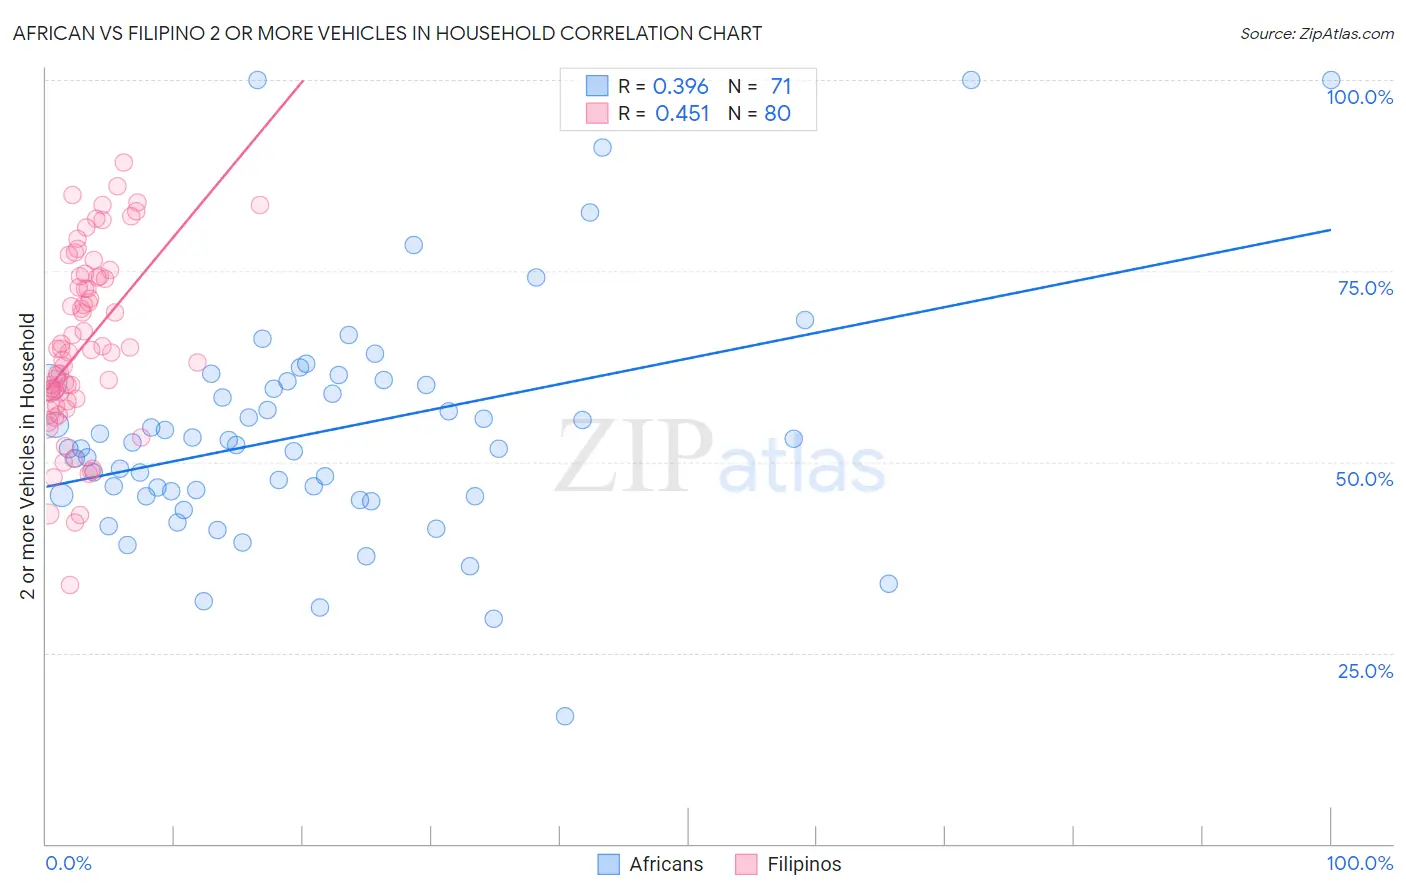
African vs Filipino 2 or more Vehicles in Household Correlation Chart
The statistical analysis conducted on geographies consisting of 469,649,163 people shows a mild positive correlation between the proportion of Africans and percentage of households with 2 or more vehicles available in the United States with a correlation coefficient (R) of 0.396 and weighted average of 51.8%. Similarly, the statistical analysis conducted on geographies consisting of 254,177,866 people shows a moderate positive correlation between the proportion of Filipinos and percentage of households with 2 or more vehicles available in the United States with a correlation coefficient (R) of 0.451 and weighted average of 57.8%, a difference of 11.6%.
2 or more Vehicles in Household Correlation Summary
| Measurement | African | Filipino |
| Minimum | 16.7% | 33.9% |
| Maximum | 100.0% | 89.1% |
| Range | 83.3% | 55.2% |
| Mean | 54.0% | 65.2% |
| Median | 52.1% | 64.5% |
| Interquartile 25% (IQ1) | 45.5% | 58.1% |
| Interquartile 75% (IQ3) | 60.4% | 74.3% |
| Interquartile Range (IQR) | 14.9% | 16.2% |
| Standard Deviation (Sample) | 15.5% | 11.8% |
| Standard Deviation (Population) | 15.4% | 11.7% |
Similar Demographics by 2 or more Vehicles in Household
Demographics Similar to Africans by 2 or more Vehicles in Household
In terms of 2 or more vehicles in household, the demographic groups most similar to Africans are Immigrants from Honduras (51.8%, a difference of 0.020%), Immigrants from Croatia (51.8%, a difference of 0.040%), Israeli (51.9%, a difference of 0.050%), Immigrants from Africa (51.8%, a difference of 0.090%), and Subsaharan African (51.9%, a difference of 0.14%).
| Demographics | Rating | Rank | 2 or more Vehicles in Household |
| Immigrants | Colombia | 0.2 /100 | #267 | Tragic 52.0% |
| Pima | 0.2 /100 | #268 | Tragic 52.0% |
| Hondurans | 0.2 /100 | #269 | Tragic 52.0% |
| Immigrants | Ireland | 0.2 /100 | #270 | Tragic 52.0% |
| South Americans | 0.2 /100 | #271 | Tragic 51.9% |
| Sub-Saharan Africans | 0.2 /100 | #272 | Tragic 51.9% |
| Israelis | 0.2 /100 | #273 | Tragic 51.9% |
| Africans | 0.2 /100 | #274 | Tragic 51.8% |
| Immigrants | Honduras | 0.2 /100 | #275 | Tragic 51.8% |
| Immigrants | Croatia | 0.2 /100 | #276 | Tragic 51.8% |
| Immigrants | Africa | 0.2 /100 | #277 | Tragic 51.8% |
| Yuman | 0.1 /100 | #278 | Tragic 51.7% |
| Liberians | 0.1 /100 | #279 | Tragic 51.7% |
| Immigrants | Eastern Europe | 0.1 /100 | #280 | Tragic 51.7% |
| Immigrants | Kazakhstan | 0.1 /100 | #281 | Tragic 51.6% |
Demographics Similar to Filipinos by 2 or more Vehicles in Household
In terms of 2 or more vehicles in household, the demographic groups most similar to Filipinos are Hmong (57.8%, a difference of 0.020%), Shoshone (57.9%, a difference of 0.060%), Ottawa (57.9%, a difference of 0.060%), Burmese (57.8%, a difference of 0.060%), and Slavic (57.8%, a difference of 0.080%).
| Demographics | Rating | Rank | 2 or more Vehicles in Household |
| Thais | 99.1 /100 | #87 | Exceptional 57.9% |
| Immigrants | Iran | 99.1 /100 | #88 | Exceptional 57.9% |
| Immigrants | Germany | 99.0 /100 | #89 | Exceptional 57.9% |
| Hispanics or Latinos | 99.0 /100 | #90 | Exceptional 57.9% |
| Pakistanis | 99.0 /100 | #91 | Exceptional 57.9% |
| Shoshone | 99.0 /100 | #92 | Exceptional 57.9% |
| Ottawa | 99.0 /100 | #93 | Exceptional 57.9% |
| Filipinos | 98.9 /100 | #94 | Exceptional 57.8% |
| Hmong | 98.9 /100 | #95 | Exceptional 57.8% |
| Burmese | 98.8 /100 | #96 | Exceptional 57.8% |
| Slavs | 98.8 /100 | #97 | Exceptional 57.8% |
| Palestinians | 98.6 /100 | #98 | Exceptional 57.7% |
| Cajuns | 98.5 /100 | #99 | Exceptional 57.7% |
| Fijians | 98.4 /100 | #100 | Exceptional 57.6% |
| Lebanese | 98.3 /100 | #101 | Exceptional 57.6% |