Zip Codes with the Lowest Percentage of Owner-Occupied Units in New York, NY
RELATED REPORTS & OPTIONS
Lowest Owner-Occupied
New York
Compare Zip Codes
Map of Zip Codes with the Lowest Percentage of Owner-Occupied Units in New York
48.8%
6.8%
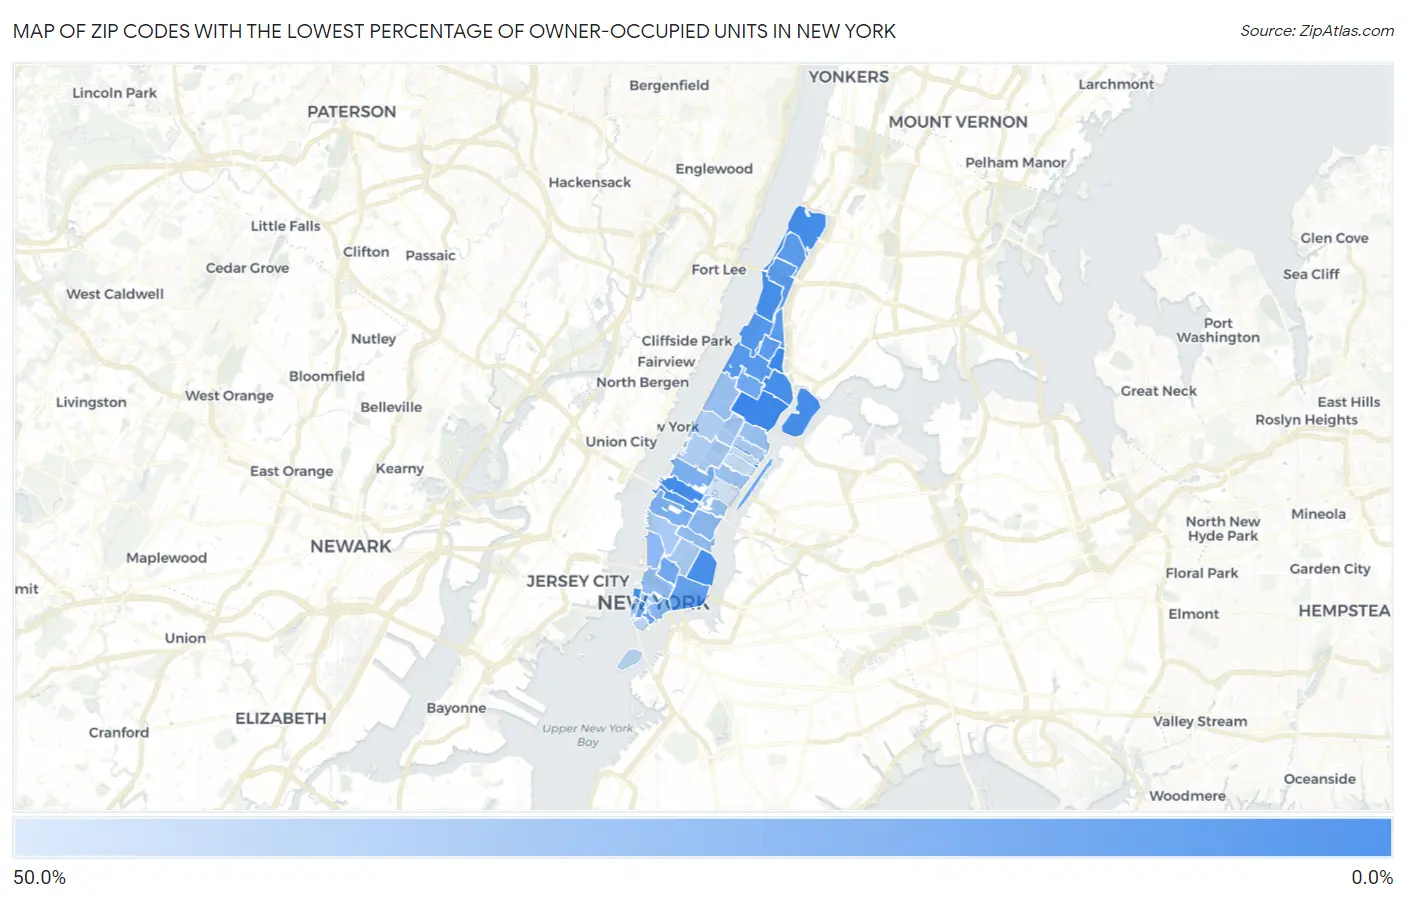
Zip Codes with the Lowest Percentage of Owner-Occupied Units in New York, NY
| Zip Code | % Owner-Occupied | vs State | vs National | |
| 1. | 10037 | 6.8% | 54.3%(-47.5)#13 | 64.8%(-58.1)#105 |
| 2. | 10029 | 6.8% | 54.3%(-47.4)#14 | 64.8%(-58.0)#108 |
| 3. | 10036 | 8.3% | 54.3%(-46.0)#17 | 64.8%(-56.6)#133 |
| 4. | 10282 | 9.1% | 54.3%(-45.2)#18 | 64.8%(-55.7)#147 |
| 5. | 10034 | 9.1% | 54.3%(-45.2)#19 | 64.8%(-55.7)#148 |
| 6. | 10032 | 9.3% | 54.3%(-45.0)#21 | 64.8%(-55.5)#150 |
| 7. | 10009 | 9.6% | 54.3%(-44.7)#22 | 64.8%(-55.3)#158 |
| 8. | 10035 | 9.7% | 54.3%(-44.5)#23 | 64.8%(-55.1)#160 |
| 9. | 10018 | 12.4% | 54.3%(-41.9)#32 | 64.8%(-52.4)#217 |
| 10. | 10031 | 13.0% | 54.3%(-41.3)#34 | 64.8%(-51.8)#225 |
| 11. | 10027 | 13.3% | 54.3%(-41.0)#35 | 64.8%(-51.5)#228 |
| 12. | 10030 | 14.4% | 54.3%(-39.9)#41 | 64.8%(-50.5)#245 |
| 13. | 10033 | 14.7% | 54.3%(-39.6)#43 | 64.8%(-50.1)#251 |
| 14. | 10040 | 14.8% | 54.3%(-39.5)#44 | 64.8%(-50.1)#253 |
| 15. | 10039 | 14.9% | 54.3%(-39.4)#46 | 64.8%(-49.9)#257 |
| 16. | 10005 | 16.7% | 54.3%(-37.6)#51 | 64.8%(-48.1)#301 |
| 17. | 10002 | 17.3% | 54.3%(-37.0)#52 | 64.8%(-47.5)#311 |
| 18. | 10006 | 17.7% | 54.3%(-36.5)#53 | 64.8%(-47.1)#317 |
| 19. | 10026 | 19.8% | 54.3%(-34.5)#59 | 64.8%(-45.0)#369 |
| 20. | 10012 | 20.4% | 54.3%(-33.9)#62 | 64.8%(-44.4)#386 |
| 21. | 10044 | 20.7% | 54.3%(-33.5)#64 | 64.8%(-44.1)#396 |
| 22. | 10019 | 23.0% | 54.3%(-31.3)#71 | 64.8%(-41.8)#476 |
| 23. | 10001 | 23.8% | 54.3%(-30.5)#72 | 64.8%(-41.0)#497 |
| 24. | 10038 | 26.9% | 54.3%(-27.4)#84 | 64.8%(-38.0)#608 |
| 25. | 10016 | 27.3% | 54.3%(-27.0)#87 | 64.8%(-37.6)#625 |
| 26. | 10014 | 28.4% | 54.3%(-25.9)#97 | 64.8%(-36.4)#683 |
| 27. | 10010 | 28.8% | 54.3%(-25.5)#100 | 64.8%(-36.0)#705 |
| 28. | 10013 | 29.5% | 54.3%(-24.8)#105 | 64.8%(-35.3)#744 |
| 29. | 10017 | 30.6% | 54.3%(-23.7)#113 | 64.8%(-34.2)#791 |
| 30. | 10128 | 31.0% | 54.3%(-23.3)#117 | 64.8%(-33.8)#819 |
| 31. | 10280 | 31.3% | 54.3%(-23.0)#119 | 64.8%(-33.5)#834 |
| 32. | 10025 | 31.5% | 54.3%(-22.8)#120 | 64.8%(-33.3)#841 |
| 33. | 10065 | 32.5% | 54.3%(-21.8)#123 | 64.8%(-32.3)#911 |
| 34. | 10069 | 32.6% | 54.3%(-21.7)#124 | 64.8%(-32.2)#919 |
| 35. | 10007 | 34.1% | 54.3%(-20.1)#127 | 64.8%(-30.7)#1,016 |
| 36. | 10028 | 35.7% | 54.3%(-18.6)#137 | 64.8%(-29.2)#1,126 |
| 37. | 10003 | 35.7% | 54.3%(-18.6)#138 | 64.8%(-29.1)#1,132 |
| 38. | 10011 | 36.6% | 54.3%(-17.7)#144 | 64.8%(-28.3)#1,218 |
| 39. | 10023 | 38.1% | 54.3%(-16.1)#151 | 64.8%(-26.7)#1,348 |
| 40. | 10024 | 38.3% | 54.3%(-16.0)#154 | 64.8%(-26.5)#1,363 |
| 41. | 10004 | 42.1% | 54.3%(-12.2)#174 | 64.8%(-22.8)#1,709 |
| 42. | 10021 | 44.6% | 54.3%(-9.66)#187 | 64.8%(-20.2)#1,984 |
| 43. | 10075 | 45.3% | 54.3%(-8.97)#192 | 64.8%(-19.5)#2,082 |
| 44. | 10022 | 48.8% | 54.3%(-5.45)#214 | 64.8%(-16.0)#2,607 |
1
Common Questions
What are the Top 10 Zip Codes with the Lowest Percentage of Owner-Occupied Units in New York, NY?
Top 10 Zip Codes with the Lowest Percentage of Owner-Occupied Units in New York, NY are:
What zip code has the Lowest Percentage of Owner-Occupied Units in New York, NY?
10037 has the Lowest Percentage of Owner-Occupied Units in New York, NY with 6.8%.
What is the Percentage of Owner-Occupied Units in New York, NY?
Percentage of Owner-Occupied Units in New York is 32.9%.
What is the Percentage of Owner-Occupied Units in New York?
Percentage of Owner-Occupied Units in New York is 54.3%.
What is the Percentage of Owner-Occupied Units in the United States?
Percentage of Owner-Occupied Units in the United States is 64.8%.