Zip Codes with the Highest Percentage of Population Employed in Accommodation & Food Services in New York, NY

RELATED REPORTS & OPTIONS

Accommodation & Food Services
Population
Families and Households
Female Fertility
Female Fertility (Unmarried)
Race (Community Size)
Race (Percentage)
Ancestry (Community Size)
AfghanAfricanAlbanianAlsatianAmericanApacheArabArgentineanArmenianAssyrian / Chaldean / SyriacAustralianAustrianBahamianBarbadianBasqueBelgianBelizeanBermudanBhutaneseBlackfeetBolivianBrazilianBritishBritish West IndianBulgarianBurmeseCajunCambodianCanadianCape VerdeanCarpatho RusynCelticCentral AmericanCentral American IndianCherokeeChickasawChileanChippewaChoctawColombianCosta RicanCreekCroatianCubanCypriotCzechCzechoslovakianDanishDelawareDominicanDutchDutch West IndianEastern EuropeanEcuadorianEgyptianEnglishEstonianEthiopianEuropeanFilipinoFinnishFrenchFrench American IndianFrench CanadianGermanGhanaianGreekGuamanian / ChamorroGuatemalanGuyaneseHaitianHmongHonduranHungarianIcelanderIndian (Asian)IndonesianIranianIraqiIrishIroquoisIsraeliItalianJamaicanJapaneseJordanianKenyanKoreanLaotianLatvianLebaneseLiberianLithuanianLuxembourgerMacedonianMalaysianMalteseMexicanMexican American IndianMongolianMoroccanNative HawaiianNew ZealanderNicaraguanNigerianNorthern EuropeanNorwegianOkinawanPakistaniPalestinianPanamanianParaguayanPennsylvania GermanPeruvianPolishPortuguesePuebloPuerto RicanRomanianRussianSalvadoranSamoanScandinavianScotch-IrishScottishSenegaleseSerbianSierra LeoneanSiouxSlavicSlovakSloveneSomaliSouth AfricanSouth AmericanSouth American IndianSoviet UnionSpaniardSpanishSpanish AmericanSpanish American IndianSri LankanSubsaharan AfricanSudaneseSwedishSwissSyrianThaiTrinidadian and TobagonianTurkishU.S. Virgin IslanderUgandanUkrainianUruguayanVenezuelanVietnameseWelshWest IndianYugoslavianZimbabwean
Ancestry (Percentage)
AfghanAfricanAlbanianAlsatianAmericanApacheArabArgentineanArmenianAssyrian / Chaldean / SyriacAustralianAustrianBahamianBarbadianBasqueBelgianBelizeanBermudanBhutaneseBlackfeetBolivianBrazilianBritishBritish West IndianBulgarianBurmeseCajunCambodianCanadianCape VerdeanCarpatho RusynCelticCentral AmericanCentral American IndianCherokeeChickasawChileanChippewaChoctawColombianCosta RicanCreekCroatianCubanCypriotCzechCzechoslovakianDanishDelawareDominicanDutchDutch West IndianEastern EuropeanEcuadorianEgyptianEnglishEstonianEthiopianEuropeanFilipinoFinnishFrenchFrench American IndianFrench CanadianGermanGhanaianGreekGuamanian / ChamorroGuatemalanGuyaneseHaitianHmongHonduranHungarianIcelanderIndian (Asian)IndonesianIranianIraqiIrishIroquoisIsraeliItalianJamaicanJapaneseJordanianKenyanKoreanLaotianLatvianLebaneseLiberianLithuanianLuxembourgerMacedonianMalaysianMalteseMexicanMexican American IndianMongolianMoroccanNative HawaiianNew ZealanderNicaraguanNigerianNorthern EuropeanNorwegianOkinawanPakistaniPalestinianPanamanianParaguayanPennsylvania GermanPeruvianPolishPortuguesePuebloPuerto RicanRomanianRussianSalvadoranSamoanScandinavianScotch-IrishScottishSenegaleseSerbianSierra LeoneanSiouxSlavicSlovakSloveneSomaliSouth AfricanSouth AmericanSouth American IndianSoviet UnionSpaniardSpanishSpanish AmericanSpanish American IndianSri LankanSubsaharan AfricanSudaneseSwedishSwissSyrianThaiTrinidadian and TobagonianTurkishU.S. Virgin IslanderUgandanUkrainianUruguayanVenezuelanVietnameseWelshWest IndianYugoslavianZimbabwean
Immigrant Origin (Total)
AfghanistanAfricaAlbaniaArgentinaArmeniaAsiaAustraliaAustriaBahamasBangladeshBarbadosBelarusBelgiumBelizeBoliviaBosnia and HerzegovinaBrazilBulgariaBurma / MyanmarCambodiaCameroonCanadaCaribbeanCentral AmericaChileChinaColombiaCongoCosta RicaCroatiaCubaCzechoslovakiaDenmarkDominicaDominican RepublicEastern AfricaEastern AsiaEastern EuropeEcuadorEgyptEl SalvadorEnglandEritreaEthiopiaEuropeFranceGermanyGhanaGreeceGrenadaGuatemalaGuyanaHaitiHondurasHong KongHungaryIndiaIndonesiaIranIraqIrelandIsraelItalyJamaicaJapanJordanKazakhstanKenyaKoreaKuwaitLatin AmericaLatviaLebanonLiberiaLithuaniaMalaysiaMexicoMiddle AfricaMoldovaMoroccoNepalNetherlandsNicaraguaNigeriaNorth MacedoniaNorthern AfricaNorthern EuropeNorwayOceaniaPakistanPanamaPeruPhilippinesPolandPortugalRomaniaRussiaSaudi ArabiaScotlandSenegalSerbiaSierra LeoneSingaporeSomaliaSouth AfricaSouth AmericaSouth Central AsiaSouth Eastern AsiaSouthern EuropeSpainSri LankaSt. Vincent and the GrenadinesSudanSwedenSwitzerlandSyriaTaiwanThailandTrinidad and TobagoTurkeyUgandaUkraineUruguayUzbekistanVenezuelaVietnamWest IndiesWestern AfricaWestern AsiaWestern EuropeYemenZaireZimbabwe
Immigrant Origin (Percentage)
AfghanistanAfricaAlbaniaArgentinaArmeniaAsiaAustraliaAustriaBahamasBangladeshBarbadosBelarusBelgiumBelizeBoliviaBosnia and HerzegovinaBrazilBulgariaBurma / MyanmarCambodiaCameroonCanadaCaribbeanCentral AmericaChileChinaColombiaCongoCosta RicaCroatiaCubaCzechoslovakiaDenmarkDominicaDominican RepublicEastern AfricaEastern AsiaEastern EuropeEcuadorEgyptEl SalvadorEnglandEritreaEthiopiaEuropeFranceGermanyGhanaGreeceGrenadaGuatemalaGuyanaHaitiHondurasHong KongHungaryIndiaIndonesiaIranIraqIrelandIsraelItalyJamaicaJapanJordanKazakhstanKenyaKoreaKuwaitLatin AmericaLatviaLebanonLiberiaLithuaniaMalaysiaMexicoMiddle AfricaMoldovaMoroccoNepalNetherlandsNicaraguaNigeriaNorth MacedoniaNorthern AfricaNorthern EuropeNorwayOceaniaPakistanPanamaPeruPhilippinesPolandPortugalRomaniaRussiaSaudi ArabiaScotlandSenegalSerbiaSierra LeoneSingaporeSomaliaSouth AfricaSouth AmericaSouth Central AsiaSouth Eastern AsiaSouthern EuropeSpainSri LankaSt. Vincent and the GrenadinesSudanSwedenSwitzerlandSyriaTaiwanThailandTrinidad and TobagoTurkeyUgandaUkraineUruguayUzbekistanVenezuelaVietnamWest IndiesWestern AfricaWestern AsiaWestern EuropeYemenZaireZimbabwe
Income
Income (Families)
Income (Households)
Poverty
Poverty (Families)
Unemployment
Employment Occupations
Employment Industries
Employer Class
Commute Time
Commute Means
School Enrollment
Education by Degree Field
Occupancy
Finances
Physical Characteristics
New York
Compare Zip Codes
Comparison Subject

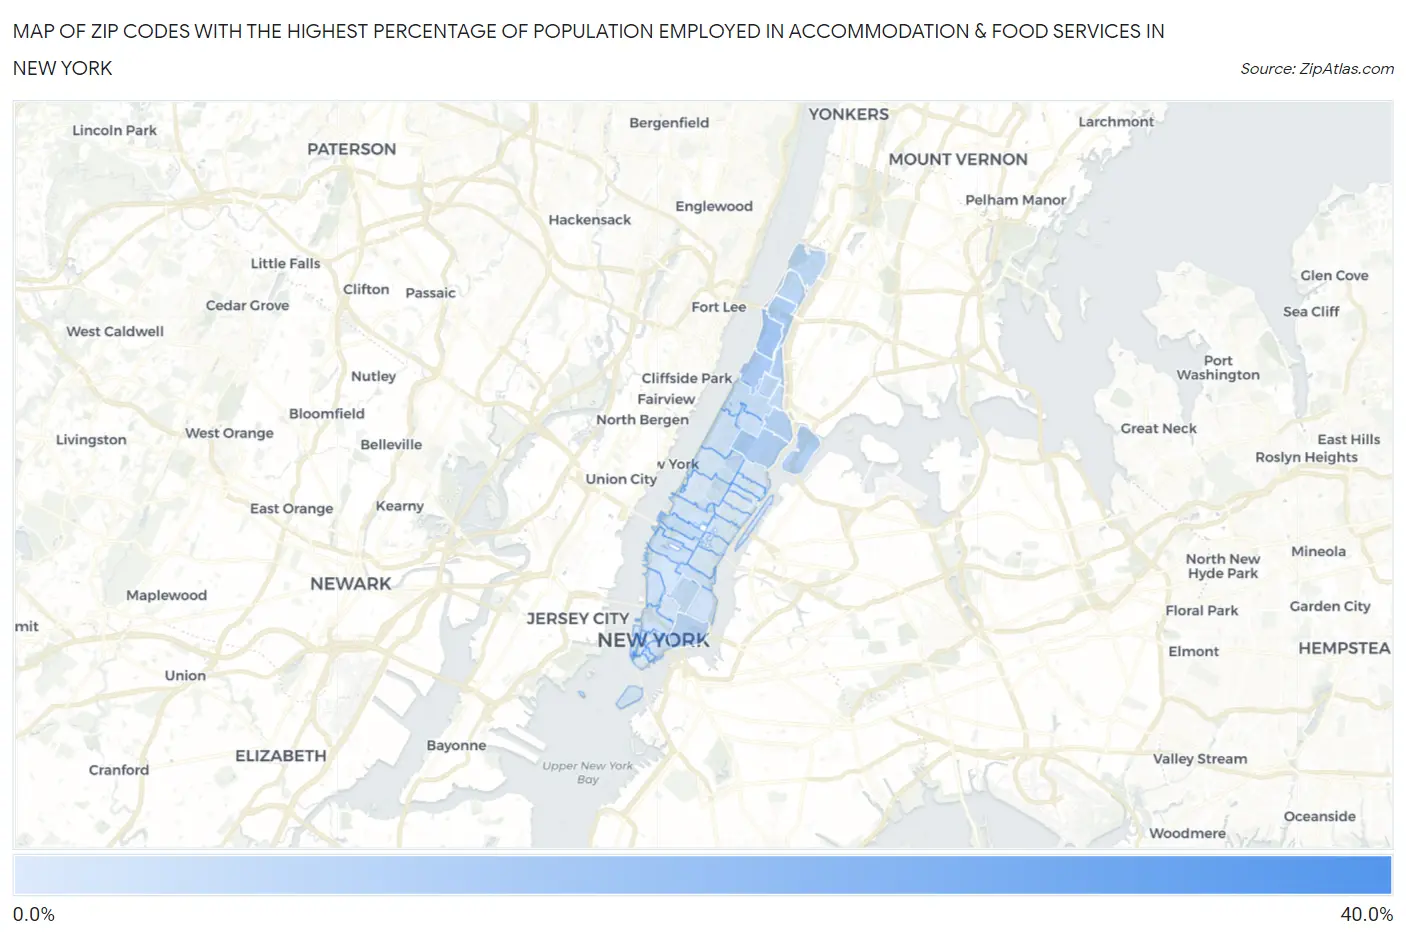
Map of Zip Codes with the Highest Percentage of Population Employed in Accommodation & Food Services in New York

0.0%
40.0%
Zip Codes with the Highest Percentage of Population Employed in Accommodation & Food Services in New York Map

Zip Codes with the Highest Percentage of Population Employed in Accommodation & Food Services in New York, NY

Zip Code % Employed vs State vs National
1.1027935.4%6.2%(+29.3)#156.9%(+28.5)#216
2.1003212.9%6.2%(+6.72)#1196.9%(+6.00)#2,399
3.1003111.2%6.2%(+5.05)#1696.9%(+4.33)#3,386
4.1003310.1%6.2%(+3.94)#2126.9%(+3.23)#4,403
5.100299.9%6.2%(+3.78)#2246.9%(+3.06)#4,608
6.100399.5%6.2%(+3.37)#2556.9%(+2.65)#5,167
7.100359.1%6.2%(+2.96)#2816.9%(+2.24)#5,767
8.100028.8%6.2%(+2.61)#3106.9%(+1.89)#6,333
9.100307.4%6.2%(+1.22)#4396.9%(+0.507)#9,285
10.100347.3%6.2%(+1.15)#4496.9%(+0.437)#9,462
11.100407.3%6.2%(+1.12)#4576.9%(+0.404)#9,577
12.101626.5%6.2%(+0.364)#5516.9%(-0.352)#11,747
13.100036.4%6.2%(+0.225)#5816.9%(-0.491)#12,195
14.100376.3%6.2%(+0.105)#6046.9%(-0.612)#12,581
15.100365.7%6.2%(-0.500)#7236.9%(-1.22)#14,504
16.100275.5%6.2%(-0.652)#7536.9%(-1.37)#15,009
17.100014.2%6.2%(-1.94)#1,0376.9%(-2.66)#19,435
18.100144.2%6.2%(-2.01)#1,0516.9%(-2.73)#19,661
19.100254.1%6.2%(-2.04)#1,0566.9%(-2.75)#19,729
20.100264.1%6.2%(-2.05)#1,0626.9%(-2.77)#19,771
21.100104.1%6.2%(-2.07)#1,0686.9%(-2.79)#19,836
22.102803.9%6.2%(-2.25)#1,0996.9%(-2.97)#20,437
23.100383.7%6.2%(-2.43)#1,1336.9%(-3.14)#20,992
24.100073.5%6.2%(-2.62)#1,1616.9%(-3.34)#21,642
25.100053.3%6.2%(-2.90)#1,2146.9%(-3.61)#22,493
26.100093.3%6.2%(-2.90)#1,2156.9%(-3.61)#22,498
27.100133.1%6.2%(-3.03)#1,2336.9%(-3.74)#22,859
28.100183.0%6.2%(-3.13)#1,2556.9%(-3.85)#23,118
29.100242.9%6.2%(-3.22)#1,2716.9%(-3.94)#23,357
30.100192.9%6.2%(-3.30)#1,2846.9%(-4.02)#23,581
31.100122.8%6.2%(-3.33)#1,2946.9%(-4.05)#23,658
32.102822.8%6.2%(-3.39)#1,3096.9%(-4.10)#23,819
33.100172.7%6.2%(-3.49)#1,3186.9%(-4.21)#24,064
34.100442.5%6.2%(-3.67)#1,3436.9%(-4.39)#24,515
35.100162.4%6.2%(-3.79)#1,3536.9%(-4.51)#24,785
36.100222.3%6.2%(-3.82)#1,3566.9%(-4.54)#24,849
37.100282.2%6.2%(-3.92)#1,3696.9%(-4.64)#25,068
38.100112.1%6.2%(-4.02)#1,3736.9%(-4.73)#25,256
39.100232.1%6.2%(-4.11)#1,3836.9%(-4.83)#25,452
40.100651.9%6.2%(-4.25)#1,4046.9%(-4.96)#25,719
41.101281.8%6.2%(-4.33)#1,4116.9%(-5.04)#25,877
42.100061.8%6.2%(-4.36)#1,4186.9%(-5.08)#25,947
43.100751.3%6.2%(-4.90)#1,4746.9%(-5.61)#26,862
44.100041.2%6.2%(-4.98)#1,4856.9%(-5.70)#27,006
45.100210.98%6.2%(-5.19)#1,4966.9%(-5.90)#27,335

Common Questions

What are the Top 10 Zip Codes with the Highest Percentage of Population Employed in Accommodation & Food Services in New York, NY?
Top 10 Zip Codes with the Highest Percentage of Population Employed in Accommodation & Food Services in New York, NY are:
#1
35.4%
#2
12.9%
#3
11.2%
#4
10.1%
#5
9.9%
#6
9.5%
#7
9.1%
#8
8.8%
#9
7.4%
#10
7.3%
What zip code has the Highest Percentage of Population Employed in Accommodation & Food Services in New York, NY?
10279 has the Highest Percentage of Population Employed in Accommodation & Food Services in New York, NY with 35.4%.
What is the Percentage of Population Employed in Accommodation & Food Services in New York, NY?
Percentage of Population Employed in Accommodation & Food Services in New York is 6.8%.
What is the Percentage of Population Employed in Accommodation & Food Services in New York?
Percentage of Population Employed in Accommodation & Food Services in New York is 6.2%.
What is the Percentage of Population Employed in Accommodation & Food Services in the United States?
Percentage of Population Employed in Accommodation & Food Services in the United States is 6.9%.