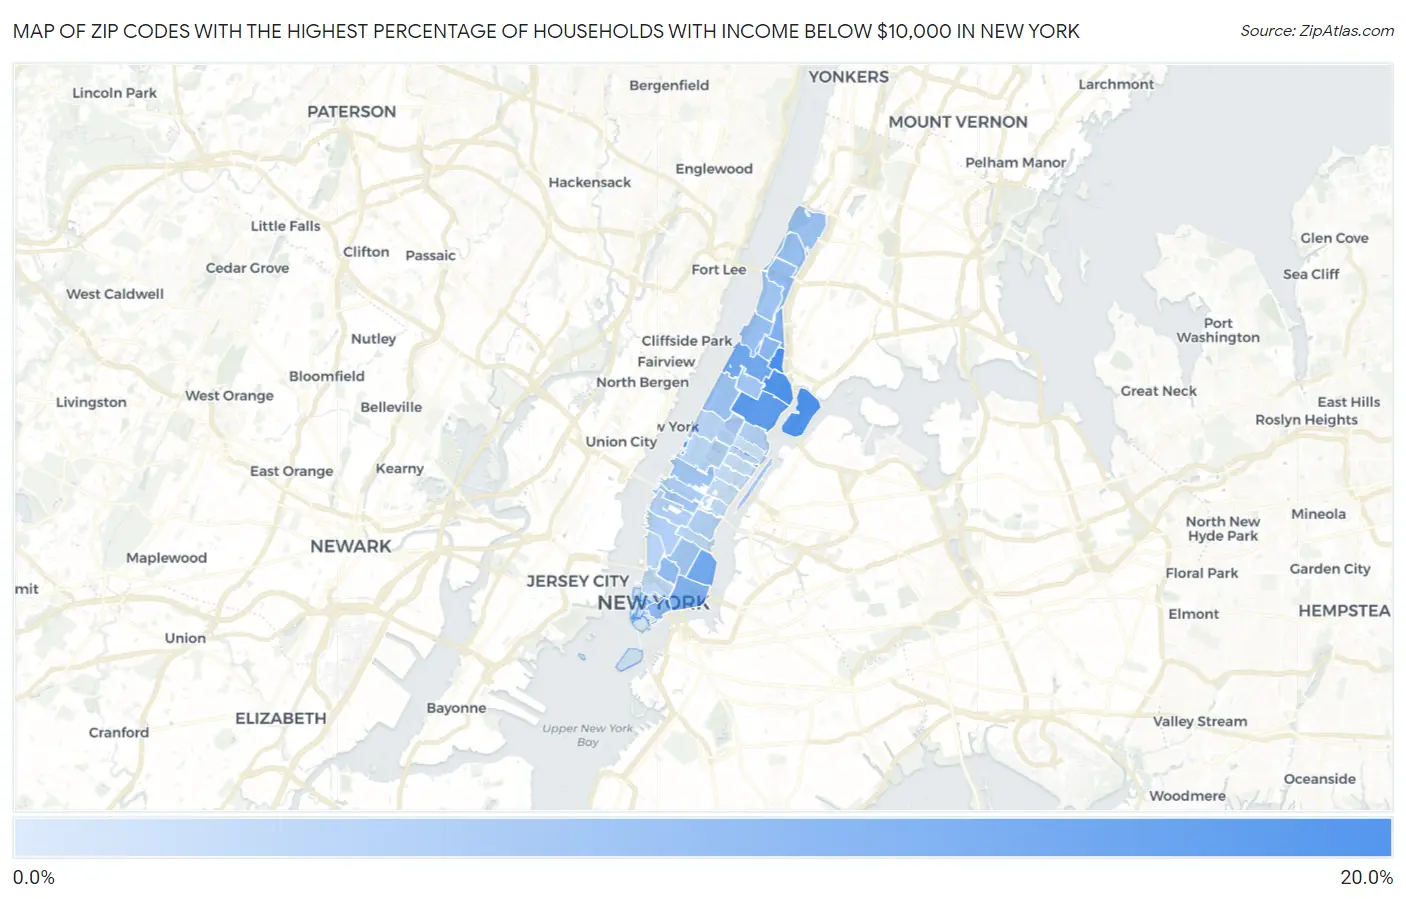
Zip Codes with the Highest Percentage of Households with Income Below $10,000 in New York, NY
RELATED REPORTS & OPTIONS
Household Income | $0-10k
New York
Compare Zip Codes
Map of Zip Codes with the Highest Percentage of Households with Income Below $10,000 in New York
1.0%
16.8%
Zip Codes with the Highest Percentage of Households with Income Below $10,000 in New York, NY
| Zip Code | Households with Income < $10k | vs State | vs National | |
| 1. | 10037 | 16.8% | 5.6%(+11.2)#42 | 4.9%(+11.9)#1,184 |
| 2. | 10035 | 16.1% | 5.6%(+10.5)#44 | 4.9%(+11.2)#1,316 |
| 3. | 10029 | 14.3% | 5.6%(+8.70)#62 | 4.9%(+9.40)#1,685 |
| 4. | 10069 | 13.5% | 5.6%(+7.90)#82 | 4.9%(+8.60)#1,915 |
| 5. | 10027 | 12.3% | 5.6%(+6.70)#102 | 4.9%(+7.40)#2,324 |
| 6. | 10009 | 11.9% | 5.6%(+6.30)#108 | 4.9%(+7.00)#2,498 |
| 7. | 10162 | 11.4% | 5.6%(+5.80)#119 | 4.9%(+6.50)#2,762 |
| 8. | 10039 | 10.4% | 5.6%(+4.80)#140 | 4.9%(+5.50)#3,291 |
| 9. | 10002 | 10.2% | 5.6%(+4.60)#149 | 4.9%(+5.30)#3,423 |
| 10. | 10030 | 9.5% | 5.6%(+3.90)#166 | 4.9%(+4.60)#3,954 |
| 11. | 10038 | 8.9% | 5.6%(+3.30)#201 | 4.9%(+4.00)#4,513 |
| 12. | 10012 | 8.7% | 5.6%(+3.10)#214 | 4.9%(+3.80)#4,730 |
| 13. | 10033 | 8.2% | 5.6%(+2.60)#236 | 4.9%(+3.30)#5,285 |
| 14. | 10031 | 8.1% | 5.6%(+2.50)#248 | 4.9%(+3.20)#5,406 |
| 15. | 10040 | 8.1% | 5.6%(+2.50)#249 | 4.9%(+3.20)#5,409 |
| 16. | 10025 | 7.5% | 5.6%(+1.90)#275 | 4.9%(+2.60)#6,188 |
| 17. | 10034 | 7.5% | 5.6%(+1.90)#277 | 4.9%(+2.60)#6,194 |
| 18. | 10019 | 7.4% | 5.6%(+1.80)#285 | 4.9%(+2.50)#6,340 |
| 19. | 10003 | 7.2% | 5.6%(+1.60)#302 | 4.9%(+2.30)#6,614 |
| 20. | 10032 | 7.1% | 5.6%(+1.50)#313 | 4.9%(+2.20)#6,768 |
| 21. | 10018 | 7.1% | 5.6%(+1.50)#316 | 4.9%(+2.20)#6,827 |
| 22. | 10026 | 6.8% | 5.6%(+1.20)#334 | 4.9%(+1.90)#7,307 |
| 23. | 10044 | 6.5% | 5.6%(+0.900)#361 | 4.9%(+1.60)#7,949 |
| 24. | 10036 | 5.9% | 5.6%(+0.300)#417 | 4.9%(+1.00)#9,223 |
| 25. | 10128 | 5.6% | 5.6%(=0.000)#453 | 4.9%(+0.700)#9,949 |
| 26. | 10016 | 5.3% | 5.6%(-0.300)#498 | 4.9%(+0.400)#10,714 |
| 27. | 10011 | 5.2% | 5.6%(-0.400)#515 | 4.9%(+0.300)#11,043 |
| 28. | 10001 | 5.1% | 5.6%(-0.500)#537 | 4.9%(+0.200)#11,373 |
| 29. | 10024 | 4.7% | 5.6%(-0.900)#603 | 4.9%(-0.200)#12,610 |
| 30. | 10075 | 4.7% | 5.6%(-0.900)#606 | 4.9%(-0.200)#12,680 |
| 31. | 10010 | 4.5% | 5.6%(-1.10)#641 | 4.9%(-0.400)#13,360 |
| 32. | 10023 | 4.4% | 5.6%(-1.20)#654 | 4.9%(-0.500)#13,653 |
| 33. | 10014 | 4.4% | 5.6%(-1.20)#659 | 4.9%(-0.500)#13,704 |
| 34. | 10013 | 4.0% | 5.6%(-1.60)#748 | 4.9%(-0.900)#15,254 |
| 35. | 10017 | 3.9% | 5.6%(-1.70)#770 | 4.9%(-1.00)#15,709 |
| 36. | 10022 | 3.6% | 5.6%(-2.00)#820 | 4.9%(-1.30)#16,831 |
| 37. | 10021 | 3.5% | 5.6%(-2.10)#838 | 4.9%(-1.40)#17,209 |
| 38. | 10065 | 3.4% | 5.6%(-2.20)#864 | 4.9%(-1.50)#17,662 |
| 39. | 10006 | 3.1% | 5.6%(-2.50)#952 | 4.9%(-1.80)#19,078 |
| 40. | 10028 | 3.0% | 5.6%(-2.60)#959 | 4.9%(-1.90)#19,307 |
| 41. | 10007 | 3.0% | 5.6%(-2.60)#969 | 4.9%(-1.90)#19,485 |
| 42. | 10282 | 2.8% | 5.6%(-2.80)#1,019 | 4.9%(-2.10)#20,409 |
| 43. | 10004 | 1.6% | 5.6%(-4.00)#1,288 | 4.9%(-3.30)#25,207 |
| 44. | 10280 | 1.1% | 5.6%(-4.50)#1,362 | 4.9%(-3.80)#26,568 |
| 45. | 10005 | 1.0% | 5.6%(-4.60)#1,376 | 4.9%(-3.90)#26,824 |
1
Common Questions
What are the Top 10 Zip Codes with the Highest Percentage of Households with Income Below $10,000 in New York, NY?
Top 10 Zip Codes with the Highest Percentage of Households with Income Below $10,000 in New York, NY are:
What zip code has the Highest Percentage of Households with Income Below $10,000 in New York, NY?
10037 has the Highest Percentage of Households with Income Below $10,000 in New York, NY with 16.8%.
What is the Percentage of Households with Income Below $10,000 in New York, NY?
Percentage of Households with Income Below $10,000 in New York is 7.0%.
What is the Percentage of Households with Income Below $10,000 in New York?
Percentage of Households with Income Below $10,000 in New York is 5.6%.
What is the Percentage of Households with Income Below $10,000 in the United States?
Percentage of Households with Income Below $10,000 in the United States is 4.9%.