Zip Codes with the Highest Percentage of Self-Employed / Not Incorporated in New York, NY

RELATED REPORTS & OPTIONS

Self-Employed / Not Incorporated
Population
Families and Households
Female Fertility
Female Fertility (Unmarried)
Race (Community Size)
Race (Percentage)
Ancestry (Community Size)
AfghanAfricanAlbanianAlsatianAmericanApacheArabArgentineanArmenianAssyrian / Chaldean / SyriacAustralianAustrianBahamianBarbadianBasqueBelgianBelizeanBermudanBhutaneseBlackfeetBolivianBrazilianBritishBritish West IndianBulgarianBurmeseCajunCambodianCanadianCape VerdeanCarpatho RusynCelticCentral AmericanCentral American IndianCherokeeChickasawChileanChippewaChoctawColombianCosta RicanCreekCroatianCubanCypriotCzechCzechoslovakianDanishDelawareDominicanDutchDutch West IndianEastern EuropeanEcuadorianEgyptianEnglishEstonianEthiopianEuropeanFilipinoFinnishFrenchFrench American IndianFrench CanadianGermanGhanaianGreekGuamanian / ChamorroGuatemalanGuyaneseHaitianHmongHonduranHungarianIcelanderIndian (Asian)IndonesianIranianIraqiIrishIroquoisIsraeliItalianJamaicanJapaneseJordanianKenyanKoreanLaotianLatvianLebaneseLiberianLithuanianLuxembourgerMacedonianMalaysianMalteseMexicanMexican American IndianMongolianMoroccanNative HawaiianNew ZealanderNicaraguanNigerianNorthern EuropeanNorwegianOkinawanPakistaniPalestinianPanamanianParaguayanPennsylvania GermanPeruvianPolishPortuguesePuebloPuerto RicanRomanianRussianSalvadoranSamoanScandinavianScotch-IrishScottishSenegaleseSerbianSierra LeoneanSiouxSlavicSlovakSloveneSomaliSouth AfricanSouth AmericanSouth American IndianSoviet UnionSpaniardSpanishSpanish AmericanSpanish American IndianSri LankanSubsaharan AfricanSudaneseSwedishSwissSyrianThaiTrinidadian and TobagonianTurkishU.S. Virgin IslanderUgandanUkrainianUruguayanVenezuelanVietnameseWelshWest IndianYugoslavianZimbabwean
Ancestry (Percentage)
AfghanAfricanAlbanianAlsatianAmericanApacheArabArgentineanArmenianAssyrian / Chaldean / SyriacAustralianAustrianBahamianBarbadianBasqueBelgianBelizeanBermudanBhutaneseBlackfeetBolivianBrazilianBritishBritish West IndianBulgarianBurmeseCajunCambodianCanadianCape VerdeanCarpatho RusynCelticCentral AmericanCentral American IndianCherokeeChickasawChileanChippewaChoctawColombianCosta RicanCreekCroatianCubanCypriotCzechCzechoslovakianDanishDelawareDominicanDutchDutch West IndianEastern EuropeanEcuadorianEgyptianEnglishEstonianEthiopianEuropeanFilipinoFinnishFrenchFrench American IndianFrench CanadianGermanGhanaianGreekGuamanian / ChamorroGuatemalanGuyaneseHaitianHmongHonduranHungarianIcelanderIndian (Asian)IndonesianIranianIraqiIrishIroquoisIsraeliItalianJamaicanJapaneseJordanianKenyanKoreanLaotianLatvianLebaneseLiberianLithuanianLuxembourgerMacedonianMalaysianMalteseMexicanMexican American IndianMongolianMoroccanNative HawaiianNew ZealanderNicaraguanNigerianNorthern EuropeanNorwegianOkinawanPakistaniPalestinianPanamanianParaguayanPennsylvania GermanPeruvianPolishPortuguesePuebloPuerto RicanRomanianRussianSalvadoranSamoanScandinavianScotch-IrishScottishSenegaleseSerbianSierra LeoneanSiouxSlavicSlovakSloveneSomaliSouth AfricanSouth AmericanSouth American IndianSoviet UnionSpaniardSpanishSpanish AmericanSpanish American IndianSri LankanSubsaharan AfricanSudaneseSwedishSwissSyrianThaiTrinidadian and TobagonianTurkishU.S. Virgin IslanderUgandanUkrainianUruguayanVenezuelanVietnameseWelshWest IndianYugoslavianZimbabwean
Immigrant Origin (Total)
AfghanistanAfricaAlbaniaArgentinaArmeniaAsiaAustraliaAustriaBahamasBangladeshBarbadosBelarusBelgiumBelizeBoliviaBosnia and HerzegovinaBrazilBulgariaBurma / MyanmarCambodiaCameroonCanadaCaribbeanCentral AmericaChileChinaColombiaCongoCosta RicaCroatiaCubaCzechoslovakiaDenmarkDominicaDominican RepublicEastern AfricaEastern AsiaEastern EuropeEcuadorEgyptEl SalvadorEnglandEritreaEthiopiaEuropeFranceGermanyGhanaGreeceGrenadaGuatemalaGuyanaHaitiHondurasHong KongHungaryIndiaIndonesiaIranIraqIrelandIsraelItalyJamaicaJapanJordanKazakhstanKenyaKoreaKuwaitLatin AmericaLatviaLebanonLiberiaLithuaniaMalaysiaMexicoMiddle AfricaMoldovaMoroccoNepalNetherlandsNicaraguaNigeriaNorth MacedoniaNorthern AfricaNorthern EuropeNorwayOceaniaPakistanPanamaPeruPhilippinesPolandPortugalRomaniaRussiaSaudi ArabiaScotlandSenegalSerbiaSierra LeoneSingaporeSomaliaSouth AfricaSouth AmericaSouth Central AsiaSouth Eastern AsiaSouthern EuropeSpainSri LankaSt. Vincent and the GrenadinesSudanSwedenSwitzerlandSyriaTaiwanThailandTrinidad and TobagoTurkeyUgandaUkraineUruguayUzbekistanVenezuelaVietnamWest IndiesWestern AfricaWestern AsiaWestern EuropeYemenZaireZimbabwe
Immigrant Origin (Percentage)
AfghanistanAfricaAlbaniaArgentinaArmeniaAsiaAustraliaAustriaBahamasBangladeshBarbadosBelarusBelgiumBelizeBoliviaBosnia and HerzegovinaBrazilBulgariaBurma / MyanmarCambodiaCameroonCanadaCaribbeanCentral AmericaChileChinaColombiaCongoCosta RicaCroatiaCubaCzechoslovakiaDenmarkDominicaDominican RepublicEastern AfricaEastern AsiaEastern EuropeEcuadorEgyptEl SalvadorEnglandEritreaEthiopiaEuropeFranceGermanyGhanaGreeceGrenadaGuatemalaGuyanaHaitiHondurasHong KongHungaryIndiaIndonesiaIranIraqIrelandIsraelItalyJamaicaJapanJordanKazakhstanKenyaKoreaKuwaitLatin AmericaLatviaLebanonLiberiaLithuaniaMalaysiaMexicoMiddle AfricaMoldovaMoroccoNepalNetherlandsNicaraguaNigeriaNorth MacedoniaNorthern AfricaNorthern EuropeNorwayOceaniaPakistanPanamaPeruPhilippinesPolandPortugalRomaniaRussiaSaudi ArabiaScotlandSenegalSerbiaSierra LeoneSingaporeSomaliaSouth AfricaSouth AmericaSouth Central AsiaSouth Eastern AsiaSouthern EuropeSpainSri LankaSt. Vincent and the GrenadinesSudanSwedenSwitzerlandSyriaTaiwanThailandTrinidad and TobagoTurkeyUgandaUkraineUruguayUzbekistanVenezuelaVietnamWest IndiesWestern AfricaWestern AsiaWestern EuropeYemenZaireZimbabwe
Income
Income (Families)
Income (Households)
Poverty
Poverty (Families)
Unemployment
Employment Occupations
Employment Industries
Employer Class
Commute Time
Commute Means
School Enrollment
Education by Degree Field
Occupancy
Finances
Physical Characteristics
New York
Compare Zip Codes
Comparison Subject

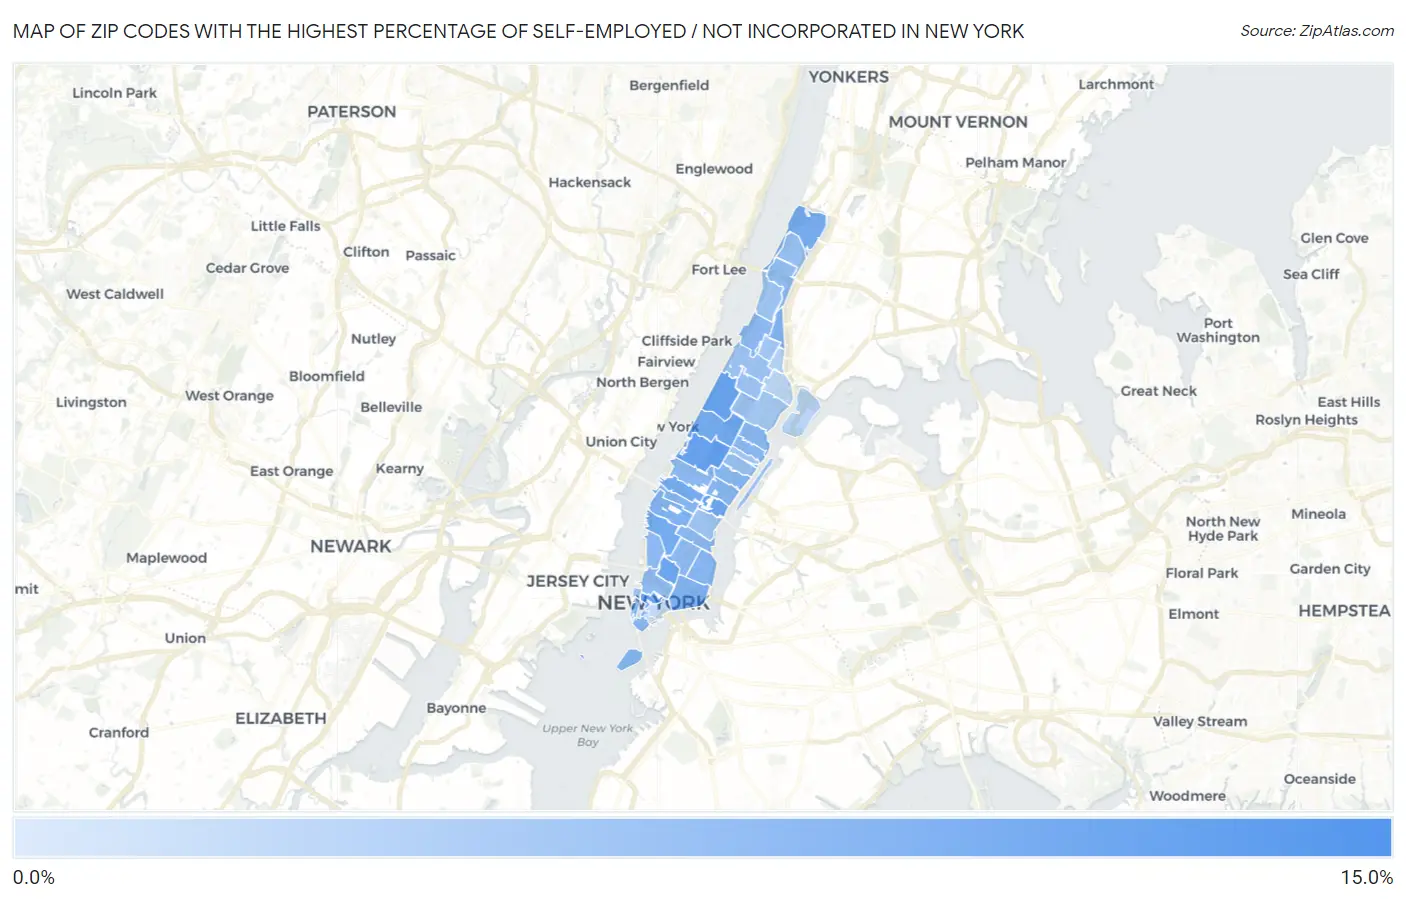
Map of Zip Codes with the Highest Percentage of Self-Employed / Not Incorporated in New York

0.0%
15.0%
Zip Codes with the Highest Percentage of Self-Employed / Not Incorporated in New York Map

Zip Codes with the Highest Percentage of Self-Employed / Not Incorporated in New York, NY

Zip Code % Self-Employed / Not Incorporated vs State vs National
1.1027912.5%5.5%(+7.01)#1995.8%(+6.68)#4,893
2.100259.7%5.5%(+4.19)#3125.8%(+3.87)#7,764
3.100239.7%5.5%(+4.16)#3165.8%(+3.84)#7,811
4.100179.4%5.5%(+3.94)#3305.8%(+3.62)#8,103
5.100129.4%5.5%(+3.90)#3325.8%(+3.58)#8,157
6.100079.0%5.5%(+3.48)#3665.8%(+3.16)#8,810
7.100248.5%5.5%(+3.04)#4105.8%(+2.72)#9,601
8.100368.5%5.5%(+3.03)#4115.8%(+2.71)#9,605
9.100118.5%5.5%(+3.02)#4125.8%(+2.70)#9,624
10.100348.5%5.5%(+2.99)#4135.8%(+2.67)#9,682
11.100017.7%5.5%(+2.18)#5065.8%(+1.85)#11,376
12.100027.5%5.5%(+1.97)#5295.8%(+1.65)#11,853
13.100397.4%5.5%(+1.93)#5355.8%(+1.61)#11,950
14.100657.1%5.5%(+1.60)#5695.8%(+1.28)#12,754
15.100187.0%5.5%(+1.55)#5825.8%(+1.23)#12,927
16.100097.0%5.5%(+1.50)#5945.8%(+1.18)#13,061
17.101287.0%5.5%(+1.49)#5975.8%(+1.16)#13,106
18.100227.0%5.5%(+1.48)#5985.8%(+1.15)#13,136
19.100107.0%5.5%(+1.47)#5995.8%(+1.15)#13,153
20.100696.9%5.5%(+1.36)#6095.8%(+1.04)#13,428
21.100286.8%5.5%(+1.33)#6135.8%(+1.01)#13,511
22.100046.8%5.5%(+1.32)#6175.8%(+0.998)#13,556
23.100196.8%5.5%(+1.26)#6255.8%(+0.942)#13,707
24.100316.7%5.5%(+1.19)#6355.8%(+0.871)#13,901
25.100036.5%5.5%(+1.05)#6595.8%(+0.731)#14,323
26.100146.5%5.5%(+1.03)#6665.8%(+0.705)#14,412
27.100136.4%5.5%(+0.895)#6825.8%(+0.574)#14,819
28.100336.1%5.5%(+0.561)#7345.8%(+0.241)#15,887
29.100215.9%5.5%(+0.431)#7625.8%(+0.110)#16,303
30.100405.8%5.5%(+0.294)#7895.8%(-0.027)#16,744
31.102805.7%5.5%(+0.159)#8155.8%(-0.162)#17,218
32.100275.6%5.5%(+0.135)#8235.8%(-0.185)#17,299
33.101625.6%5.5%(+0.078)#8345.8%(-0.242)#17,515
34.100265.5%5.5%(-0.003)#8515.8%(-0.324)#17,808
35.100445.3%5.5%(-0.161)#8775.8%(-0.482)#18,377
36.102825.3%5.5%(-0.180)#8825.8%(-0.501)#18,461
37.100165.3%5.5%(-0.223)#8945.8%(-0.544)#18,616
38.100325.2%5.5%(-0.253)#8995.8%(-0.573)#18,744
39.100294.8%5.5%(-0.695)#9985.8%(-1.02)#20,409
40.100304.8%5.5%(-0.725)#1,0085.8%(-1.05)#20,544
41.100754.6%5.5%(-0.922)#1,0565.8%(-1.24)#21,266
42.100373.6%5.5%(-1.91)#1,2915.8%(-2.24)#24,777
43.100353.0%5.5%(-2.49)#1,3885.8%(-2.81)#26,355
44.100382.2%5.5%(-3.32)#1,4955.8%(-3.64)#27,993
45.100051.5%5.5%(-4.02)#1,5415.8%(-4.34)#28,766
46.100060.27%5.5%(-5.22)#1,5705.8%(-5.54)#29,467

Common Questions

What are the Top 10 Zip Codes with the Highest Percentage of Self-Employed / Not Incorporated in New York, NY?
Top 10 Zip Codes with the Highest Percentage of Self-Employed / Not Incorporated in New York, NY are:
#1
12.5%
#2
9.7%
#3
9.7%
#4
9.4%
#5
9.4%
#6
9.0%
#7
8.5%
#8
8.5%
#9
8.5%
#10
8.5%
What zip code has the Highest Percentage of Self-Employed / Not Incorporated in New York, NY?
10279 has the Highest Percentage of Self-Employed / Not Incorporated in New York, NY with 12.5%.
What is the Percentage of Self-Employed / Not Incorporated in New York, NY?
Percentage of Self-Employed / Not Incorporated in New York is 6.0%.
What is the Percentage of Self-Employed / Not Incorporated in New York?
Percentage of Self-Employed / Not Incorporated in New York is 5.5%.
What is the Percentage of Self-Employed / Not Incorporated in the United States?
Percentage of Self-Employed / Not Incorporated in the United States is 5.8%.