Zip Codes with the Highest Percentage of Population Employed in Arts, Entertainment & Recreation in New York, NY

RELATED REPORTS & OPTIONS

Arts, Entertainment & Recreation
Population
Families and Households
Female Fertility
Female Fertility (Unmarried)
Race (Community Size)
Race (Percentage)
Ancestry (Community Size)
AfghanAfricanAlbanianAlsatianAmericanApacheArabArgentineanArmenianAssyrian / Chaldean / SyriacAustralianAustrianBahamianBarbadianBasqueBelgianBelizeanBermudanBhutaneseBlackfeetBolivianBrazilianBritishBritish West IndianBulgarianBurmeseCajunCambodianCanadianCape VerdeanCarpatho RusynCelticCentral AmericanCentral American IndianCherokeeChickasawChileanChippewaChoctawColombianCosta RicanCreekCroatianCubanCypriotCzechCzechoslovakianDanishDelawareDominicanDutchDutch West IndianEastern EuropeanEcuadorianEgyptianEnglishEstonianEthiopianEuropeanFilipinoFinnishFrenchFrench American IndianFrench CanadianGermanGhanaianGreekGuamanian / ChamorroGuatemalanGuyaneseHaitianHmongHonduranHungarianIcelanderIndian (Asian)IndonesianIranianIraqiIrishIroquoisIsraeliItalianJamaicanJapaneseJordanianKenyanKoreanLaotianLatvianLebaneseLiberianLithuanianLuxembourgerMacedonianMalaysianMalteseMexicanMexican American IndianMongolianMoroccanNative HawaiianNew ZealanderNicaraguanNigerianNorthern EuropeanNorwegianOkinawanPakistaniPalestinianPanamanianParaguayanPennsylvania GermanPeruvianPolishPortuguesePuebloPuerto RicanRomanianRussianSalvadoranSamoanScandinavianScotch-IrishScottishSenegaleseSerbianSierra LeoneanSiouxSlavicSlovakSloveneSomaliSouth AfricanSouth AmericanSouth American IndianSoviet UnionSpaniardSpanishSpanish AmericanSpanish American IndianSri LankanSubsaharan AfricanSudaneseSwedishSwissSyrianThaiTrinidadian and TobagonianTurkishU.S. Virgin IslanderUgandanUkrainianUruguayanVenezuelanVietnameseWelshWest IndianYugoslavianZimbabwean
Ancestry (Percentage)
AfghanAfricanAlbanianAlsatianAmericanApacheArabArgentineanArmenianAssyrian / Chaldean / SyriacAustralianAustrianBahamianBarbadianBasqueBelgianBelizeanBermudanBhutaneseBlackfeetBolivianBrazilianBritishBritish West IndianBulgarianBurmeseCajunCambodianCanadianCape VerdeanCarpatho RusynCelticCentral AmericanCentral American IndianCherokeeChickasawChileanChippewaChoctawColombianCosta RicanCreekCroatianCubanCypriotCzechCzechoslovakianDanishDelawareDominicanDutchDutch West IndianEastern EuropeanEcuadorianEgyptianEnglishEstonianEthiopianEuropeanFilipinoFinnishFrenchFrench American IndianFrench CanadianGermanGhanaianGreekGuamanian / ChamorroGuatemalanGuyaneseHaitianHmongHonduranHungarianIcelanderIndian (Asian)IndonesianIranianIraqiIrishIroquoisIsraeliItalianJamaicanJapaneseJordanianKenyanKoreanLaotianLatvianLebaneseLiberianLithuanianLuxembourgerMacedonianMalaysianMalteseMexicanMexican American IndianMongolianMoroccanNative HawaiianNew ZealanderNicaraguanNigerianNorthern EuropeanNorwegianOkinawanPakistaniPalestinianPanamanianParaguayanPennsylvania GermanPeruvianPolishPortuguesePuebloPuerto RicanRomanianRussianSalvadoranSamoanScandinavianScotch-IrishScottishSenegaleseSerbianSierra LeoneanSiouxSlavicSlovakSloveneSomaliSouth AfricanSouth AmericanSouth American IndianSoviet UnionSpaniardSpanishSpanish AmericanSpanish American IndianSri LankanSubsaharan AfricanSudaneseSwedishSwissSyrianThaiTrinidadian and TobagonianTurkishU.S. Virgin IslanderUgandanUkrainianUruguayanVenezuelanVietnameseWelshWest IndianYugoslavianZimbabwean
Immigrant Origin (Total)
AfghanistanAfricaAlbaniaArgentinaArmeniaAsiaAustraliaAustriaBahamasBangladeshBarbadosBelarusBelgiumBelizeBoliviaBosnia and HerzegovinaBrazilBulgariaBurma / MyanmarCambodiaCameroonCanadaCaribbeanCentral AmericaChileChinaColombiaCongoCosta RicaCroatiaCubaCzechoslovakiaDenmarkDominicaDominican RepublicEastern AfricaEastern AsiaEastern EuropeEcuadorEgyptEl SalvadorEnglandEritreaEthiopiaEuropeFranceGermanyGhanaGreeceGrenadaGuatemalaGuyanaHaitiHondurasHong KongHungaryIndiaIndonesiaIranIraqIrelandIsraelItalyJamaicaJapanJordanKazakhstanKenyaKoreaKuwaitLatin AmericaLatviaLebanonLiberiaLithuaniaMalaysiaMexicoMiddle AfricaMoldovaMoroccoNepalNetherlandsNicaraguaNigeriaNorth MacedoniaNorthern AfricaNorthern EuropeNorwayOceaniaPakistanPanamaPeruPhilippinesPolandPortugalRomaniaRussiaSaudi ArabiaScotlandSenegalSerbiaSierra LeoneSingaporeSomaliaSouth AfricaSouth AmericaSouth Central AsiaSouth Eastern AsiaSouthern EuropeSpainSri LankaSt. Vincent and the GrenadinesSudanSwedenSwitzerlandSyriaTaiwanThailandTrinidad and TobagoTurkeyUgandaUkraineUruguayUzbekistanVenezuelaVietnamWest IndiesWestern AfricaWestern AsiaWestern EuropeYemenZaireZimbabwe
Immigrant Origin (Percentage)
AfghanistanAfricaAlbaniaArgentinaArmeniaAsiaAustraliaAustriaBahamasBangladeshBarbadosBelarusBelgiumBelizeBoliviaBosnia and HerzegovinaBrazilBulgariaBurma / MyanmarCambodiaCameroonCanadaCaribbeanCentral AmericaChileChinaColombiaCongoCosta RicaCroatiaCubaCzechoslovakiaDenmarkDominicaDominican RepublicEastern AfricaEastern AsiaEastern EuropeEcuadorEgyptEl SalvadorEnglandEritreaEthiopiaEuropeFranceGermanyGhanaGreeceGrenadaGuatemalaGuyanaHaitiHondurasHong KongHungaryIndiaIndonesiaIranIraqIrelandIsraelItalyJamaicaJapanJordanKazakhstanKenyaKoreaKuwaitLatin AmericaLatviaLebanonLiberiaLithuaniaMalaysiaMexicoMiddle AfricaMoldovaMoroccoNepalNetherlandsNicaraguaNigeriaNorth MacedoniaNorthern AfricaNorthern EuropeNorwayOceaniaPakistanPanamaPeruPhilippinesPolandPortugalRomaniaRussiaSaudi ArabiaScotlandSenegalSerbiaSierra LeoneSingaporeSomaliaSouth AfricaSouth AmericaSouth Central AsiaSouth Eastern AsiaSouthern EuropeSpainSri LankaSt. Vincent and the GrenadinesSudanSwedenSwitzerlandSyriaTaiwanThailandTrinidad and TobagoTurkeyUgandaUkraineUruguayUzbekistanVenezuelaVietnamWest IndiesWestern AfricaWestern AsiaWestern EuropeYemenZaireZimbabwe
Income
Income (Families)
Income (Households)
Poverty
Poverty (Families)
Unemployment
Employment Occupations
Employment Industries
Employer Class
Commute Time
Commute Means
School Enrollment
Education by Degree Field
Occupancy
Finances
Physical Characteristics
New York
Compare Zip Codes
Comparison Subject

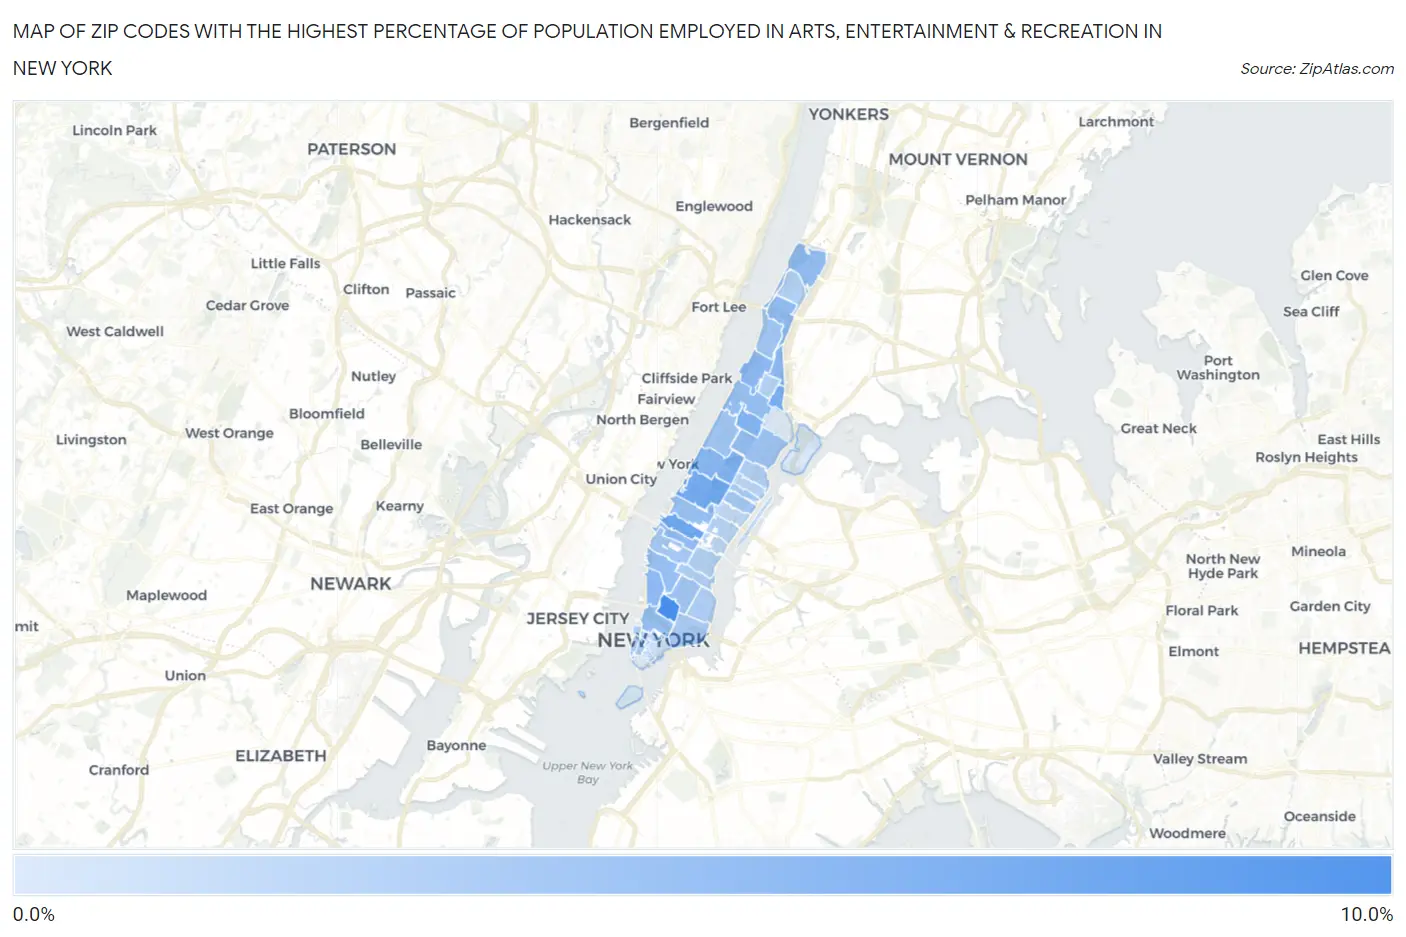
Map of Zip Codes with the Highest Percentage of Population Employed in Arts, Entertainment & Recreation in New York

0.0%
10.0%
Zip Codes with the Highest Percentage of Population Employed in Arts, Entertainment & Recreation in New York Map

Zip Codes with the Highest Percentage of Population Employed in Arts, Entertainment & Recreation in New York, NY

Zip Code % Employed vs State vs National
1.100129.2%2.4%(+6.79)#662.1%(+7.12)#821
2.100366.9%2.4%(+4.52)#1022.1%(+4.85)#1,352
3.100236.6%2.4%(+4.16)#1162.1%(+4.49)#1,465
4.100696.5%2.4%(+4.09)#1192.1%(+4.42)#1,496
5.100376.3%2.4%(+3.90)#1242.1%(+4.24)#1,573
6.100265.8%2.4%(+3.41)#1402.1%(+3.74)#1,790
7.100245.5%2.4%(+3.13)#1522.1%(+3.46)#1,941
8.100395.4%2.4%(+2.97)#1622.1%(+3.30)#2,031
9.100315.4%2.4%(+2.97)#1632.1%(+3.30)#2,033
10.100145.2%2.4%(+2.81)#1692.1%(+3.14)#2,137
11.100185.1%2.4%(+2.71)#1752.1%(+3.04)#2,197
12.100335.0%2.4%(+2.61)#1822.1%(+2.94)#2,273
13.100344.9%2.4%(+2.48)#1942.1%(+2.81)#2,364
14.100274.9%2.4%(+2.47)#1972.1%(+2.80)#2,375
15.100134.8%2.4%(+2.44)#2002.1%(+2.77)#2,398
16.100114.7%2.4%(+2.29)#2132.1%(+2.62)#2,522
17.100194.6%2.4%(+2.23)#2212.1%(+2.56)#2,592
18.100294.6%2.4%(+2.21)#2222.1%(+2.55)#2,605
19.100254.3%2.4%(+1.85)#2552.1%(+2.18)#3,005
20.100034.2%2.4%(+1.78)#2622.1%(+2.11)#3,095
21.100324.2%2.4%(+1.75)#2642.1%(+2.08)#3,130
22.100214.1%2.4%(+1.68)#2742.1%(+2.01)#3,208
23.100014.0%2.4%(+1.58)#2862.1%(+1.92)#3,348
24.100753.9%2.4%(+1.47)#3012.1%(+1.80)#3,507
25.100063.7%2.4%(+1.26)#3272.1%(+1.60)#3,810
26.100023.7%2.4%(+1.24)#3312.1%(+1.58)#3,838
27.100093.5%2.4%(+1.08)#3532.1%(+1.41)#4,156
28.102823.5%2.4%(+1.04)#3592.1%(+1.37)#4,227
29.101283.4%2.4%(+1.01)#3662.1%(+1.34)#4,313
30.100163.4%2.4%(+0.967)#3712.1%(+1.30)#4,399
31.100103.4%2.4%(+0.966)#3722.1%(+1.30)#4,401
32.102803.3%2.4%(+0.882)#3852.1%(+1.21)#4,584
33.100303.2%2.4%(+0.819)#4002.1%(+1.15)#4,720
34.100403.2%2.4%(+0.748)#4152.1%(+1.08)#4,900
35.100223.1%2.4%(+0.697)#4242.1%(+1.03)#5,036
36.100283.0%2.4%(+0.567)#4542.1%(+0.897)#5,416
37.100172.8%2.4%(+0.396)#4932.1%(+0.727)#5,954
38.100072.6%2.4%(+0.170)#5492.1%(+0.501)#6,827
39.100652.6%2.4%(+0.151)#5532.1%(+0.482)#6,893
40.100052.5%2.4%(+0.079)#5732.1%(+0.410)#7,212
41.101622.4%2.4%(-0.025)#5962.1%(+0.306)#7,691
42.100442.3%2.4%(-0.085)#6222.1%(+0.246)#7,988
43.100381.8%2.4%(-0.624)#7942.1%(-0.294)#11,087
44.100351.1%2.4%(-1.32)#1,0832.1%(-0.986)#16,269
45.100040.99%2.4%(-1.42)#1,1252.1%(-1.09)#17,028

Common Questions

What are the Top 10 Zip Codes with the Highest Percentage of Population Employed in Arts, Entertainment & Recreation in New York, NY?
Top 10 Zip Codes with the Highest Percentage of Population Employed in Arts, Entertainment & Recreation in New York, NY are:
#1
9.2%
#2
6.9%
#3
6.6%
#4
6.5%
#5
6.3%
#6
5.8%
#7
5.5%
#8
5.4%
#9
5.4%
#10
5.2%
What zip code has the Highest Percentage of Population Employed in Arts, Entertainment & Recreation in New York, NY?
10012 has the Highest Percentage of Population Employed in Arts, Entertainment & Recreation in New York, NY with 9.2%.
What is the Percentage of Population Employed in Arts, Entertainment & Recreation in New York, NY?
Percentage of Population Employed in Arts, Entertainment & Recreation in New York is 2.8%.
What is the Percentage of Population Employed in Arts, Entertainment & Recreation in New York?
Percentage of Population Employed in Arts, Entertainment & Recreation in New York is 2.4%.
What is the Percentage of Population Employed in Arts, Entertainment & Recreation in the United States?
Percentage of Population Employed in Arts, Entertainment & Recreation in the United States is 2.1%.