Zip Codes with the Highest Percentage of Households Without a Vehicle in New York, NY
RELATED REPORTS & OPTIONS
Households without a Cars
New York
Compare Zip Codes
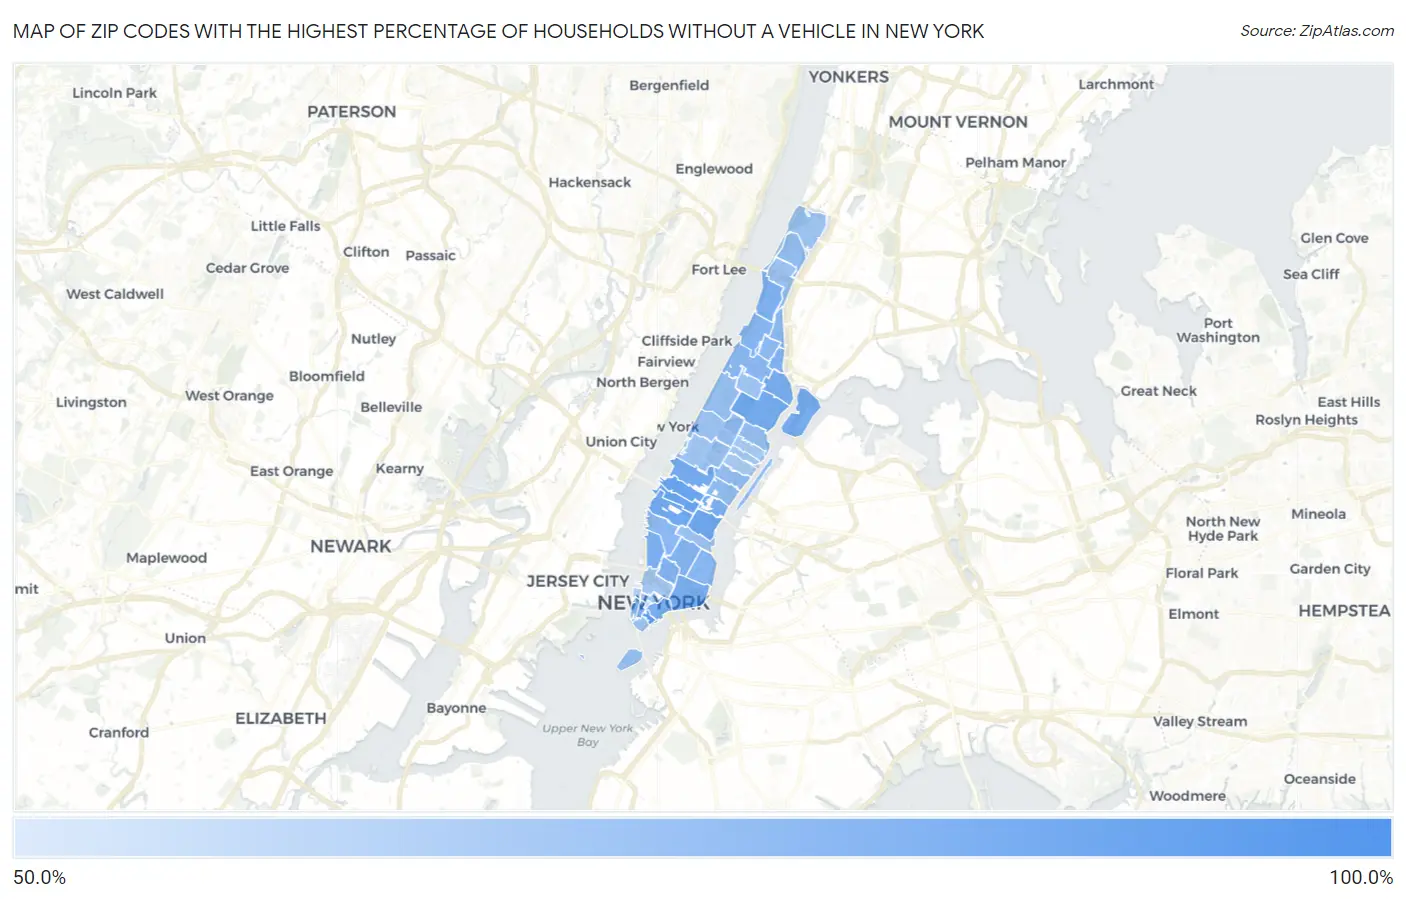
Map of Zip Codes with the Highest Percentage of Households Without a Vehicle in New York
54.5%
100.0%
Zip Codes with the Highest Percentage of Households Without a Vehicle in New York, NY
| Zip Code | Housholds Without a Car | vs State | vs National | |
| 1. | 10279 | 100.0% | 29.0%(+71.0)#2 | 8.3%(+91.7)#28 |
| 2. | 10005 | 92.3% | 29.0%(+63.3)#6 | 8.3%(+84.0)#78 |
| 3. | 10036 | 88.7% | 29.0%(+59.7)#7 | 8.3%(+80.4)#93 |
| 4. | 10018 | 88.4% | 29.0%(+59.4)#8 | 8.3%(+80.1)#95 |
| 5. | 10016 | 86.8% | 29.0%(+57.8)#9 | 8.3%(+78.5)#98 |
| 6. | 10001 | 85.5% | 29.0%(+56.5)#10 | 8.3%(+77.2)#105 |
| 7. | 10029 | 84.8% | 29.0%(+55.8)#11 | 8.3%(+76.5)#108 |
| 8. | 10019 | 84.6% | 29.0%(+55.6)#12 | 8.3%(+76.3)#109 |
| 9. | 10035 | 83.9% | 29.0%(+54.9)#13 | 8.3%(+75.6)#112 |
| 10. | 10038 | 83.3% | 29.0%(+54.3)#14 | 8.3%(+75.0)#115 |
| 11. | 10017 | 82.9% | 29.0%(+53.9)#15 | 8.3%(+74.6)#119 |
| 12. | 10002 | 82.8% | 29.0%(+53.8)#16 | 8.3%(+74.5)#121 |
| 13. | 10014 | 82.6% | 29.0%(+53.6)#17 | 8.3%(+74.3)#122 |
| 14. | 10032 | 82.1% | 29.0%(+53.1)#18 | 8.3%(+73.8)#123 |
| 15. | 10280 | 81.4% | 29.0%(+52.4)#19 | 8.3%(+73.1)#124 |
| 16. | 10037 | 81.3% | 29.0%(+52.3)#20 | 8.3%(+73.0)#125 |
| 17. | 10012 | 80.9% | 29.0%(+51.9)#21 | 8.3%(+72.6)#127 |
| 18. | 10006 | 80.3% | 29.0%(+51.3)#22 | 8.3%(+72.0)#129 |
| 19. | 10003 | 80.2% | 29.0%(+51.2)#24 | 8.3%(+71.9)#131 |
| 20. | 10031 | 79.3% | 29.0%(+50.3)#26 | 8.3%(+71.0)#136 |
| 21. | 10009 | 78.4% | 29.0%(+49.4)#27 | 8.3%(+70.1)#139 |
| 22. | 10027 | 77.9% | 29.0%(+48.9)#28 | 8.3%(+69.6)#141 |
| 23. | 10039 | 77.9% | 29.0%(+48.9)#29 | 8.3%(+69.6)#142 |
| 24. | 10030 | 77.8% | 29.0%(+48.8)#30 | 8.3%(+69.5)#144 |
| 25. | 10011 | 77.3% | 29.0%(+48.3)#31 | 8.3%(+69.0)#145 |
| 26. | 10022 | 75.9% | 29.0%(+46.9)#33 | 8.3%(+67.6)#152 |
| 27. | 10065 | 75.2% | 29.0%(+46.2)#35 | 8.3%(+66.9)#157 |
| 28. | 10128 | 75.1% | 29.0%(+46.1)#36 | 8.3%(+66.8)#158 |
| 29. | 10040 | 75.1% | 29.0%(+46.1)#38 | 8.3%(+66.8)#160 |
| 30. | 10044 | 74.9% | 29.0%(+45.9)#40 | 8.3%(+66.6)#164 |
| 31. | 10025 | 74.4% | 29.0%(+45.4)#41 | 8.3%(+66.1)#165 |
| 32. | 10033 | 73.6% | 29.0%(+44.6)#42 | 8.3%(+65.3)#169 |
| 33. | 10010 | 72.9% | 29.0%(+43.9)#44 | 8.3%(+64.6)#172 |
| 34. | 10004 | 72.9% | 29.0%(+43.9)#45 | 8.3%(+64.6)#173 |
| 35. | 10024 | 72.7% | 29.0%(+43.7)#46 | 8.3%(+64.4)#174 |
| 36. | 10034 | 72.2% | 29.0%(+43.2)#47 | 8.3%(+63.9)#177 |
| 37. | 10026 | 71.6% | 29.0%(+42.6)#51 | 8.3%(+63.3)#182 |
| 38. | 10023 | 71.4% | 29.0%(+42.4)#52 | 8.3%(+63.1)#184 |
| 39. | 10013 | 70.6% | 29.0%(+41.6)#54 | 8.3%(+62.3)#188 |
| 40. | 10075 | 70.4% | 29.0%(+41.4)#55 | 8.3%(+62.1)#189 |
| 41. | 10021 | 69.4% | 29.0%(+40.4)#60 | 8.3%(+61.1)#197 |
| 42. | 10007 | 69.2% | 29.0%(+40.2)#61 | 8.3%(+60.9)#201 |
| 43. | 10028 | 69.0% | 29.0%(+40.0)#63 | 8.3%(+60.7)#203 |
| 44. | 10282 | 67.4% | 29.0%(+38.4)#67 | 8.3%(+59.1)#215 |
| 45. | 10069 | 66.6% | 29.0%(+37.6)#72 | 8.3%(+58.3)#225 |
| 46. | 10162 | 54.5% | 29.0%(+25.5)#99 | 8.3%(+46.2)#312 |
1
Common Questions
What are the Top 10 Zip Codes with the Highest Percentage of Households Without a Vehicle in New York, NY?
Top 10 Zip Codes with the Highest Percentage of Households Without a Vehicle in New York, NY are:
What zip code has the Highest Percentage of Households Without a Vehicle in New York, NY?
10279 has the Highest Percentage of Households Without a Vehicle in New York, NY with 100.0%.
What is the Percentage of Households Without a Vehicle in New York, NY?
Percentage of Households Without a Vehicle in New York is 54.7%.
What is the Percentage of Households Without a Vehicle in New York?
Percentage of Households Without a Vehicle in New York is 29.0%.
What is the Percentage of Households Without a Vehicle in the United States?
Percentage of Households Without a Vehicle in the United States is 8.3%.