Zip Codes with the Highest Percentage of Not-for-profit Organizations in Montana
RELATED REPORTS & OPTIONS
Not-for-profit Organizations
Montana
Compare Zip Codes
Map of Zip Codes with the Highest Percentage of Not-for-profit Organizations in Montana
0.0%
100.0%
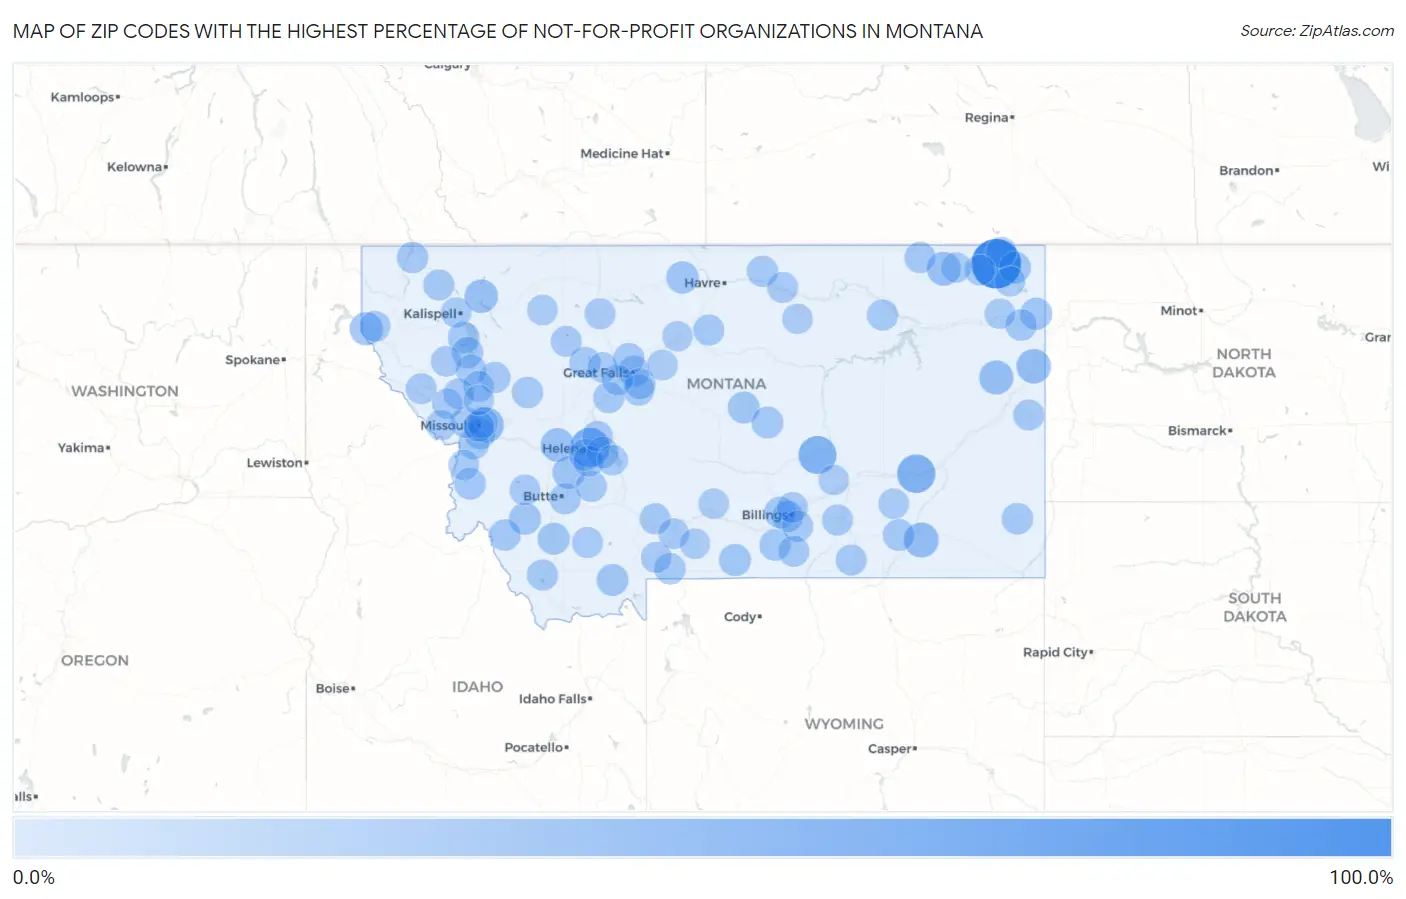
Zip Codes with the Highest Percentage of Not-for-profit Organizations in Montana
| Zip Code | % Employed in Not-for-profit | vs State | vs National | |
| 1. | 59257 | 100.0% | 9.9% (+90.1)#1 | 8.4% (+91.6)#17 |
| 2. | 59625 | 51.0% | 9.9% (+41.1)#2 | 8.4% (+42.5)#124 |
| 3. | 59333 | 45.5% | 9.9% (+35.6)#3 | 8.4% (+37.0)#187 |
| 4. | 59059 | 44.3% | 9.9% (+34.4)#4 | 8.4% (+35.8)#192 |
| 5. | 59851 | 31.2% | 9.9% (+21.4)#5 | 8.4% (+22.8)#409 |
| 6. | 59003 | 29.6% | 9.9% (+19.8)#6 | 8.4% (+21.2)#462 |
| 7. | 59217 | 27.8% | 9.9% (+17.9)#7 | 8.4% (+19.3)#531 |
| 8. | 59315 | 26.2% | 9.9% (+16.3)#8 | 8.4% (+17.7)#620 |
| 9. | 59253 | 24.6% | 9.9% (+14.7)#9 | 8.4% (+16.1)#738 |
| 10. | 59713 | 23.4% | 9.9% (+13.6)#10 | 8.4% (+15.0)#836 |
| 11. | 59913 | 23.0% | 9.9% (+13.1)#11 | 8.4% (+14.5)#883 |
| 12. | 59844 | 22.1% | 9.9% (+12.2)#12 | 8.4% (+13.6)#1,001 |
| 13. | 59631 | 19.3% | 9.9% (+9.39)#13 | 8.4% (+10.8)#1,433 |
| 14. | 59528 | 17.6% | 9.9% (+7.79)#14 | 8.4% (+9.20)#1,810 |
| 15. | 59068 | 16.5% | 9.9% (+6.64)#15 | 8.4% (+8.05)#2,234 |
| 16. | 59762 | 16.4% | 9.9% (+6.51)#16 | 8.4% (+7.92)#2,294 |
| 17. | 59732 | 16.2% | 9.9% (+6.32)#17 | 8.4% (+7.73)#2,371 |
| 18. | 59254 | 16.1% | 9.9% (+6.24)#18 | 8.4% (+7.65)#2,405 |
| 19. | 59212 | 15.8% | 9.9% (+5.98)#19 | 8.4% (+7.39)#2,513 |
| 20. | 59457 | 15.7% | 9.9% (+5.81)#20 | 8.4% (+7.23)#2,593 |
| 21. | 59720 | 15.6% | 9.9% (+5.73)#21 | 8.4% (+7.14)#2,634 |
| 22. | 59601 | 15.3% | 9.9% (+5.47)#22 | 8.4% (+6.88)#2,764 |
| 23. | 59043 | 15.0% | 9.9% (+5.18)#23 | 8.4% (+6.60)#2,921 |
| 24. | 59931 | 15.0% | 9.9% (+5.18)#24 | 8.4% (+6.59)#2,923 |
| 25. | 59441 | 15.0% | 9.9% (+5.14)#25 | 8.4% (+6.56)#2,943 |
| 26. | 59840 | 14.6% | 9.9% (+4.75)#26 | 8.4% (+6.16)#3,173 |
| 27. | 59860 | 14.4% | 9.9% (+4.54)#27 | 8.4% (+5.95)#3,313 |
| 28. | 59218 | 14.1% | 9.9% (+4.21)#28 | 8.4% (+5.62)#3,534 |
| 29. | 59761 | 14.0% | 9.9% (+4.11)#29 | 8.4% (+5.52)#3,625 |
| 30. | 59029 | 13.8% | 9.9% (+3.94)#30 | 8.4% (+5.36)#3,758 |
| 31. | 59106 | 13.7% | 9.9% (+3.87)#31 | 8.4% (+5.29)#3,816 |
| 32. | 59324 | 13.5% | 9.9% (+3.63)#32 | 8.4% (+5.04)#4,021 |
| 33. | 59102 | 13.4% | 9.9% (+3.50)#33 | 8.4% (+4.92)#4,152 |
| 34. | 59635 | 13.3% | 9.9% (+3.46)#34 | 8.4% (+4.87)#4,209 |
| 35. | 59030 | 13.3% | 9.9% (+3.41)#35 | 8.4% (+4.82)#4,252 |
| 36. | 59930 | 13.2% | 9.9% (+3.38)#36 | 8.4% (+4.79)#4,283 |
| 37. | 59401 | 13.2% | 9.9% (+3.33)#37 | 8.4% (+4.74)#4,330 |
| 38. | 59854 | 13.0% | 9.9% (+3.19)#38 | 8.4% (+4.60)#4,463 |
| 39. | 59404 | 13.0% | 9.9% (+3.16)#39 | 8.4% (+4.57)#4,489 |
| 40. | 59547 | 12.9% | 9.9% (+3.05)#40 | 8.4% (+4.46)#4,595 |
| 41. | 59701 | 12.7% | 9.9% (+2.81)#41 | 8.4% (+4.23)#4,861 |
| 42. | 59240 | 12.5% | 9.9% (+2.64)#42 | 8.4% (+4.06)#5,053 |
| 43. | 59405 | 12.5% | 9.9% (+2.63)#43 | 8.4% (+4.05)#5,060 |
| 44. | 59230 | 12.3% | 9.9% (+2.48)#44 | 8.4% (+3.90)#5,211 |
| 45. | 59520 | 12.3% | 9.9% (+2.40)#45 | 8.4% (+3.82)#5,303 |
| 46. | 59725 | 12.2% | 9.9% (+2.35)#46 | 8.4% (+3.77)#5,356 |
| 47. | 59436 | 12.2% | 9.9% (+2.35)#47 | 8.4% (+3.77)#5,359 |
| 48. | 59421 | 12.2% | 9.9% (+2.32)#48 | 8.4% (+3.73)#5,401 |
| 49. | 59632 | 12.1% | 9.9% (+2.27)#49 | 8.4% (+3.69)#5,471 |
| 50. | 59101 | 12.0% | 9.9% (+2.18)#50 | 8.4% (+3.59)#5,592 |
| 51. | 59353 | 12.0% | 9.9% (+2.10)#51 | 8.4% (+3.51)#5,689 |
| 52. | 59715 | 11.9% | 9.9% (+2.05)#52 | 8.4% (+3.46)#5,756 |
| 53. | 59927 | 11.8% | 9.9% (+1.97)#53 | 8.4% (+3.38)#5,854 |
| 54. | 59252 | 11.8% | 9.9% (+1.91)#54 | 8.4% (+3.32)#5,952 |
| 55. | 59472 | 11.7% | 9.9% (+1.88)#55 | 8.4% (+3.30)#5,980 |
| 56. | 59066 | 11.7% | 9.9% (+1.88)#56 | 8.4% (+3.29)#5,984 |
| 57. | 59803 | 11.7% | 9.9% (+1.86)#57 | 8.4% (+3.27)#6,023 |
| 58. | 59034 | 11.6% | 9.9% (+1.78)#58 | 8.4% (+3.19)#6,134 |
| 59. | 59826 | 11.6% | 9.9% (+1.77)#59 | 8.4% (+3.18)#6,147 |
| 60. | 59050 | 11.6% | 9.9% (+1.71)#60 | 8.4% (+3.12)#6,225 |
| 61. | 59833 | 11.6% | 9.9% (+1.71)#61 | 8.4% (+3.12)#6,227 |
| 62. | 59425 | 11.4% | 9.9% (+1.52)#62 | 8.4% (+2.94)#6,482 |
| 63. | 59749 | 11.3% | 9.9% (+1.47)#63 | 8.4% (+2.88)#6,546 |
| 64. | 59485 | 11.3% | 9.9% (+1.43)#64 | 8.4% (+2.84)#6,607 |
| 65. | 59027 | 11.3% | 9.9% (+1.41)#65 | 8.4% (+2.82)#6,636 |
| 66. | 59804 | 11.3% | 9.9% (+1.41)#66 | 8.4% (+2.82)#6,643 |
| 67. | 59634 | 11.2% | 9.9% (+1.31)#67 | 8.4% (+2.72)#6,789 |
| 68. | 59864 | 11.1% | 9.9% (+1.28)#68 | 8.4% (+2.69)#6,841 |
| 69. | 59802 | 11.0% | 9.9% (+1.16)#69 | 8.4% (+2.57)#7,037 |
| 70. | 59526 | 11.0% | 9.9% (+1.15)#70 | 8.4% (+2.57)#7,052 |
| 71. | 59865 | 11.0% | 9.9% (+1.14)#71 | 8.4% (+2.56)#7,066 |
| 72. | 59422 | 10.9% | 9.9% (+1.05)#72 | 8.4% (+2.47)#7,204 |
| 73. | 59711 | 10.7% | 9.9% (+0.857)#73 | 8.4% (+2.27)#7,524 |
| 74. | 59105 | 10.7% | 9.9% (+0.844)#74 | 8.4% (+2.26)#7,552 |
| 75. | 59866 | 10.7% | 9.9% (+0.836)#75 | 8.4% (+2.25)#7,571 |
| 76. | 59801 | 10.7% | 9.9% (+0.806)#76 | 8.4% (+2.22)#7,629 |
| 77. | 59047 | 10.5% | 9.9% (+0.682)#77 | 8.4% (+2.10)#7,844 |
| 78. | 59831 | 10.5% | 9.9% (+0.644)#78 | 8.4% (+2.06)#7,904 |
| 79. | 59602 | 10.5% | 9.9% (+0.602)#79 | 8.4% (+2.02)#7,990 |
| 80. | 59853 | 10.3% | 9.9% (+0.454)#80 | 8.4% (+1.87)#8,271 |
| 81. | 59647 | 10.1% | 9.9% (+0.261)#81 | 8.4% (+1.67)#8,670 |
| 82. | 59846 | 10.1% | 9.9% (+0.237)#82 | 8.4% (+1.65)#8,728 |
| 83. | 59222 | 10.1% | 9.9% (+0.234)#83 | 8.4% (+1.65)#8,736 |
| 84. | 59845 | 10.1% | 9.9% (+0.217)#84 | 8.4% (+1.63)#8,760 |
| 85. | 59875 | 9.8% | 9.9% (-0.027)#85 | 8.4% (+1.39)#9,243 |
| 86. | 59448 | 9.8% | 9.9% (-0.091)#86 | 8.4% (+1.32)#9,374 |
| 87. | 59323 | 9.7% | 9.9% (-0.113)#87 | 8.4% (+1.30)#9,430 |
| 88. | 59450 | 9.4% | 9.9% (-0.446)#88 | 8.4% (+0.967)#10,141 |
| 89. | 59011 | 9.4% | 9.9% (-0.493)#89 | 8.4% (+0.920)#10,235 |
| 90. | 59443 | 9.4% | 9.9% (-0.495)#90 | 8.4% (+0.919)#10,238 |
| 91. | 59213 | 9.2% | 9.9% (-0.614)#91 | 8.4% (+0.799)#10,482 |
| 92. | 59821 | 9.2% | 9.9% (-0.617)#92 | 8.4% (+0.797)#10,490 |
| 93. | 59820 | 9.0% | 9.9% (-0.826)#93 | 8.4% (+0.588)#10,979 |
| 94. | 59901 | 9.0% | 9.9% (-0.828)#94 | 8.4% (+0.585)#10,985 |
| 95. | 59024 | 9.0% | 9.9% (-0.893)#95 | 8.4% (+0.521)#11,143 |
| 96. | 59052 | 9.0% | 9.9% (-0.903)#96 | 8.4% (+0.511)#11,168 |
| 97. | 59263 | 8.9% | 9.9% (-0.942)#97 | 8.4% (+0.472)#11,267 |
| 98. | 59524 | 8.9% | 9.9% (-0.958)#98 | 8.4% (+0.456)#11,308 |
| 99. | 59442 | 8.8% | 9.9% (-1.05)#99 | 8.4% (+0.368)#11,534 |
| 100. | 59258 | 8.8% | 9.9% (-1.07)#100 | 8.4% (+0.347)#11,584 |
Common Questions
What are the Top 10 Zip Codes with the Highest Percentage of Not-for-profit Organizations in Montana?
Top 10 Zip Codes with the Highest Percentage of Not-for-profit Organizations in Montana are:
What zip code has the Highest Percentage of Not-for-profit Organizations in Montana?
59257 has the Highest Percentage of Not-for-profit Organizations in Montana with 100.0%.
What is the Percentage of Not-for-profit Organizations in the State of Montana?
Percentage of Not-for-profit Organizations in Montana is 9.9%.
What is the Percentage of Not-for-profit Organizations in the United States?
Percentage of Not-for-profit Organizations in the United States is 8.4%.