Zip Codes with the Lowest Percentage of Owner-Occupied Units in Montana
RELATED REPORTS & OPTIONS
Lowest Owner-Occupied
Montana
Compare Zip Codes
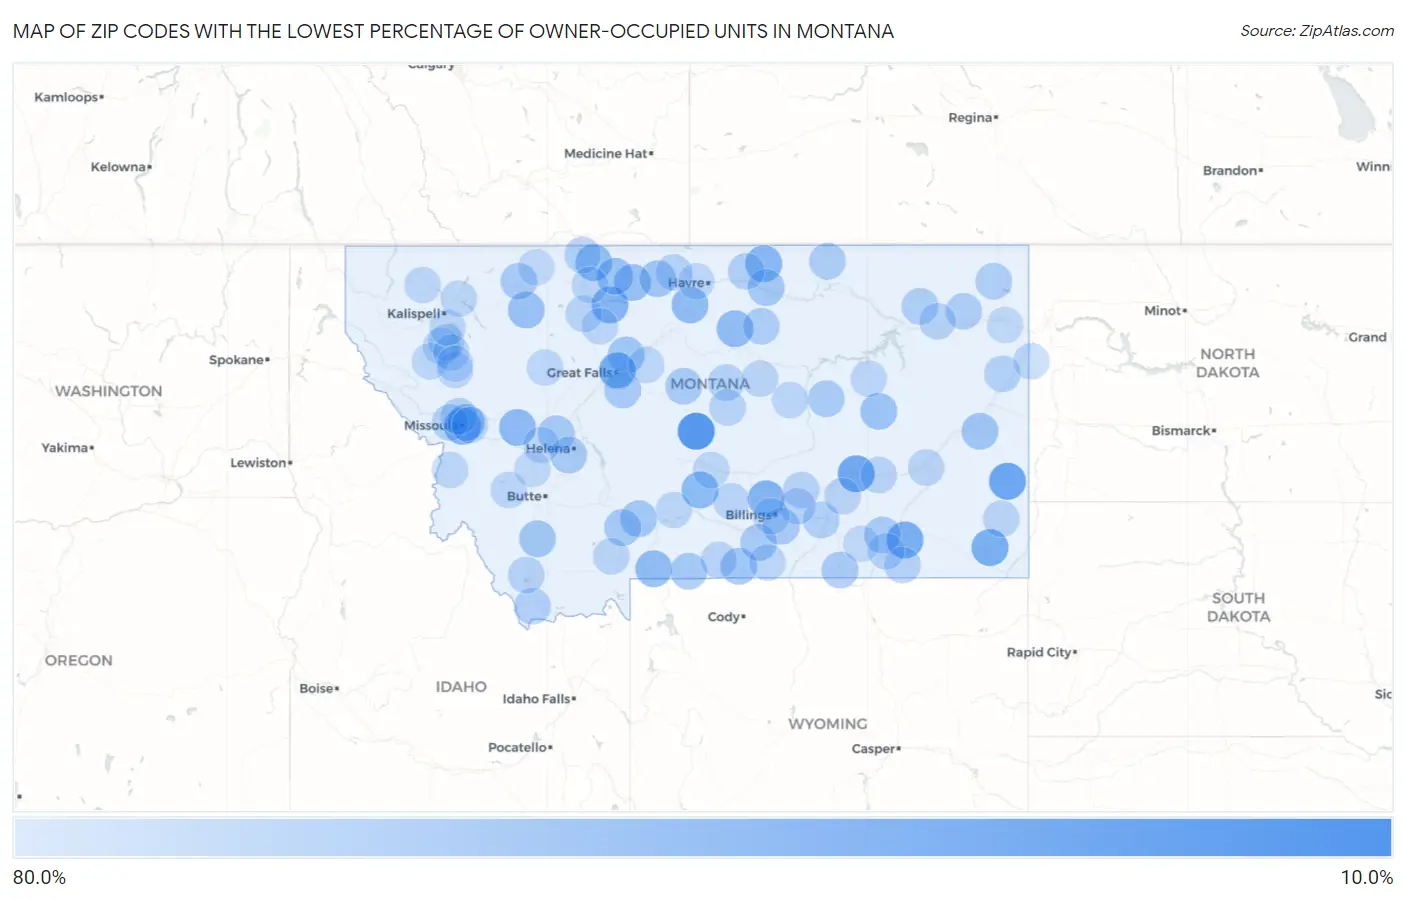
Map of Zip Codes with the Lowest Percentage of Owner-Occupied Units in Montana
80.0%
10.0%
Zip Codes with the Lowest Percentage of Owner-Occupied Units in Montana
| Zip Code | % Owner-Occupied | vs State | vs National | |
| 1. | 59418 | 17.9% | 69.0% (-51.2)#1 | 64.8% (-47.0)#322 |
| 2. | 59354 | 28.3% | 69.0% (-40.7)#2 | 64.8% (-36.5)#674 |
| 3. | 59076 | 30.0% | 69.0% (-39.0)#3 | 64.8% (-34.8)#762 |
| 4. | 59332 | 35.6% | 69.0% (-33.4)#4 | 64.8% (-29.2)#1,125 |
| 5. | 59003 | 35.7% | 69.0% (-33.4)#5 | 64.8% (-29.1)#1,128 |
| 6. | 59801 | 38.9% | 69.0% (-30.1)#6 | 64.8% (-25.9)#1,411 |
| 7. | 59002 | 40.5% | 69.0% (-28.5)#7 | 64.8% (-24.3)#1,559 |
| 8. | 59456 | 41.7% | 69.0% (-27.4)#8 | 64.8% (-23.1)#1,661 |
| 9. | 59529 | 42.9% | 69.0% (-26.2)#9 | 64.8% (-22.0)#1,789 |
| 10. | 59055 | 43.8% | 69.0% (-25.3)#10 | 64.8% (-21.1)#1,880 |
| 11. | 59843 | 45.5% | 69.0% (-23.6)#11 | 64.8% (-19.4)#2,098 |
| 12. | 59030 | 46.1% | 69.0% (-23.0)#12 | 64.8% (-18.7)#2,189 |
| 13. | 59521 | 46.3% | 69.0% (-22.7)#13 | 64.8% (-18.5)#2,222 |
| 14. | 59535 | 46.7% | 69.0% (-22.4)#14 | 64.8% (-18.1)#2,270 |
| 15. | 59466 | 47.3% | 69.0% (-21.8)#15 | 64.8% (-17.5)#2,365 |
| 16. | 59802 | 49.4% | 69.0% (-19.7)#16 | 64.8% (-15.5)#2,691 |
| 17. | 59522 | 49.7% | 69.0% (-19.4)#17 | 64.8% (-15.2)#2,732 |
| 18. | 59448 | 50.3% | 69.0% (-18.7)#18 | 64.8% (-14.5)#2,851 |
| 19. | 59444 | 51.1% | 69.0% (-17.9)#19 | 64.8% (-13.7)#2,998 |
| 20. | 59322 | 51.2% | 69.0% (-17.9)#20 | 64.8% (-13.7)#3,008 |
| 21. | 59326 | 53.3% | 69.0% (-15.7)#21 | 64.8% (-11.5)#3,398 |
| 22. | 59540 | 53.8% | 69.0% (-15.2)#22 | 64.8% (-11.0)#3,489 |
| 23. | 59007 | 53.8% | 69.0% (-15.2)#23 | 64.8% (-11.0)#3,502 |
| 24. | 59440 | 54.4% | 69.0% (-14.6)#24 | 64.8% (-10.4)#3,626 |
| 25. | 59732 | 54.7% | 69.0% (-14.3)#25 | 64.8% (-10.1)#3,687 |
| 26. | 59401 | 55.2% | 69.0% (-13.9)#26 | 64.8% (-9.66)#3,798 |
| 27. | 59715 | 56.0% | 69.0% (-13.1)#27 | 64.8% (-8.86)#4,015 |
| 28. | 59020 | 56.2% | 69.0% (-12.8)#28 | 64.8% (-8.57)#4,085 |
| 29. | 59526 | 56.8% | 69.0% (-12.3)#29 | 64.8% (-8.06)#4,216 |
| 30. | 59718 | 56.9% | 69.0% (-12.2)#30 | 64.8% (-7.94)#4,248 |
| 31. | 59640 | 57.1% | 69.0% (-11.9)#31 | 64.8% (-7.67)#4,319 |
| 32. | 59417 | 57.4% | 69.0% (-11.7)#32 | 64.8% (-7.45)#4,379 |
| 33. | 59405 | 57.4% | 69.0% (-11.7)#33 | 64.8% (-7.44)#4,381 |
| 34. | 59043 | 57.5% | 69.0% (-11.6)#34 | 64.8% (-7.36)#4,406 |
| 35. | 59089 | 57.8% | 69.0% (-11.2)#35 | 64.8% (-6.99)#4,490 |
| 36. | 59601 | 57.8% | 69.0% (-11.2)#36 | 64.8% (-6.98)#4,499 |
| 37. | 59101 | 57.9% | 69.0% (-11.2)#37 | 64.8% (-6.95)#4,505 |
| 38. | 59026 | 58.2% | 69.0% (-10.8)#38 | 64.8% (-6.61)#4,596 |
| 39. | 59077 | 58.3% | 69.0% (-10.7)#39 | 64.8% (-6.48)#4,620 |
| 40. | 59414 | 58.4% | 69.0% (-10.6)#40 | 64.8% (-6.41)#4,638 |
| 41. | 59424 | 59.3% | 69.0% (-9.77)#41 | 64.8% (-5.56)#4,890 |
| 42. | 59225 | 59.4% | 69.0% (-9.61)#42 | 64.8% (-5.40)#4,924 |
| 43. | 59527 | 59.6% | 69.0% (-9.48)#43 | 64.8% (-5.27)#4,968 |
| 44. | 59544 | 60.2% | 69.0% (-8.79)#44 | 64.8% (-4.58)#5,186 |
| 45. | 59258 | 60.8% | 69.0% (-8.27)#45 | 64.8% (-4.06)#5,343 |
| 46. | 59255 | 61.2% | 69.0% (-7.87)#46 | 64.8% (-3.65)#5,483 |
| 47. | 59034 | 61.4% | 69.0% (-7.65)#47 | 64.8% (-3.44)#5,555 |
| 48. | 59724 | 61.5% | 69.0% (-7.49)#48 | 64.8% (-3.28)#5,624 |
| 49. | 59547 | 61.9% | 69.0% (-7.12)#49 | 64.8% (-2.91)#5,757 |
| 50. | 59482 | 63.0% | 69.0% (-6.02)#50 | 64.8% (-1.80)#6,192 |
| 51. | 59804 | 63.1% | 69.0% (-5.94)#51 | 64.8% (-1.72)#6,234 |
| 52. | 59451 | 63.2% | 69.0% (-5.87)#52 | 64.8% (-1.66)#6,258 |
| 53. | 59262 | 63.2% | 69.0% (-5.85)#53 | 64.8% (-1.64)#6,268 |
| 54. | 59062 | 63.6% | 69.0% (-5.39)#54 | 64.8% (-1.18)#6,481 |
| 55. | 59808 | 64.0% | 69.0% (-5.02)#55 | 64.8% (-0.809)#6,606 |
| 56. | 59725 | 64.2% | 69.0% (-4.84)#56 | 64.8% (-0.631)#6,685 |
| 57. | 59915 | 64.5% | 69.0% (-4.51)#57 | 64.8% (-0.300)#6,831 |
| 58. | 59088 | 64.9% | 69.0% (-4.10)#58 | 64.8% (+0.113)#7,018 |
| 59. | 59201 | 65.1% | 69.0% (-3.91)#59 | 64.8% (+0.298)#7,112 |
| 60. | 59425 | 65.2% | 69.0% (-3.83)#60 | 64.8% (+0.385)#7,156 |
| 61. | 59525 | 65.2% | 69.0% (-3.81)#61 | 64.8% (+0.401)#7,160 |
| 62. | 59457 | 65.4% | 69.0% (-3.66)#62 | 64.8% (+0.551)#7,244 |
| 63. | 59012 | 65.4% | 69.0% (-3.64)#63 | 64.8% (+0.568)#7,252 |
| 64. | 59006 | 65.4% | 69.0% (-3.64)#64 | 64.8% (+0.577)#7,254 |
| 65. | 59324 | 65.6% | 69.0% (-3.47)#65 | 64.8% (+0.743)#7,348 |
| 66. | 59068 | 65.7% | 69.0% (-3.35)#66 | 64.8% (+0.867)#7,404 |
| 67. | 59010 | 65.7% | 69.0% (-3.34)#67 | 64.8% (+0.870)#7,405 |
| 68. | 59474 | 66.0% | 69.0% (-3.07)#68 | 64.8% (+1.14)#7,528 |
| 69. | 59716 | 66.0% | 69.0% (-3.01)#69 | 64.8% (+1.20)#7,555 |
| 70. | 59327 | 66.1% | 69.0% (-2.91)#70 | 64.8% (+1.31)#7,605 |
| 71. | 59471 | 66.2% | 69.0% (-2.82)#71 | 64.8% (+1.39)#7,649 |
| 72. | 59067 | 66.2% | 69.0% (-2.80)#72 | 64.8% (+1.42)#7,659 |
| 73. | 59301 | 66.3% | 69.0% (-2.77)#73 | 64.8% (+1.44)#7,668 |
| 74. | 59713 | 66.7% | 69.0% (-2.36)#74 | 64.8% (+1.85)#7,844 |
| 75. | 59851 | 66.7% | 69.0% (-2.36)#75 | 64.8% (+1.85)#7,858 |
| 76. | 59082 | 66.7% | 69.0% (-2.36)#76 | 64.8% (+1.85)#7,863 |
| 77. | 59864 | 66.7% | 69.0% (-2.32)#77 | 64.8% (+1.89)#7,881 |
| 78. | 59337 | 66.8% | 69.0% (-2.24)#78 | 64.8% (+1.97)#7,917 |
| 79. | 59416 | 66.9% | 69.0% (-2.15)#79 | 64.8% (+2.06)#7,959 |
| 80. | 59501 | 67.0% | 69.0% (-2.02)#80 | 64.8% (+2.20)#8,027 |
| 81. | 59014 | 67.0% | 69.0% (-1.99)#81 | 64.8% (+2.22)#8,040 |
| 82. | 59102 | 67.1% | 69.0% (-1.97)#82 | 64.8% (+2.24)#8,051 |
| 83. | 59450 | 67.2% | 69.0% (-1.86)#83 | 64.8% (+2.35)#8,118 |
| 84. | 59078 | 67.2% | 69.0% (-1.86)#84 | 64.8% (+2.35)#8,119 |
| 85. | 59927 | 67.2% | 69.0% (-1.82)#85 | 64.8% (+2.40)#8,142 |
| 86. | 59711 | 67.3% | 69.0% (-1.74)#86 | 64.8% (+2.47)#8,175 |
| 87. | 59845 | 67.3% | 69.0% (-1.73)#87 | 64.8% (+2.48)#8,185 |
| 88. | 59914 | 67.3% | 69.0% (-1.71)#88 | 64.8% (+2.50)#8,192 |
| 89. | 59841 | 67.8% | 69.0% (-1.22)#89 | 64.8% (+2.99)#8,437 |
| 90. | 59860 | 67.9% | 69.0% (-1.15)#90 | 64.8% (+3.06)#8,479 |
| 91. | 59087 | 68.0% | 69.0% (-0.982)#91 | 64.8% (+3.23)#8,580 |
| 92. | 59932 | 68.2% | 69.0% (-0.799)#92 | 64.8% (+3.41)#8,681 |
| 93. | 59270 | 68.3% | 69.0% (-0.756)#93 | 64.8% (+3.46)#8,709 |
| 94. | 59919 | 68.4% | 69.0% (-0.635)#94 | 64.8% (+3.58)#8,783 |
| 95. | 59410 | 68.5% | 69.0% (-0.570)#95 | 64.8% (+3.64)#8,825 |
| 96. | 59016 | 68.6% | 69.0% (-0.478)#96 | 64.8% (+3.73)#8,880 |
| 97. | 59218 | 68.6% | 69.0% (-0.458)#97 | 64.8% (+3.76)#8,890 |
| 98. | 59427 | 68.8% | 69.0% (-0.198)#98 | 64.8% (+4.01)#9,045 |
| 99. | 59855 | 69.0% | 69.0% (-0.007)#99 | 64.8% (+4.21)#9,144 |
| 100. | 59722 | 69.0% | 69.0% (+0.009)#100 | 64.8% (+4.22)#9,159 |
Common Questions
What are the Top 10 Zip Codes with the Lowest Percentage of Owner-Occupied Units in Montana?
Top 10 Zip Codes with the Lowest Percentage of Owner-Occupied Units in Montana are:
What zip code has the Lowest Percentage of Owner-Occupied Units in Montana?
59418 has the Lowest Percentage of Owner-Occupied Units in Montana with 17.9%.
What is the Percentage of Owner-Occupied Units in the State of Montana?
Percentage of Owner-Occupied Units in Montana is 69.0%.
What is the Percentage of Owner-Occupied Units in the United States?
Percentage of Owner-Occupied Units in the United States is 64.8%.