Zip Codes with the Oldest Female Population in Montana
RELATED REPORTS & OPTIONS
Oldest Population | Female
Montana
Compare Zip Codes
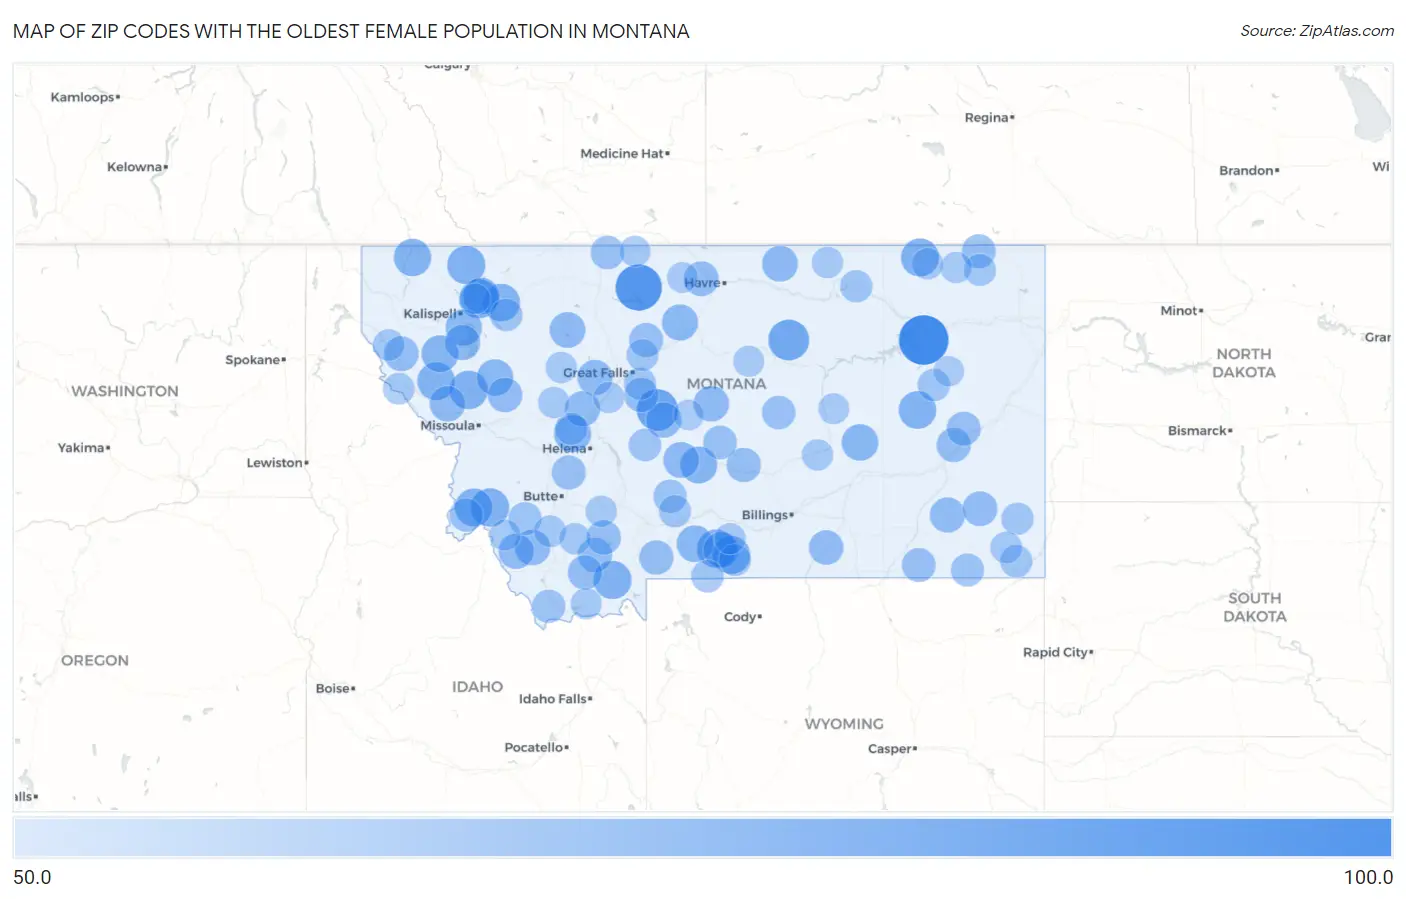
Map of Zip Codes with the Oldest Female Population in Montana
50.0
100.0
Zip Codes with the Oldest Female Population in Montana
| Zip Code | Median Age | vs State | vs National | |
| 1. | 59223 | 89.1 | 41.0(+48.1)#1 | 39.7(+49.4)#11 |
| 2. | 59461 | 83.1 | 41.0(+42.1)#2 | 39.7(+43.4)#41 |
| 3. | 59463 | 74.4 | 41.0(+33.4)#3 | 39.7(+34.7)#150 |
| 4. | 59546 | 73.3 | 41.0(+32.3)#4 | 39.7(+33.6)#178 |
| 5. | 59926 | 70.2 | 41.0(+29.2)#5 | 39.7(+30.5)#309 |
| 6. | 59871 | 68.7 | 41.0(+27.7)#6 | 39.7(+29.0)#406 |
| 7. | 59061 | 68.5 | 41.0(+27.5)#7 | 39.7(+28.8)#420 |
| 8. | 59863 | 68.5 | 41.0(+27.5)#8 | 39.7(+28.8)#422 |
| 9. | 59720 | 68.4 | 41.0(+27.4)#9 | 39.7(+28.7)#438 |
| 10. | 59928 | 68.4 | 41.0(+27.4)#10 | 39.7(+28.7)#439 |
| 11. | 59071 | 68.3 | 41.0(+27.3)#11 | 39.7(+28.6)#452 |
| 12. | 59240 | 68.2 | 41.0(+27.2)#12 | 39.7(+28.5)#463 |
| 13. | 59856 | 67.8 | 41.0(+26.8)#13 | 39.7(+28.1)#500 |
| 14. | 59827 | 67.7 | 41.0(+26.7)#14 | 39.7(+28.0)#505 |
| 15. | 59312 | 67.5 | 41.0(+26.5)#15 | 39.7(+27.8)#525 |
| 16. | 59916 | 67.4 | 41.0(+26.4)#16 | 39.7(+27.7)#536 |
| 17. | 59930 | 67.1 | 41.0(+26.1)#17 | 39.7(+27.4)#569 |
| 18. | 59848 | 66.3 | 41.0(+25.3)#18 | 39.7(+26.6)#674 |
| 19. | 59640 | 66.3 | 41.0(+25.3)#19 | 39.7(+26.6)#676 |
| 20. | 59085 | 66.2 | 41.0(+25.2)#20 | 39.7(+26.5)#686 |
| 21. | 59913 | 66.1 | 41.0(+25.1)#21 | 39.7(+26.4)#694 |
| 22. | 59052 | 65.8 | 41.0(+24.8)#22 | 39.7(+26.1)#737 |
| 23. | 59039 | 65.6 | 41.0(+24.6)#23 | 39.7(+25.9)#761 |
| 24. | 59826 | 65.4 | 41.0(+24.4)#24 | 39.7(+25.7)#788 |
| 25. | 59932 | 65.0 | 41.0(+24.0)#25 | 39.7(+25.3)#851 |
| 26. | 59460 | 64.8 | 41.0(+23.8)#26 | 39.7(+25.1)#884 |
| 27. | 59053 | 64.4 | 41.0(+23.4)#27 | 39.7(+24.7)#943 |
| 28. | 59028 | 64.2 | 41.0(+23.2)#28 | 39.7(+24.5)#964 |
| 29. | 59529 | 64.2 | 41.0(+23.2)#29 | 39.7(+24.5)#973 |
| 30. | 59419 | 64.1 | 41.0(+23.1)#30 | 39.7(+24.4)#991 |
| 31. | 59846 | 63.8 | 41.0(+22.8)#31 | 39.7(+24.1)#1,028 |
| 32. | 59462 | 63.7 | 41.0(+22.7)#32 | 39.7(+24.0)#1,049 |
| 33. | 59746 | 63.7 | 41.0(+22.7)#33 | 39.7(+24.0)#1,050 |
| 34. | 59914 | 63.5 | 41.0(+22.5)#34 | 39.7(+23.8)#1,075 |
| 35. | 59736 | 63.5 | 41.0(+22.5)#35 | 39.7(+23.8)#1,083 |
| 36. | 59477 | 63.3 | 41.0(+22.3)#36 | 39.7(+23.6)#1,125 |
| 37. | 59465 | 63.3 | 41.0(+22.3)#37 | 39.7(+23.6)#1,135 |
| 38. | 59351 | 63.2 | 41.0(+22.2)#38 | 39.7(+23.5)#1,152 |
| 39. | 59648 | 63.1 | 41.0(+22.1)#39 | 39.7(+23.4)#1,177 |
| 40. | 59532 | 62.5 | 41.0(+21.5)#40 | 39.7(+22.8)#1,308 |
| 41. | 59873 | 62.4 | 41.0(+21.4)#41 | 39.7(+22.7)#1,318 |
| 42. | 59345 | 62.3 | 41.0(+21.3)#42 | 39.7(+22.6)#1,361 |
| 43. | 59868 | 62.1 | 41.0(+21.1)#43 | 39.7(+22.4)#1,395 |
| 44. | 59075 | 62.1 | 41.0(+21.1)#44 | 39.7(+22.4)#1,415 |
| 45. | 59027 | 61.8 | 41.0(+20.8)#45 | 39.7(+22.1)#1,490 |
| 46. | 59755 | 61.8 | 41.0(+20.8)#46 | 39.7(+22.1)#1,503 |
| 47. | 59740 | 61.7 | 41.0(+20.7)#47 | 39.7(+22.0)#1,521 |
| 48. | 59074 | 61.6 | 41.0(+20.6)#48 | 39.7(+21.9)#1,542 |
| 49. | 59710 | 61.5 | 41.0(+20.5)#49 | 39.7(+21.8)#1,574 |
| 50. | 59338 | 61.5 | 41.0(+20.5)#50 | 39.7(+21.8)#1,582 |
| 51. | 59480 | 61.4 | 41.0(+20.4)#51 | 39.7(+21.7)#1,615 |
| 52. | 59631 | 61.2 | 41.0(+20.2)#52 | 39.7(+21.5)#1,678 |
| 53. | 59420 | 61.2 | 41.0(+20.2)#53 | 39.7(+21.5)#1,681 |
| 54. | 59349 | 61.0 | 41.0(+20.0)#54 | 39.7(+21.3)#1,727 |
| 55. | 59276 | 61.0 | 41.0(+20.0)#55 | 39.7(+21.3)#1,742 |
| 56. | 59062 | 60.7 | 41.0(+19.7)#56 | 39.7(+21.0)#1,816 |
| 57. | 59453 | 60.5 | 41.0(+19.5)#57 | 39.7(+20.8)#1,879 |
| 58. | 59484 | 60.3 | 41.0(+19.3)#58 | 39.7(+20.6)#1,971 |
| 59. | 59032 | 60.2 | 41.0(+19.2)#59 | 39.7(+20.5)#1,998 |
| 60. | 59829 | 59.9 | 41.0(+18.9)#60 | 39.7(+20.2)#2,086 |
| 61. | 59086 | 59.8 | 41.0(+18.8)#61 | 39.7(+20.1)#2,113 |
| 62. | 59724 | 59.7 | 41.0(+18.7)#62 | 39.7(+20.0)#2,163 |
| 63. | 59762 | 59.5 | 41.0(+18.5)#63 | 39.7(+19.8)#2,228 |
| 64. | 59314 | 59.3 | 41.0(+18.3)#64 | 39.7(+19.6)#2,323 |
| 65. | 59645 | 58.5 | 41.0(+17.5)#65 | 39.7(+18.8)#2,555 |
| 66. | 59936 | 58.5 | 41.0(+17.5)#66 | 39.7(+18.8)#2,566 |
| 67. | 59081 | 58.4 | 41.0(+17.4)#67 | 39.7(+18.7)#2,620 |
| 68. | 59214 | 58.3 | 41.0(+17.3)#68 | 39.7(+18.6)#2,676 |
| 69. | 59261 | 58.1 | 41.0(+17.1)#69 | 39.7(+18.4)#2,748 |
| 70. | 59311 | 58.1 | 41.0(+17.1)#70 | 39.7(+18.4)#2,761 |
| 71. | 59324 | 57.8 | 41.0(+16.8)#71 | 39.7(+18.1)#2,830 |
| 72. | 59018 | 57.8 | 41.0(+16.8)#72 | 39.7(+18.1)#2,831 |
| 73. | 59472 | 57.8 | 41.0(+16.8)#73 | 39.7(+18.1)#2,832 |
| 74. | 59633 | 57.8 | 41.0(+16.8)#74 | 39.7(+18.1)#2,839 |
| 75. | 59068 | 57.3 | 41.0(+16.3)#75 | 39.7(+17.6)#3,015 |
| 76. | 59440 | 57.2 | 41.0(+16.2)#76 | 39.7(+17.5)#3,099 |
| 77. | 59222 | 57.2 | 41.0(+16.2)#77 | 39.7(+17.5)#3,103 |
| 78. | 59743 | 57.1 | 41.0(+16.1)#78 | 39.7(+17.4)#3,157 |
| 79. | 59332 | 57.1 | 41.0(+16.1)#79 | 39.7(+17.4)#3,159 |
| 80. | 59842 | 56.9 | 41.0(+15.9)#80 | 39.7(+17.2)#3,243 |
| 81. | 59874 | 56.8 | 41.0(+15.8)#81 | 39.7(+17.1)#3,255 |
| 82. | 59754 | 56.8 | 41.0(+15.8)#82 | 39.7(+17.1)#3,263 |
| 83. | 59263 | 56.4 | 41.0(+15.4)#83 | 39.7(+16.7)#3,444 |
| 84. | 59537 | 56.4 | 41.0(+15.4)#84 | 39.7(+16.7)#3,469 |
| 85. | 59721 | 56.3 | 41.0(+15.3)#85 | 39.7(+16.6)#3,505 |
| 86. | 59059 | 56.3 | 41.0(+15.3)#86 | 39.7(+16.6)#3,514 |
| 87. | 59260 | 56.3 | 41.0(+15.3)#87 | 39.7(+16.6)#3,519 |
| 88. | 59001 | 56.2 | 41.0(+15.2)#88 | 39.7(+16.5)#3,538 |
| 89. | 59410 | 56.2 | 41.0(+15.2)#89 | 39.7(+16.5)#3,549 |
| 90. | 59639 | 56.1 | 41.0(+15.1)#90 | 39.7(+16.4)#3,585 |
| 91. | 59421 | 56.0 | 41.0(+15.0)#91 | 39.7(+16.3)#3,638 |
| 92. | 59761 | 55.8 | 41.0(+14.8)#92 | 39.7(+16.1)#3,737 |
| 93. | 59739 | 55.8 | 41.0(+14.8)#93 | 39.7(+16.1)#3,739 |
| 94. | 59545 | 55.8 | 41.0(+14.8)#94 | 39.7(+16.1)#3,753 |
| 95. | 59489 | 55.7 | 41.0(+14.7)#95 | 39.7(+16.0)#3,787 |
| 96. | 59058 | 55.5 | 41.0(+14.5)#96 | 39.7(+15.8)#3,899 |
| 97. | 59528 | 55.3 | 41.0(+14.3)#97 | 39.7(+15.6)#3,981 |
| 98. | 59919 | 55.1 | 41.0(+14.1)#98 | 39.7(+15.4)#4,068 |
| 99. | 59479 | 55.0 | 41.0(+14.0)#99 | 39.7(+15.3)#4,121 |
| 100. | 59215 | 54.7 | 41.0(+13.7)#100 | 39.7(+15.0)#4,276 |
Common Questions
What are the Top 10 Zip Codes with the Oldest Female Population in Montana?
Top 10 Zip Codes with the Oldest Female Population in Montana are:
What zip code has the Oldest Female Population in Montana?
59223 has the Oldest Female Population in Montana with 89.1.
What is the Median Female Age in the State of Montana?
Median Female Age in Montana is 41.0.
What is the Median Female Age in the United States?
Median Female Age in the United States is 39.7.