Zip Codes with the Highest Percentage of Hawaiian / Pacific Population in Montana
RELATED REPORTS & OPTIONS
Hawaiian / Pacific
Montana
Compare Zip Codes
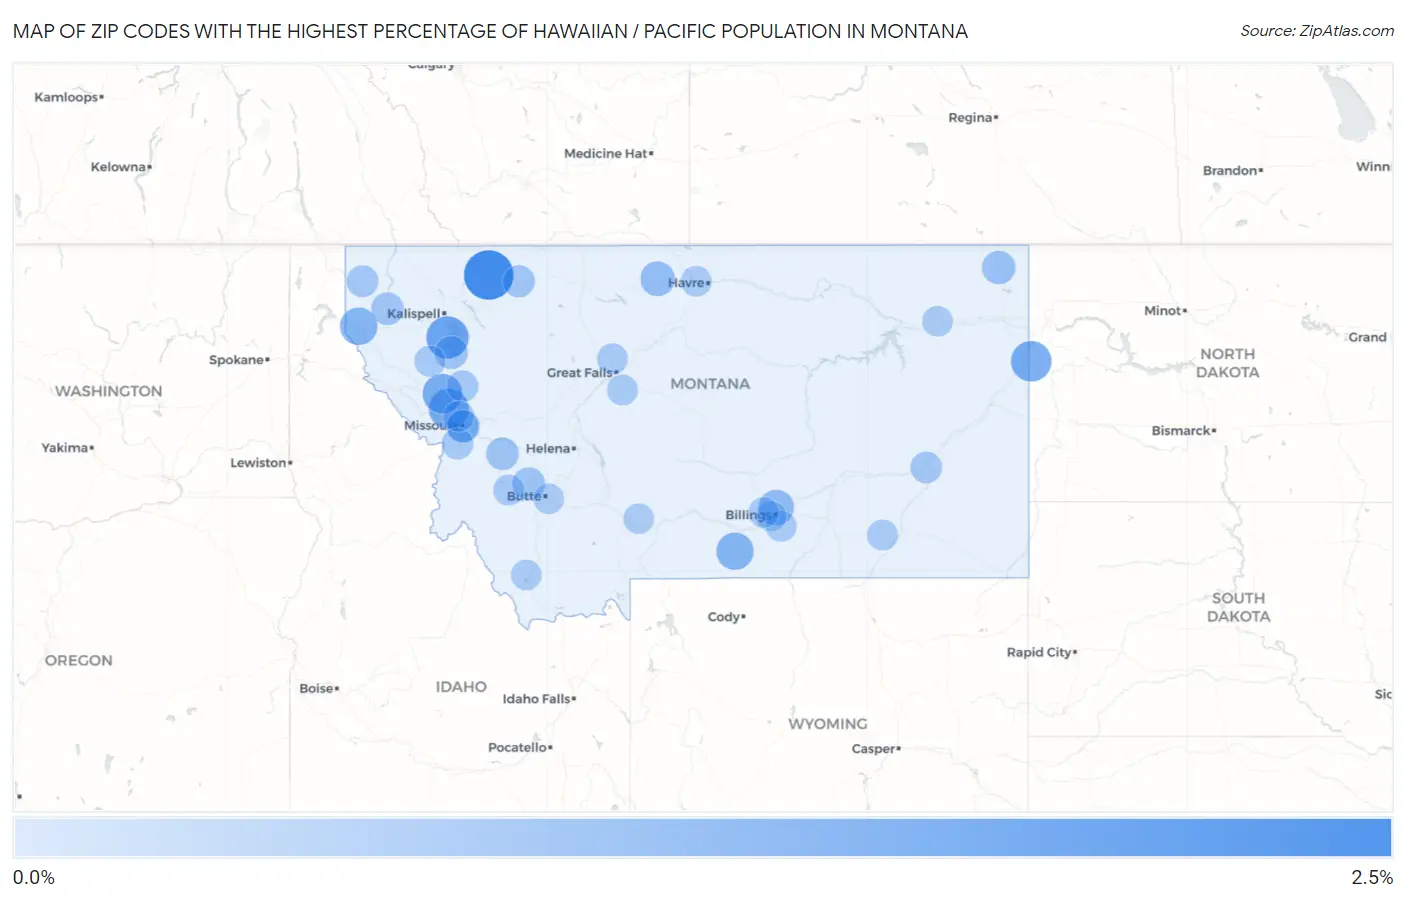
Map of Zip Codes with the Highest Percentage of Hawaiian / Pacific Population in Montana
0.0%
2.5%
Zip Codes with the Highest Percentage of Hawaiian / Pacific Population in Montana
| Zip Code | Hawaiian / Pacific | vs State | vs National | |
| 1. | 59434 | 2.4% | 0.062%(+2.35)#1 | 0.19%(+2.23)#271 |
| 2. | 59931 | 1.5% | 0.062%(+1.42)#2 | 0.19%(+1.30)#469 |
| 3. | 59270 | 1.3% | 0.062%(+1.21)#3 | 0.19%(+1.08)#569 |
| 4. | 59834 | 1.2% | 0.062%(+1.12)#4 | 0.19%(+0.995)#617 |
| 5. | 59831 | 1.2% | 0.062%(+1.10)#5 | 0.19%(+0.974)#630 |
| 6. | 59853 | 0.88% | 0.062%(+0.822)#6 | 0.19%(+0.695)#826 |
| 7. | 59070 | 0.85% | 0.062%(+0.791)#7 | 0.19%(+0.664)#852 |
| 8. | 59105 | 0.61% | 0.062%(+0.548)#8 | 0.19%(+0.422)#1,203 |
| 9. | 59540 | 0.53% | 0.062%(+0.472)#9 | 0.19%(+0.346)#1,344 |
| 10. | 59254 | 0.37% | 0.062%(+0.306)#10 | 0.19%(+0.180)#1,826 |
| 11. | 59860 | 0.34% | 0.062%(+0.276)#11 | 0.19%(+0.150)#1,941 |
| 12. | 59756 | 0.29% | 0.062%(+0.233)#12 | 0.19%(+0.106)#2,156 |
| 13. | 59837 | 0.27% | 0.062%(+0.209)#13 | 0.19%(+0.083)#2,294 |
| 14. | 59923 | 0.26% | 0.062%(+0.200)#14 | 0.19%(+0.073)#2,361 |
| 15. | 59812 | 0.23% | 0.062%(+0.165)#15 | 0.19%(+0.039)#2,584 |
| 16. | 59417 | 0.23% | 0.062%(+0.163)#16 | 0.19%(+0.037)#2,596 |
| 17. | 59801 | 0.22% | 0.062%(+0.156)#17 | 0.19%(+0.030)#2,654 |
| 18. | 59935 | 0.17% | 0.062%(+0.109)#18 | 0.19%(-0.018)#3,096 |
| 19. | 59865 | 0.15% | 0.062%(+0.092)#19 | 0.19%(-0.035)#3,299 |
| 20. | 59301 | 0.15% | 0.062%(+0.084)#20 | 0.19%(-0.042)#3,383 |
| 21. | 59833 | 0.12% | 0.062%(+0.060)#21 | 0.19%(-0.067)#3,703 |
| 22. | 59808 | 0.079% | 0.062%(+0.016)#22 | 0.19%(-0.110)#4,449 |
| 23. | 59845 | 0.077% | 0.062%(+0.014)#23 | 0.19%(-0.112)#4,480 |
| 24. | 59711 | 0.064% | 0.062%(+0.001)#24 | 0.19%(-0.125)#4,786 |
| 25. | 59405 | 0.044% | 0.062%(-0.018)#25 | 0.19%(-0.145)#5,229 |
| 26. | 59404 | 0.042% | 0.062%(-0.020)#26 | 0.19%(-0.146)#5,285 |
| 27. | 59043 | 0.033% | 0.062%(-0.029)#27 | 0.19%(-0.156)#5,558 |
| 28. | 59101 | 0.032% | 0.062%(-0.031)#28 | 0.19%(-0.157)#5,587 |
| 29. | 59701 | 0.026% | 0.062%(-0.036)#29 | 0.19%(-0.162)#5,771 |
| 30. | 59501 | 0.024% | 0.062%(-0.038)#30 | 0.19%(-0.164)#5,861 |
| 31. | 59102 | 0.021% | 0.062%(-0.042)#31 | 0.19%(-0.168)#5,972 |
| 32. | 59201 | 0.018% | 0.062%(-0.044)#32 | 0.19%(-0.171)#6,044 |
| 33. | 59725 | 0.012% | 0.062%(-0.050)#33 | 0.19%(-0.176)#6,215 |
| 34. | 59715 | 0.0077% | 0.062%(-0.055)#34 | 0.19%(-0.181)#6,342 |
| 35. | 59106 | 0.0052% | 0.062%(-0.057)#35 | 0.19%(-0.183)#6,390 |
Common Questions
What are the Top 10 Zip Codes with the Highest Percentage of Hawaiian / Pacific Population in Montana?
Top 10 Zip Codes with the Highest Percentage of Hawaiian / Pacific Population in Montana are:
What zip code has the Highest Percentage of Hawaiian / Pacific Population in Montana?
59434 has the Highest Percentage of Hawaiian / Pacific Population in Montana with 2.4%.
What is the Percentage of Hawaiian / Pacific Population in the State of Montana?
Percentage of Hawaiian / Pacific Population in Montana is 0.062%.
What is the Percentage of Hawaiian / Pacific Population in the United States?
Percentage of Hawaiian / Pacific Population in the United States is 0.19%.