Zip Codes with the Highest Percentage of Population Employed in Firefighting & Prevention in Montana
RELATED REPORTS & OPTIONS
Firefighting & Prevention
Montana
Compare Zip Codes
Map of Zip Codes with the Highest Percentage of Population Employed in Firefighting & Prevention in Montana
0.0%
15.0%
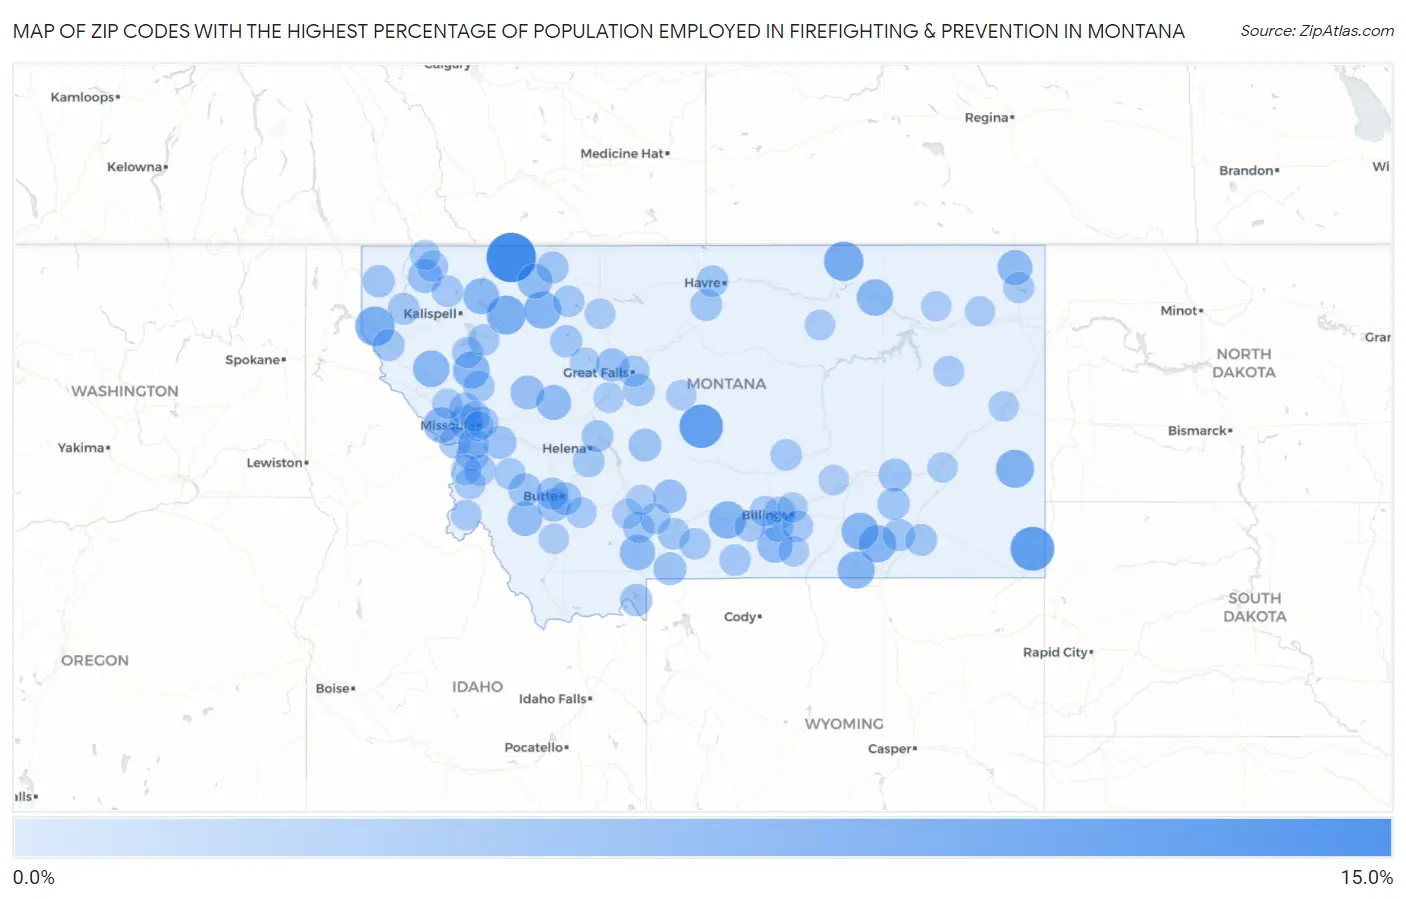
Zip Codes with the Highest Percentage of Population Employed in Firefighting & Prevention in Montana
| Zip Code | % Employed | vs State | vs National | |
| 1. | 59411 | 14.8% | 1.1%(+13.7)#1 | 1.2%(+13.6)#163 |
| 2. | 59319 | 10.5% | 1.1%(+9.46)#2 | 1.2%(+9.34)#278 |
| 3. | 59452 | 10.2% | 1.1%(+9.14)#3 | 1.2%(+9.02)#295 |
| 4. | 59544 | 7.3% | 1.1%(+6.23)#4 | 1.2%(+6.11)#476 |
| 5. | 59853 | 7.2% | 1.1%(+6.12)#5 | 1.2%(+6.00)#488 |
| 6. | 59936 | 6.8% | 1.1%(+5.71)#6 | 1.2%(+5.59)#542 |
| 7. | 59344 | 6.2% | 1.1%(+5.18)#7 | 1.2%(+5.06)#634 |
| 8. | 59448 | 5.8% | 1.1%(+4.69)#8 | 1.2%(+4.57)#718 |
| 9. | 59069 | 5.7% | 1.1%(+4.66)#9 | 1.2%(+4.54)#724 |
| 10. | 59089 | 5.6% | 1.1%(+4.49)#10 | 1.2%(+4.37)#758 |
| 11. | 59016 | 5.5% | 1.1%(+4.45)#11 | 1.2%(+4.33)#764 |
| 12. | 59022 | 5.5% | 1.1%(+4.41)#12 | 1.2%(+4.29)#771 |
| 13. | 59864 | 5.3% | 1.1%(+4.21)#13 | 1.2%(+4.09)#811 |
| 14. | 59241 | 5.1% | 1.1%(+4.03)#14 | 1.2%(+3.91)#873 |
| 15. | 59859 | 5.1% | 1.1%(+4.00)#15 | 1.2%(+3.88)#884 |
| 16. | 59913 | 4.7% | 1.1%(+3.66)#16 | 1.2%(+3.54)#1,015 |
| 17. | 59029 | 4.4% | 1.1%(+3.32)#17 | 1.2%(+3.20)#1,161 |
| 18. | 59820 | 4.3% | 1.1%(+3.26)#18 | 1.2%(+3.14)#1,193 |
| 19. | 59730 | 4.3% | 1.1%(+3.24)#19 | 1.2%(+3.12)#1,199 |
| 20. | 59254 | 3.9% | 1.1%(+2.82)#20 | 1.2%(+2.70)#1,419 |
| 21. | 59639 | 3.9% | 1.1%(+2.81)#21 | 1.2%(+2.69)#1,429 |
| 22. | 59417 | 3.9% | 1.1%(+2.80)#22 | 1.2%(+2.68)#1,434 |
| 23. | 59762 | 3.6% | 1.1%(+2.57)#23 | 1.2%(+2.45)#1,611 |
| 24. | 59854 | 3.2% | 1.1%(+2.16)#24 | 1.2%(+2.04)#1,994 |
| 25. | 59934 | 3.2% | 1.1%(+2.15)#25 | 1.2%(+2.03)#2,002 |
| 26. | 59804 | 3.2% | 1.1%(+2.09)#26 | 1.2%(+1.97)#2,077 |
| 27. | 59086 | 2.8% | 1.1%(+1.78)#27 | 1.2%(+1.66)#2,467 |
| 28. | 59487 | 2.8% | 1.1%(+1.74)#28 | 1.2%(+1.62)#2,571 |
| 29. | 59750 | 2.7% | 1.1%(+1.65)#29 | 1.2%(+1.53)#2,707 |
| 30. | 59711 | 2.7% | 1.1%(+1.62)#30 | 1.2%(+1.50)#2,752 |
| 31. | 59030 | 2.5% | 1.1%(+1.42)#31 | 1.2%(+1.30)#3,122 |
| 32. | 59825 | 2.5% | 1.1%(+1.41)#32 | 1.2%(+1.29)#3,151 |
| 33. | 59327 | 2.5% | 1.1%(+1.40)#33 | 1.2%(+1.28)#3,178 |
| 34. | 59701 | 2.4% | 1.1%(+1.38)#34 | 1.2%(+1.26)#3,219 |
| 35. | 59645 | 2.4% | 1.1%(+1.30)#35 | 1.2%(+1.18)#3,426 |
| 36. | 59043 | 2.1% | 1.1%(+1.04)#36 | 1.2%(+0.915)#4,150 |
| 37. | 59758 | 2.1% | 1.1%(+1.03)#37 | 1.2%(+0.911)#4,159 |
| 38. | 59748 | 2.1% | 1.1%(+1.02)#38 | 1.2%(+0.898)#4,209 |
| 39. | 59323 | 2.1% | 1.1%(+0.989)#39 | 1.2%(+0.869)#4,307 |
| 40. | 59935 | 1.9% | 1.1%(+0.877)#40 | 1.2%(+0.757)#4,728 |
| 41. | 59427 | 1.9% | 1.1%(+0.877)#41 | 1.2%(+0.756)#4,732 |
| 42. | 59870 | 1.9% | 1.1%(+0.855)#42 | 1.2%(+0.735)#4,829 |
| 43. | 59422 | 1.9% | 1.1%(+0.847)#43 | 1.2%(+0.727)#4,871 |
| 44. | 59847 | 1.9% | 1.1%(+0.815)#44 | 1.2%(+0.695)#4,997 |
| 45. | 59405 | 1.8% | 1.1%(+0.777)#45 | 1.2%(+0.656)#5,170 |
| 46. | 59834 | 1.8% | 1.1%(+0.736)#46 | 1.2%(+0.616)#5,346 |
| 47. | 59874 | 1.8% | 1.1%(+0.695)#47 | 1.2%(+0.575)#5,540 |
| 48. | 59802 | 1.7% | 1.1%(+0.624)#48 | 1.2%(+0.504)#5,891 |
| 49. | 59047 | 1.7% | 1.1%(+0.614)#49 | 1.2%(+0.494)#5,944 |
| 50. | 59106 | 1.7% | 1.1%(+0.603)#50 | 1.2%(+0.483)#6,002 |
| 51. | 59003 | 1.6% | 1.1%(+0.577)#51 | 1.2%(+0.457)#6,151 |
| 52. | 59521 | 1.6% | 1.1%(+0.572)#52 | 1.2%(+0.452)#6,177 |
| 53. | 59634 | 1.6% | 1.1%(+0.569)#53 | 1.2%(+0.448)#6,195 |
| 54. | 59501 | 1.6% | 1.1%(+0.555)#54 | 1.2%(+0.435)#6,283 |
| 55. | 59602 | 1.6% | 1.1%(+0.545)#55 | 1.2%(+0.425)#6,319 |
| 56. | 59923 | 1.6% | 1.1%(+0.527)#56 | 1.2%(+0.407)#6,422 |
| 57. | 59937 | 1.5% | 1.1%(+0.484)#57 | 1.2%(+0.364)#6,661 |
| 58. | 59865 | 1.5% | 1.1%(+0.472)#58 | 1.2%(+0.352)#6,731 |
| 59. | 59486 | 1.5% | 1.1%(+0.402)#59 | 1.2%(+0.282)#7,186 |
| 60. | 59828 | 1.5% | 1.1%(+0.402)#60 | 1.2%(+0.281)#7,190 |
| 61. | 59718 | 1.5% | 1.1%(+0.397)#61 | 1.2%(+0.277)#7,220 |
| 62. | 59401 | 1.4% | 1.1%(+0.377)#62 | 1.2%(+0.257)#7,361 |
| 63. | 59072 | 1.4% | 1.1%(+0.367)#63 | 1.2%(+0.247)#7,426 |
| 64. | 59052 | 1.4% | 1.1%(+0.343)#64 | 1.2%(+0.223)#7,588 |
| 65. | 59068 | 1.4% | 1.1%(+0.339)#65 | 1.2%(+0.219)#7,615 |
| 66. | 59044 | 1.4% | 1.1%(+0.336)#66 | 1.2%(+0.216)#7,632 |
| 67. | 59833 | 1.4% | 1.1%(+0.322)#67 | 1.2%(+0.201)#7,732 |
| 68. | 59101 | 1.4% | 1.1%(+0.300)#68 | 1.2%(+0.180)#7,859 |
| 69. | 59860 | 1.3% | 1.1%(+0.258)#69 | 1.2%(+0.138)#8,171 |
| 70. | 59918 | 1.3% | 1.1%(+0.256)#70 | 1.2%(+0.136)#8,188 |
| 71. | 59911 | 1.3% | 1.1%(+0.246)#71 | 1.2%(+0.126)#8,264 |
| 72. | 59858 | 1.3% | 1.1%(+0.229)#72 | 1.2%(+0.109)#8,380 |
| 73. | 59247 | 1.2% | 1.1%(+0.146)#73 | 1.2%(+0.026)#9,049 |
| 74. | 59840 | 1.2% | 1.1%(+0.129)#74 | 1.2%(+0.008)#9,191 |
| 75. | 59715 | 1.1% | 1.1%(+0.042)#75 | 1.2%(-0.078)#10,046 |
| 76. | 59019 | 1.1% | 1.1%(+0.034)#76 | 1.2%(-0.086)#10,109 |
| 77. | 59215 | 0.92% | 1.1%(-0.145)#77 | 1.2%(-0.265)#11,936 |
| 78. | 59841 | 0.90% | 1.1%(-0.167)#78 | 1.2%(-0.287)#12,173 |
| 79. | 59066 | 0.87% | 1.1%(-0.196)#79 | 1.2%(-0.316)#12,482 |
| 80. | 59759 | 0.87% | 1.1%(-0.197)#80 | 1.2%(-0.317)#12,489 |
| 81. | 59829 | 0.84% | 1.1%(-0.227)#81 | 1.2%(-0.347)#12,787 |
| 82. | 59538 | 0.83% | 1.1%(-0.232)#82 | 1.2%(-0.352)#12,826 |
| 83. | 59808 | 0.82% | 1.1%(-0.246)#83 | 1.2%(-0.366)#12,968 |
| 84. | 59425 | 0.77% | 1.1%(-0.294)#84 | 1.2%(-0.414)#13,525 |
| 85. | 59057 | 0.75% | 1.1%(-0.315)#85 | 1.2%(-0.435)#13,756 |
| 86. | 59732 | 0.74% | 1.1%(-0.330)#86 | 1.2%(-0.450)#13,926 |
| 87. | 59846 | 0.72% | 1.1%(-0.342)#87 | 1.2%(-0.462)#14,068 |
| 88. | 59714 | 0.71% | 1.1%(-0.352)#88 | 1.2%(-0.472)#14,178 |
| 89. | 59421 | 0.70% | 1.1%(-0.365)#89 | 1.2%(-0.485)#14,316 |
| 90. | 59024 | 0.69% | 1.1%(-0.376)#90 | 1.2%(-0.496)#14,464 |
| 91. | 59330 | 0.63% | 1.1%(-0.432)#91 | 1.2%(-0.552)#15,070 |
| 92. | 59447 | 0.63% | 1.1%(-0.437)#92 | 1.2%(-0.557)#15,109 |
| 93. | 59801 | 0.62% | 1.1%(-0.445)#93 | 1.2%(-0.565)#15,195 |
| 94. | 59105 | 0.62% | 1.1%(-0.447)#94 | 1.2%(-0.567)#15,216 |
| 95. | 59225 | 0.62% | 1.1%(-0.448)#95 | 1.2%(-0.569)#15,232 |
| 96. | 59741 | 0.62% | 1.1%(-0.449)#96 | 1.2%(-0.569)#15,234 |
| 97. | 59436 | 0.61% | 1.1%(-0.453)#97 | 1.2%(-0.574)#15,291 |
| 98. | 59917 | 0.61% | 1.1%(-0.458)#98 | 1.2%(-0.579)#15,349 |
| 99. | 59301 | 0.59% | 1.1%(-0.472)#99 | 1.2%(-0.592)#15,481 |
| 100. | 59255 | 0.59% | 1.1%(-0.477)#100 | 1.2%(-0.598)#15,537 |
Common Questions
What are the Top 10 Zip Codes with the Highest Percentage of Population Employed in Firefighting & Prevention in Montana?
Top 10 Zip Codes with the Highest Percentage of Population Employed in Firefighting & Prevention in Montana are:
What zip code has the Highest Percentage of Population Employed in Firefighting & Prevention in Montana?
59411 has the Highest Percentage of Population Employed in Firefighting & Prevention in Montana with 14.8%.
What is the Percentage of Population Employed in Firefighting & Prevention in the State of Montana?
Percentage of Population Employed in Firefighting & Prevention in Montana is 1.1%.
What is the Percentage of Population Employed in Firefighting & Prevention in the United States?
Percentage of Population Employed in Firefighting & Prevention in the United States is 1.2%.