Zip Codes with the Highest Percentage of Population with a Degree in Education in Montana
RELATED REPORTS & OPTIONS
Education
Montana
Compare Zip Codes
Map of Zip Codes with the Highest Percentage of Population with a Degree in Education in Montana
20.0%
100.0%
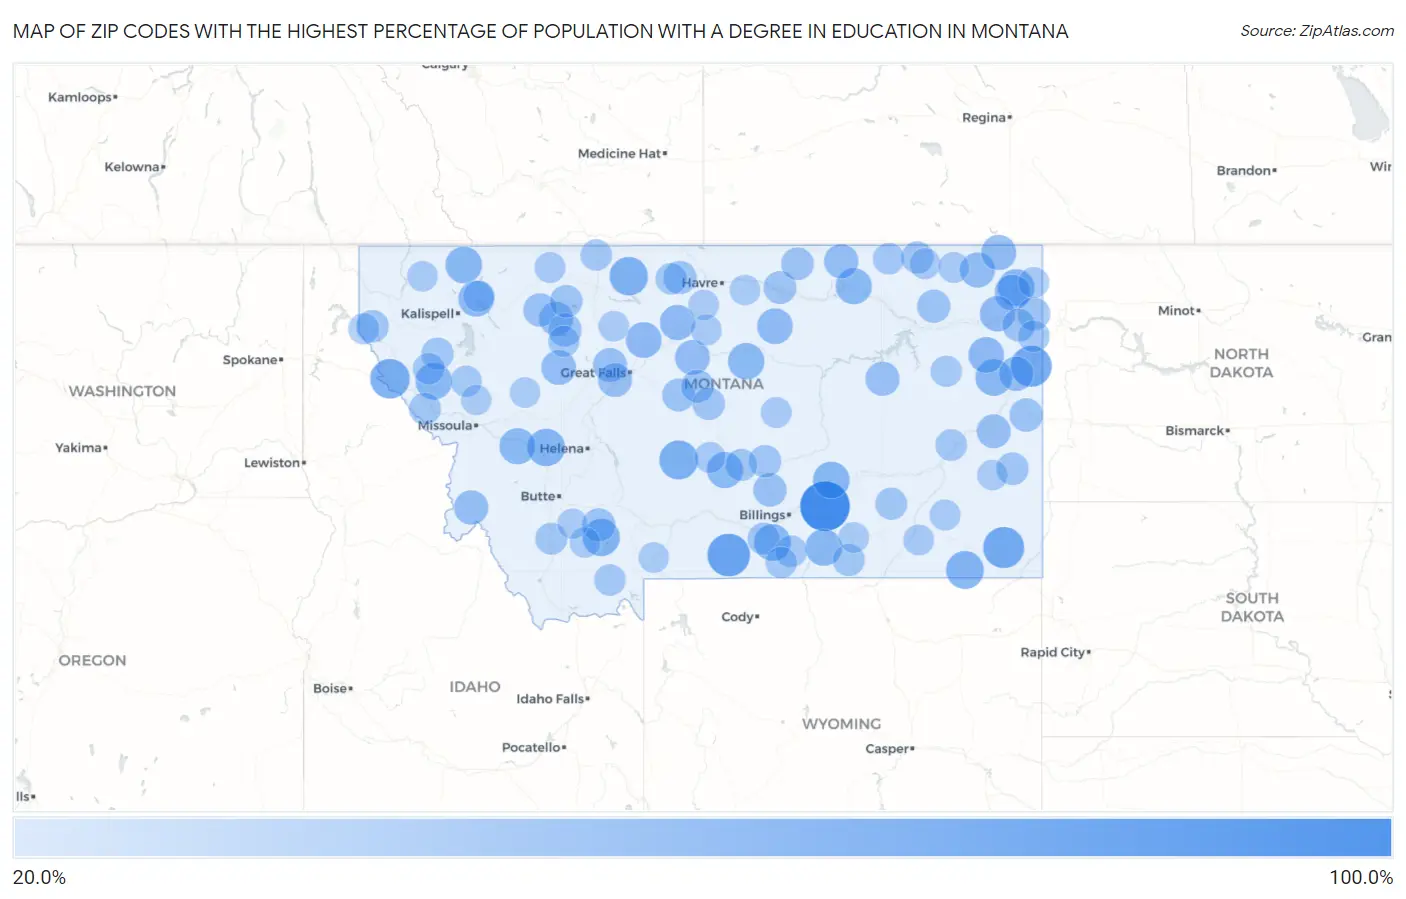
Zip Codes with the Highest Percentage of Population with a Degree in Education in Montana
| Zip Code | % Graduates | vs State | vs National | |
| 1. | 59064 | 100.0% | 15.2% (+84.8)#1 | 11.1% (+88.9)#127 |
| 2. | 59071 | 72.7% | 15.2% (+57.6)#2 | 11.1% (+61.7)#481 |
| 3. | 59217 | 66.7% | 15.2% (+51.5)#3 | 11.1% (+55.6)#563 |
| 4. | 59332 | 66.7% | 15.2% (+51.5)#4 | 11.1% (+55.6)#564 |
| 5. | 59830 | 61.2% | 15.2% (+46.1)#5 | 11.1% (+50.2)#712 |
| 6. | 59053 | 58.4% | 15.2% (+43.3)#6 | 11.1% (+47.4)#797 |
| 7. | 59444 | 56.8% | 15.2% (+41.7)#7 | 11.1% (+45.8)#858 |
| 8. | 59314 | 54.5% | 15.2% (+39.4)#8 | 11.1% (+43.5)#943 |
| 9. | 59731 | 53.3% | 15.2% (+38.2)#9 | 11.1% (+42.3)#997 |
| 10. | 59740 | 52.5% | 15.2% (+37.3)#10 | 11.1% (+41.4)#1,034 |
| 11. | 59024 | 50.0% | 15.2% (+34.8)#11 | 11.1% (+38.9)#1,186 |
| 12. | 59247 | 50.0% | 15.2% (+34.8)#12 | 11.1% (+38.9)#1,187 |
| 13. | 59856 | 50.0% | 15.2% (+34.8)#13 | 11.1% (+38.9)#1,199 |
| 14. | 59928 | 50.0% | 15.2% (+34.8)#14 | 11.1% (+38.9)#1,207 |
| 15. | 59075 | 50.0% | 15.2% (+34.8)#15 | 11.1% (+38.9)#1,213 |
| 16. | 59026 | 50.0% | 15.2% (+34.8)#16 | 11.1% (+38.9)#1,227 |
| 17. | 59315 | 50.0% | 15.2% (+34.8)#17 | 11.1% (+38.9)#1,238 |
| 18. | 59489 | 49.1% | 15.2% (+33.9)#18 | 11.1% (+38.0)#1,276 |
| 19. | 59078 | 48.5% | 15.2% (+33.3)#19 | 11.1% (+37.4)#1,306 |
| 20. | 59832 | 48.3% | 15.2% (+33.1)#20 | 11.1% (+37.2)#1,318 |
| 21. | 59261 | 48.3% | 15.2% (+33.1)#21 | 11.1% (+37.2)#1,320 |
| 22. | 59926 | 46.8% | 15.2% (+31.6)#22 | 11.1% (+35.7)#1,404 |
| 23. | 59420 | 46.5% | 15.2% (+31.3)#23 | 11.1% (+35.5)#1,432 |
| 24. | 59259 | 46.4% | 15.2% (+31.3)#24 | 11.1% (+35.4)#1,439 |
| 25. | 59527 | 46.3% | 15.2% (+31.2)#25 | 11.1% (+35.3)#1,456 |
| 26. | 59242 | 46.2% | 15.2% (+31.0)#26 | 11.1% (+35.1)#1,476 |
| 27. | 59213 | 45.1% | 15.2% (+30.0)#27 | 11.1% (+34.1)#1,556 |
| 28. | 59460 | 45.0% | 15.2% (+29.8)#28 | 11.1% (+33.9)#1,570 |
| 29. | 59222 | 44.4% | 15.2% (+29.3)#29 | 11.1% (+33.4)#1,619 |
| 30. | 59252 | 44.4% | 15.2% (+29.3)#30 | 11.1% (+33.4)#1,623 |
| 31. | 59446 | 43.4% | 15.2% (+28.2)#31 | 11.1% (+32.3)#1,717 |
| 32. | 59410 | 42.7% | 15.2% (+27.6)#32 | 11.1% (+31.7)#1,794 |
| 33. | 59262 | 41.9% | 15.2% (+26.7)#33 | 11.1% (+30.8)#1,880 |
| 34. | 59544 | 41.2% | 15.2% (+26.0)#34 | 11.1% (+30.1)#1,975 |
| 35. | 59827 | 41.1% | 15.2% (+25.9)#35 | 11.1% (+30.0)#1,991 |
| 36. | 59337 | 40.4% | 15.2% (+25.3)#36 | 11.1% (+29.4)#2,084 |
| 37. | 59487 | 40.2% | 15.2% (+25.0)#37 | 11.1% (+29.1)#2,112 |
| 38. | 59485 | 40.1% | 15.2% (+25.0)#38 | 11.1% (+29.1)#2,116 |
| 39. | 59326 | 40.0% | 15.2% (+24.8)#39 | 11.1% (+28.9)#2,140 |
| 40. | 59432 | 40.0% | 15.2% (+24.8)#40 | 11.1% (+28.9)#2,163 |
| 41. | 59448 | 38.0% | 15.2% (+22.8)#41 | 11.1% (+26.9)#2,480 |
| 42. | 59015 | 37.7% | 15.2% (+22.5)#42 | 11.1% (+26.6)#2,533 |
| 43. | 59353 | 37.6% | 15.2% (+22.4)#43 | 11.1% (+26.5)#2,548 |
| 44. | 59735 | 37.5% | 15.2% (+22.3)#44 | 11.1% (+26.4)#2,570 |
| 45. | 59419 | 37.5% | 15.2% (+22.3)#45 | 11.1% (+26.4)#2,583 |
| 46. | 59225 | 37.1% | 15.2% (+22.0)#46 | 11.1% (+26.1)#2,638 |
| 47. | 59528 | 37.1% | 15.2% (+22.0)#47 | 11.1% (+26.1)#2,640 |
| 48. | 59447 | 36.6% | 15.2% (+21.4)#48 | 11.1% (+25.5)#2,728 |
| 49. | 59526 | 35.9% | 15.2% (+20.7)#49 | 11.1% (+24.8)#2,848 |
| 50. | 59212 | 35.6% | 15.2% (+20.4)#50 | 11.1% (+24.5)#2,902 |
| 51. | 59424 | 35.5% | 15.2% (+20.3)#51 | 11.1% (+24.4)#2,926 |
| 52. | 59218 | 35.0% | 15.2% (+19.8)#52 | 11.1% (+23.9)#3,034 |
| 53. | 59542 | 34.8% | 15.2% (+19.6)#53 | 11.1% (+23.7)#3,080 |
| 54. | 59486 | 34.7% | 15.2% (+19.5)#54 | 11.1% (+23.6)#3,103 |
| 55. | 59344 | 34.5% | 15.2% (+19.3)#55 | 11.1% (+23.4)#3,150 |
| 56. | 59853 | 34.4% | 15.2% (+19.3)#56 | 11.1% (+23.4)#3,155 |
| 57. | 59046 | 34.3% | 15.2% (+19.2)#57 | 11.1% (+23.3)#3,174 |
| 58. | 59462 | 34.3% | 15.2% (+19.1)#58 | 11.1% (+23.2)#3,195 |
| 59. | 59041 | 33.4% | 15.2% (+18.3)#59 | 11.1% (+22.4)#3,397 |
| 60. | 59848 | 33.3% | 15.2% (+18.2)#60 | 11.1% (+22.3)#3,498 |
| 61. | 59240 | 33.3% | 15.2% (+18.2)#61 | 11.1% (+22.3)#3,511 |
| 62. | 59074 | 32.9% | 15.2% (+17.7)#62 | 11.1% (+21.9)#3,584 |
| 63. | 59323 | 32.5% | 15.2% (+17.4)#63 | 11.1% (+21.5)#3,668 |
| 64. | 59872 | 32.5% | 15.2% (+17.3)#64 | 11.1% (+21.4)#3,689 |
| 65. | 59050 | 32.4% | 15.2% (+17.2)#65 | 11.1% (+21.3)#3,709 |
| 66. | 59732 | 32.0% | 15.2% (+16.8)#66 | 11.1% (+20.9)#3,835 |
| 67. | 59066 | 31.6% | 15.2% (+16.4)#67 | 11.1% (+20.5)#3,943 |
| 68. | 59859 | 31.5% | 15.2% (+16.3)#68 | 11.1% (+20.4)#3,964 |
| 69. | 59338 | 31.4% | 15.2% (+16.3)#69 | 11.1% (+20.4)#3,995 |
| 70. | 59221 | 31.3% | 15.2% (+16.1)#70 | 11.1% (+20.2)#4,035 |
| 71. | 59250 | 30.8% | 15.2% (+15.6)#71 | 11.1% (+19.7)#4,208 |
| 72. | 59720 | 30.5% | 15.2% (+15.3)#72 | 11.1% (+19.4)#4,296 |
| 73. | 59482 | 30.5% | 15.2% (+15.3)#73 | 11.1% (+19.4)#4,309 |
| 74. | 59014 | 30.4% | 15.2% (+15.3)#74 | 11.1% (+19.4)#4,319 |
| 75. | 59540 | 30.4% | 15.2% (+15.2)#75 | 11.1% (+19.3)#4,352 |
| 76. | 59215 | 29.8% | 15.2% (+14.7)#76 | 11.1% (+18.8)#4,532 |
| 77. | 59913 | 29.8% | 15.2% (+14.6)#77 | 11.1% (+18.7)#4,555 |
| 78. | 59844 | 29.3% | 15.2% (+14.1)#78 | 11.1% (+18.2)#4,754 |
| 79. | 59824 | 29.2% | 15.2% (+14.1)#79 | 11.1% (+18.2)#4,781 |
| 80. | 59422 | 29.2% | 15.2% (+14.0)#80 | 11.1% (+18.1)#4,793 |
| 81. | 59036 | 28.8% | 15.2% (+13.6)#81 | 11.1% (+17.7)#4,967 |
| 82. | 59351 | 28.6% | 15.2% (+13.4)#82 | 11.1% (+17.5)#5,075 |
| 83. | 59260 | 28.6% | 15.2% (+13.4)#83 | 11.1% (+17.5)#5,088 |
| 84. | 59427 | 28.4% | 15.2% (+13.2)#84 | 11.1% (+17.3)#5,176 |
| 85. | 59520 | 28.2% | 15.2% (+13.0)#85 | 11.1% (+17.1)#5,239 |
| 86. | 59032 | 28.1% | 15.2% (+13.0)#86 | 11.1% (+17.1)#5,265 |
| 87. | 59219 | 28.0% | 15.2% (+12.8)#87 | 11.1% (+16.9)#5,323 |
| 88. | 59263 | 27.9% | 15.2% (+12.7)#88 | 11.1% (+16.8)#5,365 |
| 89. | 59003 | 27.7% | 15.2% (+12.5)#89 | 11.1% (+16.7)#5,445 |
| 90. | 59934 | 27.5% | 15.2% (+12.4)#90 | 11.1% (+16.5)#5,550 |
| 91. | 59031 | 27.3% | 15.2% (+12.1)#91 | 11.1% (+16.2)#5,659 |
| 92. | 59416 | 27.3% | 15.2% (+12.1)#92 | 11.1% (+16.2)#5,663 |
| 93. | 59336 | 27.3% | 15.2% (+12.1)#93 | 11.1% (+16.2)#5,674 |
| 94. | 59521 | 27.1% | 15.2% (+12.0)#94 | 11.1% (+16.1)#5,730 |
| 95. | 59027 | 27.1% | 15.2% (+11.9)#95 | 11.1% (+16.0)#5,752 |
| 96. | 59749 | 27.0% | 15.2% (+11.8)#96 | 11.1% (+15.9)#5,791 |
| 97. | 59523 | 26.9% | 15.2% (+11.8)#97 | 11.1% (+15.9)#5,833 |
| 98. | 59854 | 26.8% | 15.2% (+11.7)#98 | 11.1% (+15.8)#5,873 |
| 99. | 59821 | 26.6% | 15.2% (+11.4)#99 | 11.1% (+15.5)#6,003 |
| 100. | 59751 | 26.6% | 15.2% (+11.4)#100 | 11.1% (+15.5)#6,010 |
Common Questions
What are the Top 10 Zip Codes with the Highest Percentage of Population with a Degree in Education in Montana?
Top 10 Zip Codes with the Highest Percentage of Population with a Degree in Education in Montana are:
What zip code has the Highest Percentage of Population with a Degree in Education in Montana?
59064 has the Highest Percentage of Population with a Degree in Education in Montana with 100.0%.
What is the Percentage of Population with a Degree in Education in the State of Montana?
Percentage of Population with a Degree in Education in Montana is 15.2%.
What is the Percentage of Population with a Degree in Education in the United States?
Percentage of Population with a Degree in Education in the United States is 11.1%.